
 Login Sign Up


| |||||
 |  | ||||

| 12Stocks.com Market Intelligence |
Best S&P 500 Stocks
|
On this page, you will find the most comprehensive analysis of S&P 500 stocks and ETFs - from latest trends to performances to charts ➞. First, here are the year-to-date (YTD) performances of the most requested S&P 500 stocks at 12Stocks.com (click stock for review):
| NVIDIA 66% | ||
| Caterpillar 23% | ||
| Amazon.com 18% | ||
| Merck 16% | ||
| Google 13% | ||
| JPMorgan Chase 13% | ||
| Walmart 12% | ||
| Goldman Sachs 10% | ||
| Chevron 9% | ||
| Microsoft 8% | ||
| Johnson & Johnson -4% | ||
| McDonald s -7% | ||
| Starbucks -8% | ||
| Apple -13% | ||
| Gilead -17% | ||
| Intel -32% | ||
| Boeing -35% | ||
| Quick: S&P 500 Stocks Lists: Performances & Trends, S&P 500 Stock Charts
Sort S&P 500 stocks: Daily, Weekly, Year-to-Date, Market Cap & Trends. Filter S&P 500 stocks list by sector: Show all, Tech, Finance, Energy, Staples, Retail, Industrial, Materials, Utilities and HealthCare |
| 12Stocks.com S&P 500 Stocks Performances & Trends Daily Report | |||||||||
|
| 
The overall Smart Investing & Trading Score is 58 (0-bearish to 100-bullish) which puts S&P 500 index in short term neutral trend. The Smart Investing & Trading Score from previous trading session is 51 and hence an improvement of trend. | ||||||||
Here are the Smart Investing & Trading Scores of the most requested S&P 500 stocks at 12Stocks.com (click stock name for detailed review):
|


| 12Stocks.com: Top Performing S&P 500 Index Stocks | ||||||||||||||||||||||||||||||||||||||||||||||||
 The top performing S&P 500 Index stocks year to date are
Now, more recently, over last week, the top performing S&P 500 Index stocks on the move are


|
||||||||||||||||||||||||||||||||||||||||||||||||
| 12Stocks.com: Investing in S&P 500 Index with Stocks | |
|
The following table helps investors and traders sort through current performance and trends (as measured by Smart Investing & Trading Score) of various
stocks in the S&P 500 Index. Quick View: Move mouse or cursor over stock symbol (ticker) to view short-term technical chart and over stock name to view long term chart. Click on  to add stock symbol to your watchlist and to add stock symbol to your watchlist and  to view watchlist. Click on any ticker or stock name for detailed market intelligence report for that stock. to view watchlist. Click on any ticker or stock name for detailed market intelligence report for that stock. |
12Stocks.com Performance of Stocks in S&P 500 Index
| Ticker | Stock Name | Watchlist | Category | Recent Price | Smart Investing & Trading Score | Change % | YTD Change% |
| F | Ford Motor |   | Consumer Staples | 12.96 | 85 | 0.62% | 6.32% |
| PGR | Progressive | | Financials | 213.88 | 83 | 0.41% | 34.28% |
| AOS | A. O. | | Industrials | 88.07 | 83 | 1.35% | 6.83% |
| FMC | FMC | | Materials | 58.91 | 83 | 1.14% | -6.56% |
| ROP | Roper Technologies | | Industrials | 542.15 | 83 | 0.56% | -0.55% |
| CINF | Cincinnati Financial | | Financials | 121.42 | 83 | 0.38% | 17.36% |
| PEG | Public Service | | Utilities | 66.45 | 83 | -0.39% | 8.67% |
| FE | First | | Utilities | 38.14 | 83 | -0.18% | 4.04% |
| SRE | Sempra | | Utilities | 71.31 | 82 | 0.25% | -4.58% |
| GE | General Electric | | Industrials | 160.23 | 80 | 6.68% | 25.54% |
| WST | West Pharmaceutical | | Health Care | 390.26 | 80 | 3.97% | 10.83% |
| COST | Costco Wholesale | | Services & Goods | 722.67 | 80 | 1.01% | 9.48% |
| LUV | Southwest Airlines | | Transports | 29.80 | 80 | 0.24% | 3.19% |
| CMA | Comerica | | Financials | 52.78 | 80 | 0.33% | -5.42% |
| MCHP | Microchip | | Technology | 86.89 | 78 | 4.02% | -3.65% |
| LMT | Lockheed Martin | | Industrials | 460.47 | 78 | -0.19% | 1.60% |
| TFC | Truist Financial | | Financials | 38.95 | 78 | 2.35% | 5.51% |
| LDOS | Leidos Holdings | | Technology | 127.76 | 78 | 1.37% | 18.03% |
| FDX | FedEx | | Transports | 271.98 | 78 | 0.68% | 7.51% |
| L | Loews | | Financials | 76.57 | 78 | 0.12% | 10.03% |
| PCG | PG&E | | Utilities | 16.97 | 77 | 0.12% | -5.88% |
| TXN | Texas Instruments | | Technology | 166.48 | 76 | 1.87% | -2.33% |
| OTIS | Otis Worldwide | | Industrials | 97.42 | 76 | 1.17% | 8.89% |
| JCI | Johnson Controls | | Consumer Staples | 65.33 | 76 | 1.08% | 13.35% |
| FIS | Fidelity National | | Technology | 71.99 | 76 | 0.97% | 19.84% |
| For chart view version of above stock list: Chart View ➞ 0 - 25 , 25 - 50 , 50 - 75 , 75 - 100 , 100 - 125 , 125 - 150 , 150 - 175 , 175 - 200 , 200 - 225 , 225 - 250 , 250 - 275 , 275 - 300 , 300 - 325 , 325 - 350 , 350 - 375 , 375 - 400 , 400 - 425 , 425 - 450 , 450 - 475 , 475 - 500 | ||
 | Click To Change The Sort Order: By Market Cap or Company Size Performance: Year-to-date, Week and Day |  |
|
Get the most comprehensive stock market coverage daily at 12Stocks.com ➞ Best Stocks Today ➞ Best Stocks Weekly ➞ Best Stocks Year-to-Date ➞ Best Stocks Trends ➞  Best Stocks Today 12Stocks.com Best Nasdaq Stocks ➞ Best S&P 500 Stocks ➞ Best Tech Stocks ➞ Best Biotech Stocks ➞ |
| Detailed Overview of S&P 500 Stocks |
| S&P 500 Technical Overview, Leaders & Laggards, Top S&P 500 ETF Funds & Detailed S&P 500 Stocks List, Charts, Trends & More |
| S&P 500: Technical Analysis, Trends & YTD Performance | |
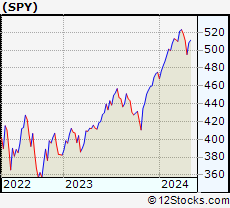
| S&P 500 index as represented by
SPY, an exchange-traded fund [ETF], holds basket of five hundred (mostly largecap) stocks from across all major sectors of the US stock market. The S&P 500 index (contains stocks like Apple and Exxon) is up by 6.39% and is currently outperforming the overall market by 0.66% year-to-date. Below is a quick view of technical charts and trends: | |
 SPY Weekly Chart |
|
| Long Term Trend: Good | |
| Medium Term Trend: Not Good | |
 SPY Daily Chart |
|
| Short Term Trend: Very Good | |
| Overall Trend Score: 58 | |
| YTD Performance: 6.39% | |
| **Trend Scores & Views Are Only For Educational Purposes And Not For Investing | |
| 12Stocks.com: Investing in S&P 500 Index using Exchange Traded Funds | |
|
The following table shows list of key exchange traded funds (ETF) that
help investors track S&P 500 index. The following list also includes leveraged ETF funds that track twice or thrice the daily returns of S&P 500 indices. Short or inverse ETF funds move in the opposite direction to the index they track and are useful during market pullbacks or during bear markets. Quick View: Move mouse or cursor over ETF symbol (ticker) to view short-term technical chart and over ETF name to view long term chart. Click on ticker or stock name for detailed view. Click on to add stock symbol to your watchlist and to view watchlist. |
12Stocks.com List of ETFs that track S&P 500 Index
| Ticker | ETF Name | Watchlist | Recent Price | Smart Investing & Trading Score | Change % | Week % | Year-to-date % |
| SPY | SPDR S&P 500 ETF | | 505.70 | 58 | 1.20 | 2.13 | 6.39% |
| IVV | iShares Core S&P 500 ETF | | 506.60 | 58 | 1.69 | 1.82 | 6.06% |
| VOO | Vanguard 500 ETF | | 463.37 | 58 | 1.70 | 1.82 | 6.08% |
| OEF | iShares S&P 100 | | 239.96 | 58 | 1.33 | 2.25 | 7.42% |
| SSO | ProShares Ultra S&P500 | | 72.10 | 63 | 2.52 | 4.33 | 10.8% |
| UPRO | ProShares UltraPro S&P500 | | 63.03 | 58 | 3.75 | 6.54 | 15.14% |
| SPXL | Direxion Daily S&P500 Bull 3X ETF | | 118.62 | 58 | 2.75 | 5.39 | 14.07% |
| SH | ProShares Short S&P500 | | 12.32 | 42 | -1.32 | -2.1 | -5.12% |
| SDS | ProShares UltraShort S&P500 | | 26.74 | 37 | -2.44 | -4.16 | -10.63% |
| SPXU | ProShares UltraPro Short S&P500 | | 35.97 | 42 | -3.67 | -6.16 | -16.35% |
| SPXS | Direxion Daily S&P 500 Bear 3X ETF | | 9.82 | 32 | -4.75 | -5.21 | -14.98% |
| 12Stocks.com: Charts, Trends, Fundamental Data and Performances of S&P 500 Stocks | |
|
We now take in-depth look at all S&P 500 stocks including charts, multi-period performances and overall trends (as measured by Smart Investing & Trading Score). One can sort S&P 500 stocks (click link to choose) by Daily, Weekly and by Year-to-Date performances. Also, one can sort by size of the company or by market capitalization. |
| Select Your Default Chart Type: | |||||
| |||||
| Click on stock symbol or name for detailed view. Click on to add stock symbol to your watchlist and to view watchlist. Quick View: Move mouse or cursor over "Daily" to quickly view daily technical stock chart and over "Weekly" to view weekly technical stock chart. | |||||

 | F Ford Motor Company |
| Sector: Consumer Staples | |
| SubSector: Auto Manufacturers - Major | |
| MarketCap: 19052.1 Millions | |
| Recent Price: 12.96 Smart Investing & Trading Score: 85 | |
| Day Percent Change: 0.62% Day Change: 0.08 | |
| Week Change: 6.75% Year-to-date Change: 6.3% | |
| F Links: Profile News Message Board | |
| Charts:- Daily , Weekly | |
| Add F to Watchlist: View: Get F Trend Analysis ➞ | |
 | PGR The Progressive Corporation |
| Sector: Financials | |
| SubSector: Property & Casualty Insurance | |
| MarketCap: 43112 Millions | |
| Recent Price: 213.88 Smart Investing & Trading Score: 83 | |
| Day Percent Change: 0.41% Day Change: 0.88 | |
| Week Change: -0.38% Year-to-date Change: 34.3% | |
| PGR Links: Profile News Message Board | |
| Charts:- Daily , Weekly | |
| Add PGR to Watchlist: View: Get PGR Trend Analysis ➞ | |
 | AOS A. O. Smith Corporation |
| Sector: Industrials | |
| SubSector: Industrial Electrical Equipment | |
| MarketCap: 5809.89 Millions | |
| Recent Price: 88.07 Smart Investing & Trading Score: 83 | |
| Day Percent Change: 1.35% Day Change: 1.17 | |
| Week Change: 2.32% Year-to-date Change: 6.8% | |
| AOS Links: Profile News Message Board | |
| Charts:- Daily , Weekly | |
| Add AOS to Watchlist: View: Get AOS Trend Analysis ➞ | |
 | FMC FMC Corporation |
| Sector: Materials | |
| SubSector: Chemicals - Major Diversified | |
| MarketCap: 9068.36 Millions | |
| Recent Price: 58.91 Smart Investing & Trading Score: 83 | |
| Day Percent Change: 1.14% Day Change: 0.66 | |
| Week Change: 1.89% Year-to-date Change: -6.6% | |
| FMC Links: Profile News Message Board | |
| Charts:- Daily , Weekly | |
| Add FMC to Watchlist: View: Get FMC Trend Analysis ➞ | |
 | ROP Roper Technologies, Inc. |
| Sector: Industrials | |
| SubSector: Diversified Machinery | |
| MarketCap: 33366.2 Millions | |
| Recent Price: 542.15 Smart Investing & Trading Score: 83 | |
| Day Percent Change: 0.56% Day Change: 3.04 | |
| Week Change: 1.45% Year-to-date Change: -0.6% | |
| ROP Links: Profile News Message Board | |
| Charts:- Daily , Weekly | |
| Add ROP to Watchlist: View: Get ROP Trend Analysis ➞ | |
 | CINF Cincinnati Financial Corporation |
| Sector: Financials | |
| SubSector: Property & Casualty Insurance | |
| MarketCap: 13637 Millions | |
| Recent Price: 121.42 Smart Investing & Trading Score: 83 | |
| Day Percent Change: 0.38% Day Change: 0.46 | |
| Week Change: 1.23% Year-to-date Change: 17.4% | |
| CINF Links: Profile News Message Board | |
| Charts:- Daily , Weekly | |
| Add CINF to Watchlist: View: Get CINF Trend Analysis ➞ | |
 | PEG Public Service Enterprise Group Incorporated |
| Sector: Utilities | |
| SubSector: Diversified Utilities | |
| MarketCap: 20886 Millions | |
| Recent Price: 66.45 Smart Investing & Trading Score: 83 | |
| Day Percent Change: -0.39% Day Change: -0.26 | |
| Week Change: 1.08% Year-to-date Change: 8.7% | |
| PEG Links: Profile News Message Board | |
| Charts:- Daily , Weekly | |
| Add PEG to Watchlist: View: Get PEG Trend Analysis ➞ | |
 | FE FirstEnergy Corp. |
| Sector: Utilities | |
| SubSector: Electric Utilities | |
| MarketCap: 20754.1 Millions | |
| Recent Price: 38.14 Smart Investing & Trading Score: 83 | |
| Day Percent Change: -0.18% Day Change: -0.07 | |
| Week Change: -0.08% Year-to-date Change: 4.0% | |
| FE Links: Profile News Message Board | |
| Charts:- Daily , Weekly | |
| Add FE to Watchlist: View: Get FE Trend Analysis ➞ | |
 | SRE Sempra Energy |
| Sector: Utilities | |
| SubSector: Diversified Utilities | |
| MarketCap: 34339.9 Millions | |
| Recent Price: 71.31 Smart Investing & Trading Score: 82 | |
| Day Percent Change: 0.25% Day Change: 0.18 | |
| Week Change: 1.76% Year-to-date Change: -4.6% | |
| SRE Links: Profile News Message Board | |
| Charts:- Daily , Weekly | |
| Add SRE to Watchlist: View: Get SRE Trend Analysis ➞ | |
 | GE General Electric Company |
| Sector: Industrials | |
| SubSector: Diversified Machinery | |
| MarketCap: 64710.6 Millions | |
| Recent Price: 160.23 Smart Investing & Trading Score: 80 | |
| Day Percent Change: 6.68% Day Change: 10.04 | |
| Week Change: 8.22% Year-to-date Change: 25.5% | |
| GE Links: Profile News Message Board | |
| Charts:- Daily , Weekly | |
| Add GE to Watchlist: View: Get GE Trend Analysis ➞ | |
 | WST West Pharmaceutical Services, Inc. |
| Sector: Health Care | |
| SubSector: Medical Instruments & Supplies | |
| MarketCap: 9989 Millions | |
| Recent Price: 390.26 Smart Investing & Trading Score: 80 | |
| Day Percent Change: 3.97% Day Change: 14.91 | |
| Week Change: 4.9% Year-to-date Change: 10.8% | |
| WST Links: Profile News Message Board | |
| Charts:- Daily , Weekly | |
| Add WST to Watchlist: View: Get WST Trend Analysis ➞ | |
 | COST Costco Wholesale Corporation |
| Sector: Services & Goods | |
| SubSector: Discount, Variety Stores | |
| MarketCap: 136355 Millions | |
| Recent Price: 722.67 Smart Investing & Trading Score: 80 | |
| Day Percent Change: 1.01% Day Change: 7.21 | |
| Week Change: 1.85% Year-to-date Change: 9.5% | |
| COST Links: Profile News Message Board | |
| Charts:- Daily , Weekly | |
| Add COST to Watchlist: View: Get COST Trend Analysis ➞ | |
 | LUV Southwest Airlines Co. |
| Sector: Transports | |
| SubSector: Regional Airlines | |
| MarketCap: 19463.3 Millions | |
| Recent Price: 29.80 Smart Investing & Trading Score: 80 | |
| Day Percent Change: 0.24% Day Change: 0.07 | |
| Week Change: 1.43% Year-to-date Change: 3.2% | |
| LUV Links: Profile News Message Board | |
| Charts:- Daily , Weekly | |
| Add LUV to Watchlist: View: Get LUV Trend Analysis ➞ | |
 | CMA Comerica Incorporated |
| Sector: Financials | |
| SubSector: Money Center Banks | |
| MarketCap: 4449.49 Millions | |
| Recent Price: 52.78 Smart Investing & Trading Score: 80 | |
| Day Percent Change: 0.33% Day Change: 0.17 | |
| Week Change: 2.38% Year-to-date Change: -5.4% | |
| CMA Links: Profile News Message Board | |
| Charts:- Daily , Weekly | |
| Add CMA to Watchlist: View: Get CMA Trend Analysis ➞ | |
 | MCHP Microchip Technology Incorporated |
| Sector: Technology | |
| SubSector: Semiconductor - Broad Line | |
| MarketCap: 16826.3 Millions | |
| Recent Price: 86.89 Smart Investing & Trading Score: 78 | |
| Day Percent Change: 4.02% Day Change: 3.36 | |
| Week Change: 6.38% Year-to-date Change: -3.7% | |
| MCHP Links: Profile News Message Board | |
| Charts:- Daily , Weekly | |
| Add MCHP to Watchlist: View: Get MCHP Trend Analysis ➞ | |
 | LMT Lockheed Martin Corporation |
| Sector: Industrials | |
| SubSector: Aerospace/Defense Products & Services | |
| MarketCap: 94116.4 Millions | |
| Recent Price: 460.47 Smart Investing & Trading Score: 78 | |
| Day Percent Change: -0.19% Day Change: -0.86 | |
| Week Change: -0.73% Year-to-date Change: 1.6% | |
| LMT Links: Profile News Message Board | |
| Charts:- Daily , Weekly | |
| Add LMT to Watchlist: View: Get LMT Trend Analysis ➞ | |
 | TFC Truist Financial Corporation |
| Sector: Financials | |
| SubSector: Regional - Southeast Banks | |
| MarketCap: 44928.5 Millions | |
| Recent Price: 38.95 Smart Investing & Trading Score: 78 | |
| Day Percent Change: 2.35% Day Change: 0.89 | |
| Week Change: 5.86% Year-to-date Change: 5.5% | |
| TFC Links: Profile News Message Board | |
| Charts:- Daily , Weekly | |
| Add TFC to Watchlist: View: Get TFC Trend Analysis ➞ | |
 | LDOS Leidos Holdings, Inc. |
| Sector: Technology | |
| SubSector: Information Technology Services | |
| MarketCap: 11707.5 Millions | |
| Recent Price: 127.76 Smart Investing & Trading Score: 78 | |
| Day Percent Change: 1.37% Day Change: 1.72 | |
| Week Change: 2.28% Year-to-date Change: 18.0% | |
| LDOS Links: Profile News Message Board | |
| Charts:- Daily , Weekly | |
| Add LDOS to Watchlist: View: Get LDOS Trend Analysis ➞ | |
 | FDX FedEx Corporation |
| Sector: Transports | |
| SubSector: Air Delivery & Freight Services | |
| MarketCap: 33188 Millions | |
| Recent Price: 271.98 Smart Investing & Trading Score: 78 | |
| Day Percent Change: 0.68% Day Change: 1.83 | |
| Week Change: 1.87% Year-to-date Change: 7.5% | |
| FDX Links: Profile News Message Board | |
| Charts:- Daily , Weekly | |
| Add FDX to Watchlist: View: Get FDX Trend Analysis ➞ | |
 | L Loews Corporation |
| Sector: Financials | |
| SubSector: Property & Casualty Insurance | |
| MarketCap: 10768.2 Millions | |
| Recent Price: 76.57 Smart Investing & Trading Score: 78 | |
| Day Percent Change: 0.12% Day Change: 0.09 | |
| Week Change: 1.23% Year-to-date Change: 10.0% | |
| L Links: Profile News Message Board | |
| Charts:- Daily , Weekly | |
| Add L to Watchlist: View: Get L Trend Analysis ➞ | |
 | PCG PG&E Corporation |
| Sector: Utilities | |
| SubSector: Electric Utilities | |
| MarketCap: 5078.04 Millions | |
| Recent Price: 16.97 Smart Investing & Trading Score: 77 | |
| Day Percent Change: 0.12% Day Change: 0.02 | |
| Week Change: 0.71% Year-to-date Change: -5.9% | |
| PCG Links: Profile News Message Board | |
| Charts:- Daily , Weekly | |
| Add PCG to Watchlist: View: Get PCG Trend Analysis ➞ | |
 | TXN Texas Instruments Incorporated |
| Sector: Technology | |
| SubSector: Semiconductor - Broad Line | |
| MarketCap: 99509.1 Millions | |
| Recent Price: 166.48 Smart Investing & Trading Score: 76 | |
| Day Percent Change: 1.87% Day Change: 3.05 | |
| Week Change: 4.26% Year-to-date Change: -2.3% | |
| TXN Links: Profile News Message Board | |
| Charts:- Daily , Weekly | |
| Add TXN to Watchlist: View: Get TXN Trend Analysis ➞ | |
 | OTIS Otis Worldwide Corporation |
| Sector: Industrials | |
| SubSector: Specialty Industrial Machinery | |
| MarketCap: 27727 Millions | |
| Recent Price: 97.42 Smart Investing & Trading Score: 76 | |
| Day Percent Change: 1.17% Day Change: 1.13 | |
| Week Change: 1.71% Year-to-date Change: 8.9% | |
| OTIS Links: Profile News Message Board | |
| Charts:- Daily , Weekly | |
| Add OTIS to Watchlist: View: Get OTIS Trend Analysis ➞ | |
 | JCI Johnson Controls International plc |
| Sector: Consumer Staples | |
| SubSector: Auto Parts | |
| MarketCap: 21950.7 Millions | |
| Recent Price: 65.33 Smart Investing & Trading Score: 76 | |
| Day Percent Change: 1.08% Day Change: 0.69 | |
| Week Change: 2.63% Year-to-date Change: 13.4% | |
| JCI Links: Profile News Message Board | |
| Charts:- Daily , Weekly | |
| Add JCI to Watchlist: View: Get JCI Trend Analysis ➞ | |
 | FIS Fidelity National Information Services, Inc. |
| Sector: Technology | |
| SubSector: Information Technology Services | |
| MarketCap: 71126.8 Millions | |
| Recent Price: 71.99 Smart Investing & Trading Score: 76 | |
| Day Percent Change: 0.97% Day Change: 0.69 | |
| Week Change: 1.78% Year-to-date Change: 19.8% | |
| FIS Links: Profile News Message Board | |
| Charts:- Daily , Weekly | |
| Add FIS to Watchlist: View: Get FIS Trend Analysis ➞ | |
| For tabular summary view of above stock list: Summary View ➞ 0 - 25 , 25 - 50 , 50 - 75 , 75 - 100 , 100 - 125 , 125 - 150 , 150 - 175 , 175 - 200 , 200 - 225 , 225 - 250 , 250 - 275 , 275 - 300 , 300 - 325 , 325 - 350 , 350 - 375 , 375 - 400 , 400 - 425 , 425 - 450 , 450 - 475 , 475 - 500 | ||
| Click To Change The Sort Order: By Market Cap or Company Size Performance: Year-to-date, Week and Day | |
| Select Chart Type: | ||
|
Best Stocks Today 12Stocks.com |
© 2024 12Stocks.com Terms & Conditions Privacy Contact Us
All Information Provided Only For Education And Not To Be Used For Investing or Trading. See Terms & Conditions


One More Thing ... Get Best Stocks Delivered Daily!
Never Ever Miss A Move With Our Top Ten Stocks Lists
Find Best Stocks In Any Market - Bull or Bear Market
Take A Peek At Our Top Ten Stocks Lists: Daily, Weekly, Year-to-Date & Top Trends
Find Best Stocks In Any Market - Bull or Bear Market
Take A Peek At Our Top Ten Stocks Lists: Daily, Weekly, Year-to-Date & Top Trends
S&P 500 Stocks With Best Up Trends [0-bearish to 100-bullish]: Danaher [100], Kimberly-Clark [100], Quest Diagnostics[100], Hasbro [100], Philip Morris[100], American Express[100], Generac Holdings[100], Federal Realty[100], Morgan Stanley[100], Goldman Sachs[100], Equity Residential[100]
Best S&P 500 Stocks Year-to-Date:
NVIDIA [66.22%], Constellation [59.81%], Meta Platforms[40.47%], NRG [38.45%], Progressive [34.28%], Marathon [34.17%], Targa Resources[33.41%], Western Digital[33.37%], United Airlines[32.31%], Micron [31.78%], Diamondback [31.74%] Best S&P 500 Stocks This Week:
Globe Life[12.71%], General Electric[8.22%], NVIDIA [8.03%], Kimberly-Clark [7.68%], Danaher [7.3%], Enphase [7.28%], General Motors[7.23%], Norwegian Cruise[7.08%], Ford Motor[6.75%], ProShares UltraPro[6.54%], Pulte [6.53%] Best S&P 500 Stocks Daily:
Globe Life[13.31%], Danaher [7.04%], General Electric[6.68%], Kimberly-Clark [5.92%], Norwegian Cruise[5.64%], United Rentals[5.36%], General Motors[5.15%], Builders FirstSource[5.02%], Quest Diagnostics[4.98%], Waters [4.92%], Thermo Fisher[4.74%]