
 Login Sign Up


| |||||
 |  | ||||

| 12Stocks.com Market Intelligence |
Best S&P 500 Stocks
|
On this page, you will find the most comprehensive analysis of S&P 500 stocks and ETFs - from latest trends to performances to charts ➞. First, here are the year-to-date (YTD) performances of the most requested S&P 500 stocks at 12Stocks.com (click stock for review):
| NVIDIA 61% | ||
| Caterpillar 23% | ||
| Merck 17% | ||
| Amazon.com 16% | ||
| Walmart 14% | ||
| Google 13% | ||
| JPMorgan Chase 13% | ||
| Goldman Sachs 10% | ||
| Chevron 9% | ||
| Microsoft 9% | ||
| Johnson & Johnson -5% | ||
| McDonald s -7% | ||
| Starbucks -8% | ||
| Apple -13% | ||
| Gilead -17% | ||
| Intel -31% | ||
| Boeing -37% | ||
| Quick: S&P 500 Stocks Lists: Performances & Trends, S&P 500 Stock Charts
Sort S&P 500 stocks: Daily, Weekly, Year-to-Date, Market Cap & Trends. Filter S&P 500 stocks list by sector: Show all, Tech, Finance, Energy, Staples, Retail, Industrial, Materials, Utilities and HealthCare |
| 12Stocks.com S&P 500 Stocks Performances & Trends Daily Report | |||||||||
|
| 
The overall Smart Investing & Trading Score is 58 (0-bearish to 100-bullish) which puts S&P 500 index in short term neutral trend. The Smart Investing & Trading Score from previous trading session is 51 and an improvement of trend continues. | ||||||||
Here are the Smart Investing & Trading Scores of the most requested S&P 500 stocks at 12Stocks.com (click stock name for detailed review):
|


| 12Stocks.com: Top Performing S&P 500 Index Stocks | ||||||||||||||||||||||||||||||||||||||||||||||||
 The top performing S&P 500 Index stocks year to date are
Now, more recently, over last week, the top performing S&P 500 Index stocks on the move are


|
||||||||||||||||||||||||||||||||||||||||||||||||
| 12Stocks.com: Investing in S&P 500 Index with Stocks | |
|
The following table helps investors and traders sort through current performance and trends (as measured by Smart Investing & Trading Score) of various
stocks in the S&P 500 Index. Quick View: Move mouse or cursor over stock symbol (ticker) to view short-term technical chart and over stock name to view long term chart. Click on  to add stock symbol to your watchlist and to add stock symbol to your watchlist and  to view watchlist. Click on any ticker or stock name for detailed market intelligence report for that stock. to view watchlist. Click on any ticker or stock name for detailed market intelligence report for that stock. |
12Stocks.com Performance of Stocks in S&P 500 Index
| Ticker | Stock Name | Watchlist | Category | Recent Price | Smart Investing & Trading Score | Change % | YTD Change% |
| CPRT | Copart |   | Services & Goods | 54.82 | 58 | 0.94 | 11.88% |
| MDLZ | Mondelez | | Consumer Staples | 71.42 | 64 | 0.94 | -1.40% |
| AXON | Axovant | | Health Care | 304.38 | 58 | 0.93 | 17.82% |
| AAPL | Apple | | Technology | 168.42 | 42 | 0.91 | -12.52% |
| LW | Lamb Weston | | Consumer Staples | 84.48 | 64 | 0.91 | -21.84% |
| KDP | Keurig Dr | | Consumer Staples | 32.05 | 73 | 0.91 | -3.81% |
| MAA | Mid-America Apartment | | Financials | 128.63 | 69 | 0.90 | -4.33% |
| MCK | McKesson | | Services & Goods | 536.73 | 65 | 0.89 | 15.93% |
| WEC | WEC | | Utilities | 82.69 | 86 | 0.89 | -1.76% |
| NI | NiSource | | Utilities | 28.18 | 93 | 0.88 | 6.12% |
| KEY | KeyCorp | | Financials | 14.85 | 61 | 0.88 | 3.13% |
| CCL | Carnival | | Services & Goods | 14.92 | 49 | 0.88 | -19.53% |
| SJM | J. M. | | Consumer Staples | 118.74 | 74 | 0.88 | -6.05% |
| SO | Southern | | Utilities | 73.89 | 93 | 0.88 | 5.38% |
| INTU | Intuit | | Technology | 636.43 | 70 | 0.88 | 1.82% |
| SRE | Sempra | | Utilities | 72.14 | 75 | 0.87 | -3.46% |
| FTNT | Fortinet | | Technology | 65.36 | 55 | 0.86 | 11.66% |
| CF | CF Industries | | Materials | 79.21 | 54 | 0.85 | -0.36% |
| LNT | Alliant | | Utilities | 50.39 | 86 | 0.84 | -1.77% |
| ED | Consolidated Edison | | Utilities | 93.60 | 88 | 0.82 | 2.89% |
| AMP | Ameriprise Financial | | Financials | 410.98 | 36 | 0.81 | 8.20% |
| K | Kellogg | | Consumer Staples | 58.60 | 93 | 0.80 | 4.82% |
| SYK | Stryker | | Health Care | 337.55 | 45 | 0.79 | 12.72% |
| TSN | Tyson Foods | | Consumer Staples | 61.46 | 88 | 0.79 | 14.34% |
| CMG | Chipotle Mexican | | Services & Goods | 2937.99 | 83 | 0.79 | 28.47% |
| For chart view version of above stock list: Chart View ➞ 0 - 25 , 25 - 50 , 50 - 75 , 75 - 100 , 100 - 125 , 125 - 150 , 150 - 175 , 175 - 200 , 200 - 225 , 225 - 250 , 250 - 275 , 275 - 300 , 300 - 325 , 325 - 350 , 350 - 375 , 375 - 400 , 400 - 425 , 425 - 450 , 450 - 475 , 475 - 500 | ||
 | Click To Change The Sort Order: By Market Cap or Company Size Performance: Year-to-date, Week and Day |  |
|
Get the most comprehensive stock market coverage daily at 12Stocks.com ➞ Best Stocks Today ➞ Best Stocks Weekly ➞ Best Stocks Year-to-Date ➞ Best Stocks Trends ➞  Best Stocks Today 12Stocks.com Best Nasdaq Stocks ➞ Best S&P 500 Stocks ➞ Best Tech Stocks ➞ Best Biotech Stocks ➞ |
| Detailed Overview of S&P 500 Stocks |
| S&P 500 Technical Overview, Leaders & Laggards, Top S&P 500 ETF Funds & Detailed S&P 500 Stocks List, Charts, Trends & More |
| S&P 500: Technical Analysis, Trends & YTD Performance | |
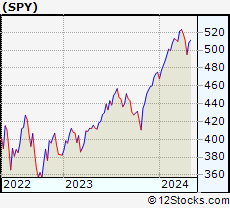
| S&P 500 index as represented by
SPY, an exchange-traded fund [ETF], holds basket of five hundred (mostly largecap) stocks from across all major sectors of the US stock market. The S&P 500 index (contains stocks like Apple and Exxon) is up by 6.24% and is currently outperforming the overall market by 0.75% year-to-date. Below is a quick view of technical charts and trends: | |
 SPY Weekly Chart |
|
| Long Term Trend: Good | |
| Medium Term Trend: Not Good | |
 SPY Daily Chart |
|
| Short Term Trend: Very Good | |
| Overall Trend Score: 58 | |
| YTD Performance: 6.24% | |
| **Trend Scores & Views Are Only For Educational Purposes And Not For Investing | |
| 12Stocks.com: Investing in S&P 500 Index using Exchange Traded Funds | |
|
The following table shows list of key exchange traded funds (ETF) that
help investors track S&P 500 index. The following list also includes leveraged ETF funds that track twice or thrice the daily returns of S&P 500 indices. Short or inverse ETF funds move in the opposite direction to the index they track and are useful during market pullbacks or during bear markets. Quick View: Move mouse or cursor over ETF symbol (ticker) to view short-term technical chart and over ETF name to view long term chart. Click on ticker or stock name for detailed view. Click on to add stock symbol to your watchlist and to view watchlist. |
12Stocks.com List of ETFs that track S&P 500 Index
| Ticker | ETF Name | Watchlist | Recent Price | Smart Investing & Trading Score | Change % | Week % | Year-to-date % |
| SPY | SPDR S&P 500 ETF | | 504.96 | 58 | -0.14 | 1.98 | 6.24% |
| IVV | iShares Core S&P 500 ETF | | 507.44 | 63 | -0.14 | 1.99 | 6.24% |
| VOO | Vanguard 500 ETF | | 464.13 | 63 | -0.15 | 1.99 | 6.26% |
| OEF | iShares S&P 100 | | 239.64 | 58 | -0.13 | 2.11 | 7.27% |
| SSO | ProShares Ultra S&P500 | | 71.84 | 58 | -0.28 | 3.95 | 10.4% |
| UPRO | ProShares UltraPro S&P500 | | 62.70 | 58 | -0.37 | 5.98 | 14.54% |
| SPXL | Direxion Daily S&P500 Bull 3X ETF | | 119.11 | 63 | -0.33 | 5.83 | 14.54% |
| SH | ProShares Short S&P500 | | 12.35 | 42 | 0.08 | -1.91 | -4.93% |
| SDS | ProShares UltraShort S&P500 | | 26.84 | 42 | 0.22 | -3.8 | -10.29% |
| SPXU | ProShares UltraPro Short S&P500 | | 36.17 | 42 | 0.51 | -5.62 | -15.87% |
| SPXS | Direxion Daily S&P 500 Bear 3X ETF | | 9.78 | 32 | 0.31 | -5.6 | -15.32% |
| 12Stocks.com: Charts, Trends, Fundamental Data and Performances of S&P 500 Stocks | |
|
We now take in-depth look at all S&P 500 stocks including charts, multi-period performances and overall trends (as measured by Smart Investing & Trading Score). One can sort S&P 500 stocks (click link to choose) by Daily, Weekly and by Year-to-Date performances. Also, one can sort by size of the company or by market capitalization. |
| Select Your Default Chart Type: | |||||
| |||||
| Click on stock symbol or name for detailed view. Click on to add stock symbol to your watchlist and to view watchlist. Quick View: Move mouse or cursor over "Daily" to quickly view daily technical stock chart and over "Weekly" to view weekly technical stock chart. | |||||

 | CPRT Copart, Inc. |
| Sector: Services & Goods | |
| SubSector: Auto Dealerships | |
| MarketCap: 15462.1 Millions | |
| Recent Price: 54.82 Smart Investing & Trading Score: 58 | |
| Day Percent Change: 0.94% Day Change: 0.51 | |
| Week Change: 3.67% Year-to-date Change: 11.9% | |
| CPRT Links: Profile News Message Board | |
| Charts:- Daily , Weekly | |
| Add CPRT to Watchlist: View: Get CPRT Trend Analysis ➞ | |
 | MDLZ Mondelez International, Inc. |
| Sector: Consumer Staples | |
| SubSector: Confectioners | |
| MarketCap: 68385.8 Millions | |
| Recent Price: 71.42 Smart Investing & Trading Score: 64 | |
| Day Percent Change: 0.94% Day Change: 0.67 | |
| Week Change: 4.85% Year-to-date Change: -1.4% | |
| MDLZ Links: Profile News Message Board | |
| Charts:- Daily , Weekly | |
| Add MDLZ to Watchlist: View: Get MDLZ Trend Analysis ➞ | |
 | AXON Axovant Sciences Ltd. |
| Sector: Health Care | |
| SubSector: Biotechnology | |
| MarketCap: 1492.04 Millions | |
| Recent Price: 304.38 Smart Investing & Trading Score: 58 | |
| Day Percent Change: 0.93% Day Change: 2.81 | |
| Week Change: 3.67% Year-to-date Change: 17.8% | |
| AXON Links: Profile News Message Board | |
| Charts:- Daily , Weekly | |
| Add AXON to Watchlist: View: Get AXON Trend Analysis ➞ | |
 | AAPL Apple Inc. |
| Sector: Technology | |
| SubSector: Electronic Equipment | |
| MarketCap: 1112940 Millions | |
| Recent Price: 168.42 Smart Investing & Trading Score: 42 | |
| Day Percent Change: 0.91% Day Change: 1.52 | |
| Week Change: 2.07% Year-to-date Change: -12.5% | |
| AAPL Links: Profile News Message Board | |
| Charts:- Daily , Weekly | |
| Add AAPL to Watchlist: View: Get AAPL Trend Analysis ➞ | |
 | LW Lamb Weston Holdings, Inc. |
| Sector: Consumer Staples | |
| SubSector: Food - Major Diversified | |
| MarketCap: 7844.63 Millions | |
| Recent Price: 84.48 Smart Investing & Trading Score: 64 | |
| Day Percent Change: 0.91% Day Change: 0.76 | |
| Week Change: 4.3% Year-to-date Change: -21.8% | |
| LW Links: Profile News Message Board | |
| Charts:- Daily , Weekly | |
| Add LW to Watchlist: View: Get LW Trend Analysis ➞ | |
 | KDP Keurig Dr Pepper Inc. |
| Sector: Consumer Staples | |
| SubSector: Beverages - Soft Drinks | |
| MarketCap: 35295.2 Millions | |
| Recent Price: 32.05 Smart Investing & Trading Score: 73 | |
| Day Percent Change: 0.91% Day Change: 0.29 | |
| Week Change: 1.71% Year-to-date Change: -3.8% | |
| KDP Links: Profile News Message Board | |
| Charts:- Daily , Weekly | |
| Add KDP to Watchlist: View: Get KDP Trend Analysis ➞ | |
 | MAA Mid-America Apartment Communities, Inc. |
| Sector: Financials | |
| SubSector: REIT - Residential | |
| MarketCap: 11385.5 Millions | |
| Recent Price: 128.63 Smart Investing & Trading Score: 69 | |
| Day Percent Change: 0.90% Day Change: 1.14 | |
| Week Change: 2.03% Year-to-date Change: -4.3% | |
| MAA Links: Profile News Message Board | |
| Charts:- Daily , Weekly | |
| Add MAA to Watchlist: View: Get MAA Trend Analysis ➞ | |
 | MCK McKesson Corporation |
| Sector: Services & Goods | |
| SubSector: Drugs Wholesale | |
| MarketCap: 24096.7 Millions | |
| Recent Price: 536.73 Smart Investing & Trading Score: 65 | |
| Day Percent Change: 0.89% Day Change: 4.73 | |
| Week Change: 2.27% Year-to-date Change: 15.9% | |
| MCK Links: Profile News Message Board | |
| Charts:- Daily , Weekly | |
| Add MCK to Watchlist: View: Get MCK Trend Analysis ➞ | |
 | WEC WEC Energy Group, Inc. |
| Sector: Utilities | |
| SubSector: Electric Utilities | |
| MarketCap: 24852 Millions | |
| Recent Price: 82.69 Smart Investing & Trading Score: 86 | |
| Day Percent Change: 0.89% Day Change: 0.73 | |
| Week Change: 1.39% Year-to-date Change: -1.8% | |
| WEC Links: Profile News Message Board | |
| Charts:- Daily , Weekly | |
| Add WEC to Watchlist: View: Get WEC Trend Analysis ➞ | |
 | NI NiSource Inc. |
| Sector: Utilities | |
| SubSector: Diversified Utilities | |
| MarketCap: 9056.8 Millions | |
| Recent Price: 28.18 Smart Investing & Trading Score: 93 | |
| Day Percent Change: 0.88% Day Change: 0.25 | |
| Week Change: 2.16% Year-to-date Change: 6.1% | |
| NI Links: Profile News Message Board | |
| Charts:- Daily , Weekly | |
| Add NI to Watchlist: View: Get NI Trend Analysis ➞ | |
 | KEY KeyCorp |
| Sector: Financials | |
| SubSector: Regional - Midwest Banks | |
| MarketCap: 10045 Millions | |
| Recent Price: 14.85 Smart Investing & Trading Score: 61 | |
| Day Percent Change: 0.88% Day Change: 0.13 | |
| Week Change: 1.5% Year-to-date Change: 3.1% | |
| KEY Links: Profile News Message Board | |
| Charts:- Daily , Weekly | |
| Add KEY to Watchlist: View: Get KEY Trend Analysis ➞ | |
 | CCL Carnival Corporation & Plc |
| Sector: Services & Goods | |
| SubSector: Resorts & Casinos | |
| MarketCap: 11725.4 Millions | |
| Recent Price: 14.92 Smart Investing & Trading Score: 49 | |
| Day Percent Change: 0.88% Day Change: 0.13 | |
| Week Change: 5.67% Year-to-date Change: -19.5% | |
| CCL Links: Profile News Message Board | |
| Charts:- Daily , Weekly | |
| Add CCL to Watchlist: View: Get CCL Trend Analysis ➞ | |
 | SJM The J. M. Smucker Company |
| Sector: Consumer Staples | |
| SubSector: Processed & Packaged Goods | |
| MarketCap: 12635.8 Millions | |
| Recent Price: 118.74 Smart Investing & Trading Score: 74 | |
| Day Percent Change: 0.88% Day Change: 1.04 | |
| Week Change: 3.47% Year-to-date Change: -6.1% | |
| SJM Links: Profile News Message Board | |
| Charts:- Daily , Weekly | |
| Add SJM to Watchlist: View: Get SJM Trend Analysis ➞ | |
 | SO The Southern Company |
| Sector: Utilities | |
| SubSector: Electric Utilities | |
| MarketCap: 54483.6 Millions | |
| Recent Price: 73.89 Smart Investing & Trading Score: 93 | |
| Day Percent Change: 0.88% Day Change: 0.64 | |
| Week Change: 2.42% Year-to-date Change: 5.4% | |
| SO Links: Profile News Message Board | |
| Charts:- Daily , Weekly | |
| Add SO to Watchlist: View: Get SO Trend Analysis ➞ | |
 | INTU Intuit Inc. |
| Sector: Technology | |
| SubSector: Application Software | |
| MarketCap: 577035 Millions | |
| Recent Price: 636.43 Smart Investing & Trading Score: 70 | |
| Day Percent Change: 0.88% Day Change: 5.55 | |
| Week Change: 5.17% Year-to-date Change: 1.8% | |
| INTU Links: Profile News Message Board | |
| Charts:- Daily , Weekly | |
| Add INTU to Watchlist: View: Get INTU Trend Analysis ➞ | |
 | SRE Sempra Energy |
| Sector: Utilities | |
| SubSector: Diversified Utilities | |
| MarketCap: 34339.9 Millions | |
| Recent Price: 72.14 Smart Investing & Trading Score: 75 | |
| Day Percent Change: 0.87% Day Change: 0.63 | |
| Week Change: 2.95% Year-to-date Change: -3.5% | |
| SRE Links: Profile News Message Board | |
| Charts:- Daily , Weekly | |
| Add SRE to Watchlist: View: Get SRE Trend Analysis ➞ | |
 | FTNT Fortinet, Inc. |
| Sector: Technology | |
| SubSector: Application Software | |
| MarketCap: 16993.8 Millions | |
| Recent Price: 65.36 Smart Investing & Trading Score: 55 | |
| Day Percent Change: 0.86% Day Change: 0.56 | |
| Week Change: 3.08% Year-to-date Change: 11.7% | |
| FTNT Links: Profile News Message Board | |
| Charts:- Daily , Weekly | |
| Add FTNT to Watchlist: View: Get FTNT Trend Analysis ➞ | |
 | CF CF Industries Holdings, Inc. |
| Sector: Materials | |
| SubSector: Agricultural Chemicals | |
| MarketCap: 5581.89 Millions | |
| Recent Price: 79.21 Smart Investing & Trading Score: 54 | |
| Day Percent Change: 0.85% Day Change: 0.67 | |
| Week Change: -0.33% Year-to-date Change: -0.4% | |
| CF Links: Profile News Message Board | |
| Charts:- Daily , Weekly | |
| Add CF to Watchlist: View: Get CF Trend Analysis ➞ | |
 | LNT Alliant Energy Corporation |
| Sector: Utilities | |
| SubSector: Electric Utilities | |
| MarketCap: 10678.4 Millions | |
| Recent Price: 50.39 Smart Investing & Trading Score: 86 | |
| Day Percent Change: 0.84% Day Change: 0.42 | |
| Week Change: 1.14% Year-to-date Change: -1.8% | |
| LNT Links: Profile News Message Board | |
| Charts:- Daily , Weekly | |
| Add LNT to Watchlist: View: Get LNT Trend Analysis ➞ | |
 | ED Consolidated Edison, Inc. |
| Sector: Utilities | |
| SubSector: Electric Utilities | |
| MarketCap: 25012.3 Millions | |
| Recent Price: 93.60 Smart Investing & Trading Score: 88 | |
| Day Percent Change: 0.82% Day Change: 0.76 | |
| Week Change: 1.99% Year-to-date Change: 2.9% | |
| ED Links: Profile News Message Board | |
| Charts:- Daily , Weekly | |
| Add ED to Watchlist: View: Get ED Trend Analysis ➞ | |
 | AMP Ameriprise Financial, Inc. |
| Sector: Financials | |
| SubSector: Asset Management | |
| MarketCap: 13270.5 Millions | |
| Recent Price: 410.98 Smart Investing & Trading Score: 36 | |
| Day Percent Change: 0.81% Day Change: 3.29 | |
| Week Change: -1.45% Year-to-date Change: 8.2% | |
| AMP Links: Profile News Message Board | |
| Charts:- Daily , Weekly | |
| Add AMP to Watchlist: View: Get AMP Trend Analysis ➞ | |
 | K Kellogg Company |
| Sector: Consumer Staples | |
| SubSector: Processed & Packaged Goods | |
| MarketCap: 20264.6 Millions | |
| Recent Price: 58.60 Smart Investing & Trading Score: 93 | |
| Day Percent Change: 0.80% Day Change: 0.46 | |
| Week Change: 2.13% Year-to-date Change: 4.8% | |
| K Links: Profile News Message Board | |
| Charts:- Daily , Weekly | |
| Add K to Watchlist: View: Get K Trend Analysis ➞ | |
 | SYK Stryker Corporation |
| Sector: Health Care | |
| SubSector: Medical Appliances & Equipment | |
| MarketCap: 59441.3 Millions | |
| Recent Price: 337.55 Smart Investing & Trading Score: 45 | |
| Day Percent Change: 0.79% Day Change: 2.64 | |
| Week Change: 3.72% Year-to-date Change: 12.7% | |
| SYK Links: Profile News Message Board | |
| Charts:- Daily , Weekly | |
| Add SYK to Watchlist: View: Get SYK Trend Analysis ➞ | |
 | TSN Tyson Foods, Inc. |
| Sector: Consumer Staples | |
| SubSector: Meat Products | |
| MarketCap: 22124.1 Millions | |
| Recent Price: 61.46 Smart Investing & Trading Score: 88 | |
| Day Percent Change: 0.79% Day Change: 0.48 | |
| Week Change: 2.52% Year-to-date Change: 14.3% | |
| TSN Links: Profile News Message Board | |
| Charts:- Daily , Weekly | |
| Add TSN to Watchlist: View: Get TSN Trend Analysis ➞ | |
 | CMG Chipotle Mexican Grill, Inc. |
| Sector: Services & Goods | |
| SubSector: Restaurants | |
| MarketCap: 16849.9 Millions | |
| Recent Price: 2937.99 Smart Investing & Trading Score: 83 | |
| Day Percent Change: 0.79% Day Change: 22.99 | |
| Week Change: 2.4% Year-to-date Change: 28.5% | |
| CMG Links: Profile News Message Board | |
| Charts:- Daily , Weekly | |
| Add CMG to Watchlist: View: Get CMG Trend Analysis ➞ | |
| For tabular summary view of above stock list: Summary View ➞ 0 - 25 , 25 - 50 , 50 - 75 , 75 - 100 , 100 - 125 , 125 - 150 , 150 - 175 , 175 - 200 , 200 - 225 , 225 - 250 , 250 - 275 , 275 - 300 , 300 - 325 , 325 - 350 , 350 - 375 , 375 - 400 , 400 - 425 , 425 - 450 , 450 - 475 , 475 - 500 | ||
| Click To Change The Sort Order: By Market Cap or Company Size Performance: Year-to-date, Week and Day | |
| Select Chart Type: | ||
|
Best Stocks Today 12Stocks.com |
© 2024 12Stocks.com Terms & Conditions Privacy Contact Us
All Information Provided Only For Education And Not To Be Used For Investing or Trading. See Terms & Conditions


One More Thing ... Get Best Stocks Delivered Daily!
Never Ever Miss A Move With Our Top Ten Stocks Lists
Find Best Stocks In Any Market - Bull or Bear Market
Take A Peek At Our Top Ten Stocks Lists: Daily, Weekly, Year-to-Date & Top Trends
Find Best Stocks In Any Market - Bull or Bear Market
Take A Peek At Our Top Ten Stocks Lists: Daily, Weekly, Year-to-Date & Top Trends
S&P 500 Stocks With Best Up Trends [0-bearish to 100-bullish]: Hasbro [100], Wabtec [100], Boston Scientific[100], Texas Instruments[100], Synchrony Financial[100], EQT [100], Microchip [100], Equity Residential[100], Analog Devices[100], Essex Property[100], UDR [100]
Best S&P 500 Stocks Year-to-Date:
NVIDIA [61.14%], Constellation [59.4%], NRG [40.98%], Meta Platforms[39.28%], Targa Resources[34.05%], Marathon [33.41%], Progressive [33.29%], Western Digital[32.14%], Eaton [32.09%], Diamondback [31.84%], Micron [30.09%] Best S&P 500 Stocks This Week:
Globe Life[23.01%], Hasbro [17.18%], Wabtec [13.26%], Microchip [9.78%], Tesla [9.57%], Texas Instruments[8.95%], CoStar [8.9%], Boston Scientific[8.76%], Kimberly-Clark [8.44%], Synchrony Financial[8.37%], NXP Semiconductors[8.29%] Best S&P 500 Stocks Daily:
Hasbro [11.39%], Tesla [11.36%], Wabtec [9.97%], CoStar [8.44%], Globe Life[8.37%], Boston Scientific[6.15%], ON Semiconductor[5.38%], Texas Instruments[5.14%], Synchrony Financial[5.11%], MSCI [5.03%], Hilton Worldwide[4.23%]