
 Login Sign Up


| |||||
 |  | ||||

| 12Stocks.com Market Intelligence |
Best S&P 500 Stocks
|
On this page, you will find the most comprehensive analysis of S&P 500 stocks and ETFs - from latest trends to performances to charts ➞. First, here are the year-to-date (YTD) performances of the most requested S&P 500 stocks at 12Stocks.com (click stock for review):
| NVIDIA 61% | ||
| Caterpillar 21% | ||
| Amazon.com 17% | ||
| Merck 16% | ||
| Walmart 14% | ||
| Google 12% | ||
| JPMorgan Chase 11% | ||
| Chevron 9% | ||
| Goldman Sachs 8% | ||
| Microsoft 7% | ||
| Johnson & Johnson -5% | ||
| McDonald s -7% | ||
| Starbucks -8% | ||
| Apple -14% | ||
| Gilead -17% | ||
| Intel -32% | ||
| Boeing -35% | ||
| Quick: S&P 500 Stocks Lists: Performances & Trends, S&P 500 Stock Charts
Sort S&P 500 stocks: Daily, Weekly, Year-to-Date, Market Cap & Trends. Filter S&P 500 stocks list by sector: Show all, Tech, Finance, Energy, Staples, Retail, Industrial, Materials, Utilities and HealthCare |
| 12Stocks.com S&P 500 Stocks Performances & Trends Daily Report | |||||||||
|
| 
The overall Smart Investing & Trading Score is 51 (0-bearish to 100-bullish) which puts S&P 500 index in short term neutral trend. The Smart Investing & Trading Score from previous trading session is 26 and hence an improvement of trend. | ||||||||
Here are the Smart Investing & Trading Scores of the most requested S&P 500 stocks at 12Stocks.com (click stock name for detailed review):
|


| 12Stocks.com: Top Performing S&P 500 Index Stocks | ||||||||||||||||||||||||||||||||||||||||||||||||
 The top performing S&P 500 Index stocks year to date are
Now, more recently, over last week, the top performing S&P 500 Index stocks on the move are


|
||||||||||||||||||||||||||||||||||||||||||||||||
| 12Stocks.com: Investing in S&P 500 Index with Stocks | |
|
The following table helps investors and traders sort through current performance and trends (as measured by Smart Investing & Trading Score) of various
stocks in the S&P 500 Index. Quick View: Move mouse or cursor over stock symbol (ticker) to view short-term technical chart and over stock name to view long term chart. Click on  to add stock symbol to your watchlist and to add stock symbol to your watchlist and  to view watchlist. Click on any ticker or stock name for detailed market intelligence report for that stock. to view watchlist. Click on any ticker or stock name for detailed market intelligence report for that stock. |
12Stocks.com Performance of Stocks in S&P 500 Index
| Ticker | Stock Name | Watchlist | Category | Recent Price | Smart Investing & Trading Score | Change % | YTD Change% |
| AJG | Arthur J. |   | Financials | 237.52 | 65 | 0.40 | 5.62% |
| PNW | Pinnacle West | | Utilities | 74.70 | 100 | 0.40 | 3.98% |
| BRO | Brown & Brown | | Financials | 82.50 | 65 | 0.40 | 16.02% |
| YUM | Yum! Brands | | Services & Goods | 139.06 | 90 | 0.40 | 6.43% |
| ADBE | Adobe | | Technology | 466.89 | 20 | 0.40 | -21.74% |
| EPAM | EPAM Systems | | Technology | 246.95 | 10 | 0.40 | -16.95% |
| BA | Boeing | | Industrials | 170.48 | 35 | 0.39 | -34.60% |
| WMB | Williams | | Energy | 38.66 | 75 | 0.39 | 11.00% |
| MMM | 3M | | Industrials | 92.62 | 47 | 0.38 | -15.28% |
| SBAC | SBA | | Technology | 196.80 | 25 | 0.38 | -22.43% |
| REGN | Regeneron | | Health Care | 900.16 | 25 | 0.37 | 2.49% |
| NDSN | Nordson | | Industrials | 260.52 | 51 | 0.36 | -1.38% |
| OKE | ONEOK | | Utilities | 79.91 | 83 | 0.35 | 13.80% |
| AFL | Aflac | | Financials | 83.52 | 49 | 0.35 | 1.24% |
| FOX | Twenty-First Century | | Services & Goods | 28.97 | 74 | 0.35 | 4.77% |
| ICE | Intercontinental Exchange | | Financials | 131.65 | 51 | 0.34 | 2.51% |
| APA | Apache | | Energy | 32.47 | 54 | 0.34 | -9.50% |
| HLT | Hilton Worldwide | | Services & Goods | 195.14 | 36 | 0.34 | 7.17% |
| TFX | Teleflex | | Health Care | 207.27 | 28 | 0.34 | -16.87% |
| VRSN | VeriSign | | Technology | 184.74 | 42 | 0.34 | -10.30% |
| EXC | Exelon | | Utilities | 37.67 | 95 | 0.32 | 4.93% |
| ROST | Ross Stores | | Services & Goods | 133.77 | 25 | 0.32 | -3.34% |
| JBL | Jabil | | Technology | 119.13 | 0 | 0.32 | -6.49% |
| CE | Celanese | | Materials | 154.94 | 44 | 0.32 | -0.28% |
| WELL | Welltower | | Financials | 91.61 | 74 | 0.32 | 1.60% |
| For chart view version of above stock list: Chart View ➞ 0 - 25 , 25 - 50 , 50 - 75 , 75 - 100 , 100 - 125 , 125 - 150 , 150 - 175 , 175 - 200 , 200 - 225 , 225 - 250 , 250 - 275 , 275 - 300 , 300 - 325 , 325 - 350 , 350 - 375 , 375 - 400 , 400 - 425 , 425 - 450 , 450 - 475 , 475 - 500 | ||
 | Click To Change The Sort Order: By Market Cap or Company Size Performance: Year-to-date, Week and Day |  |
|
Get the most comprehensive stock market coverage daily at 12Stocks.com ➞ Best Stocks Today ➞ Best Stocks Weekly ➞ Best Stocks Year-to-Date ➞ Best Stocks Trends ➞  Best Stocks Today 12Stocks.com Best Nasdaq Stocks ➞ Best S&P 500 Stocks ➞ Best Tech Stocks ➞ Best Biotech Stocks ➞ |
| Detailed Overview of S&P 500 Stocks |
| S&P 500 Technical Overview, Leaders & Laggards, Top S&P 500 ETF Funds & Detailed S&P 500 Stocks List, Charts, Trends & More |
| S&P 500: Technical Analysis, Trends & YTD Performance | |
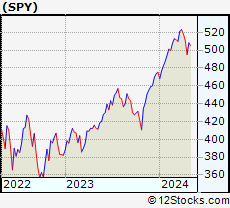
| S&P 500 index as represented by
SPY, an exchange-traded fund [ETF], holds basket of five hundred (mostly largecap) stocks from across all major sectors of the US stock market. The S&P 500 index (contains stocks like Apple and Exxon) is up by 5.14% and is currently outperforming the overall market by 0.75% year-to-date. Below is a quick view of technical charts and trends: | |
 SPY Weekly Chart |
|
| Long Term Trend: Good | |
| Medium Term Trend: Not Good | |
 SPY Daily Chart |
|
| Short Term Trend: Deteriorating | |
| Overall Trend Score: 51 | |
| YTD Performance: 5.14% | |
| **Trend Scores & Views Are Only For Educational Purposes And Not For Investing | |
| 12Stocks.com: Investing in S&P 500 Index using Exchange Traded Funds | |
|
The following table shows list of key exchange traded funds (ETF) that
help investors track S&P 500 index. The following list also includes leveraged ETF funds that track twice or thrice the daily returns of S&P 500 indices. Short or inverse ETF funds move in the opposite direction to the index they track and are useful during market pullbacks or during bear markets. Quick View: Move mouse or cursor over ETF symbol (ticker) to view short-term technical chart and over ETF name to view long term chart. Click on ticker or stock name for detailed view. Click on to add stock symbol to your watchlist and to view watchlist. |
12Stocks.com List of ETFs that track S&P 500 Index
| Ticker | ETF Name | Watchlist | Recent Price | Smart Investing & Trading Score | Change % | Week % | Year-to-date % |
| SPY | SPDR S&P 500 ETF | | 499.72 | 51 | 0.92 | 0.92 | 5.14% |
| IVV | iShares Core S&P 500 ETF | | 498.19 | 36 | 0.13 | 0.13 | 4.3% |
| VOO | Vanguard 500 ETF | | 455.61 | 36 | 0.11 | 0.11 | 4.31% |
| OEF | iShares S&P 100 | | 236.81 | 51 | 0.91 | 0.91 | 6.01% |
| SSO | ProShares Ultra S&P500 | | 70.33 | 51 | 1.77 | 1.77 | 8.08% |
| UPRO | ProShares UltraPro S&P500 | | 60.75 | 43 | 2.69 | 2.69 | 10.98% |
| SPXL | Direxion Daily S&P500 Bull 3X ETF | | 115.45 | 43 | 2.58 | 2.58 | 11.02% |
| SH | ProShares Short S&P500 | | 12.49 | 50 | -0.79 | -0.79 | -3.85% |
| SDS | ProShares UltraShort S&P500 | | 27.41 | 50 | -1.76 | -1.76 | -8.39% |
| SPXU | ProShares UltraPro Short S&P500 | | 37.34 | 50 | -2.58 | -2.58 | -13.16% |
| SPXS | Direxion Daily S&P 500 Bear 3X ETF | | 10.31 | 64 | -0.48 | -0.48 | -10.74% |
| 12Stocks.com: Charts, Trends, Fundamental Data and Performances of S&P 500 Stocks | |
|
We now take in-depth look at all S&P 500 stocks including charts, multi-period performances and overall trends (as measured by Smart Investing & Trading Score). One can sort S&P 500 stocks (click link to choose) by Daily, Weekly and by Year-to-Date performances. Also, one can sort by size of the company or by market capitalization. |
| Select Your Default Chart Type: | |||||
| |||||
| Click on stock symbol or name for detailed view. Click on to add stock symbol to your watchlist and to view watchlist. Quick View: Move mouse or cursor over "Daily" to quickly view daily technical stock chart and over "Weekly" to view weekly technical stock chart. | |||||

 | AJG Arthur J. Gallagher & Co. |
| Sector: Financials | |
| SubSector: Insurance Brokers | |
| MarketCap: 14852.2 Millions | |
| Recent Price: 237.52 Smart Investing & Trading Score: 65 | |
| Day Percent Change: 0.40% Day Change: 0.95 | |
| Week Change: 0.4% Year-to-date Change: 5.6% | |
| AJG Links: Profile News Message Board | |
| Charts:- Daily , Weekly | |
| Add AJG to Watchlist: View: Get AJG Trend Analysis ➞ | |
 | PNW Pinnacle West Capital Corporation |
| Sector: Utilities | |
| SubSector: Electric Utilities | |
| MarketCap: 8240.24 Millions | |
| Recent Price: 74.70 Smart Investing & Trading Score: 100 | |
| Day Percent Change: 0.40% Day Change: 0.30 | |
| Week Change: 0.4% Year-to-date Change: 4.0% | |
| PNW Links: Profile News Message Board | |
| Charts:- Daily , Weekly | |
| Add PNW to Watchlist: View: Get PNW Trend Analysis ➞ | |
 | BRO Brown & Brown, Inc. |
| Sector: Financials | |
| SubSector: Insurance Brokers | |
| MarketCap: 10475.7 Millions | |
| Recent Price: 82.50 Smart Investing & Trading Score: 65 | |
| Day Percent Change: 0.40% Day Change: 0.33 | |
| Week Change: 0.4% Year-to-date Change: 16.0% | |
| BRO Links: Profile News Message Board | |
| Charts:- Daily , Weekly | |
| Add BRO to Watchlist: View: Get BRO Trend Analysis ➞ | |
 | YUM Yum! Brands, Inc. |
| Sector: Services & Goods | |
| SubSector: Restaurants | |
| MarketCap: 18033.3 Millions | |
| Recent Price: 139.06 Smart Investing & Trading Score: 90 | |
| Day Percent Change: 0.40% Day Change: 0.56 | |
| Week Change: 0.4% Year-to-date Change: 6.4% | |
| YUM Links: Profile News Message Board | |
| Charts:- Daily , Weekly | |
| Add YUM to Watchlist: View: Get YUM Trend Analysis ➞ | |
 | ADBE Adobe Inc. |
| Sector: Technology | |
| SubSector: Application Software | |
| MarketCap: 157868 Millions | |
| Recent Price: 466.89 Smart Investing & Trading Score: 20 | |
| Day Percent Change: 0.40% Day Change: 1.87 | |
| Week Change: 0.4% Year-to-date Change: -21.7% | |
| ADBE Links: Profile News Message Board | |
| Charts:- Daily , Weekly | |
| Add ADBE to Watchlist: View: Get ADBE Trend Analysis ➞ | |
 | EPAM EPAM Systems, Inc. |
| Sector: Technology | |
| SubSector: Information Technology Services | |
| MarketCap: 11519.6 Millions | |
| Recent Price: 246.95 Smart Investing & Trading Score: 10 | |
| Day Percent Change: 0.40% Day Change: 0.99 | |
| Week Change: 0.4% Year-to-date Change: -17.0% | |
| EPAM Links: Profile News Message Board | |
| Charts:- Daily , Weekly | |
| Add EPAM to Watchlist: View: Get EPAM Trend Analysis ➞ | |
 | BA The Boeing Company |
| Sector: Industrials | |
| SubSector: Aerospace/Defense Products & Services | |
| MarketCap: 65336.4 Millions | |
| Recent Price: 170.48 Smart Investing & Trading Score: 35 | |
| Day Percent Change: 0.39% Day Change: 0.66 | |
| Week Change: 0.39% Year-to-date Change: -34.6% | |
| BA Links: Profile News Message Board | |
| Charts:- Daily , Weekly | |
| Add BA to Watchlist: View: Get BA Trend Analysis ➞ | |
 | WMB The Williams Companies, Inc. |
| Sector: Energy | |
| SubSector: Oil & Gas Pipelines | |
| MarketCap: 16851.5 Millions | |
| Recent Price: 38.66 Smart Investing & Trading Score: 75 | |
| Day Percent Change: 0.39% Day Change: 0.15 | |
| Week Change: 0.39% Year-to-date Change: 11.0% | |
| WMB Links: Profile News Message Board | |
| Charts:- Daily , Weekly | |
| Add WMB to Watchlist: View: Get WMB Trend Analysis ➞ | |
 | MMM 3M Company |
| Sector: Industrials | |
| SubSector: Diversified Machinery | |
| MarketCap: 79237.7 Millions | |
| Recent Price: 92.62 Smart Investing & Trading Score: 47 | |
| Day Percent Change: 0.38% Day Change: 0.35 | |
| Week Change: 0.38% Year-to-date Change: -15.3% | |
| MMM Links: Profile News Message Board | |
| Charts:- Daily , Weekly | |
| Add MMM to Watchlist: View: Get MMM Trend Analysis ➞ | |
 | SBAC SBA Communications Corporation |
| Sector: Technology | |
| SubSector: Diversified Communication Services | |
| MarketCap: 26712.3 Millions | |
| Recent Price: 196.80 Smart Investing & Trading Score: 25 | |
| Day Percent Change: 0.38% Day Change: 0.74 | |
| Week Change: 0.38% Year-to-date Change: -22.4% | |
| SBAC Links: Profile News Message Board | |
| Charts:- Daily , Weekly | |
| Add SBAC to Watchlist: View: Get SBAC Trend Analysis ➞ | |
 | REGN Regeneron Pharmaceuticals, Inc. |
| Sector: Health Care | |
| SubSector: Biotechnology | |
| MarketCap: 51903.7 Millions | |
| Recent Price: 900.16 Smart Investing & Trading Score: 25 | |
| Day Percent Change: 0.37% Day Change: 3.34 | |
| Week Change: 0.37% Year-to-date Change: 2.5% | |
| REGN Links: Profile News Message Board | |
| Charts:- Daily , Weekly | |
| Add REGN to Watchlist: View: Get REGN Trend Analysis ➞ | |
 | NDSN Nordson Corporation |
| Sector: Industrials | |
| SubSector: Diversified Machinery | |
| MarketCap: 7117.56 Millions | |
| Recent Price: 260.52 Smart Investing & Trading Score: 51 | |
| Day Percent Change: 0.36% Day Change: 0.93 | |
| Week Change: 0.36% Year-to-date Change: -1.4% | |
| NDSN Links: Profile News Message Board | |
| Charts:- Daily , Weekly | |
| Add NDSN to Watchlist: View: Get NDSN Trend Analysis ➞ | |
 | OKE ONEOK, Inc. |
| Sector: Utilities | |
| SubSector: Gas Utilities | |
| MarketCap: 10788.7 Millions | |
| Recent Price: 79.91 Smart Investing & Trading Score: 83 | |
| Day Percent Change: 0.35% Day Change: 0.28 | |
| Week Change: 0.35% Year-to-date Change: 13.8% | |
| OKE Links: Profile News Message Board | |
| Charts:- Daily , Weekly | |
| Add OKE to Watchlist: View: Get OKE Trend Analysis ➞ | |
 | AFL Aflac Incorporated |
| Sector: Financials | |
| SubSector: Accident & Health Insurance | |
| MarketCap: 22706 Millions | |
| Recent Price: 83.52 Smart Investing & Trading Score: 49 | |
| Day Percent Change: 0.35% Day Change: 0.29 | |
| Week Change: 0.35% Year-to-date Change: 1.2% | |
| AFL Links: Profile News Message Board | |
| Charts:- Daily , Weekly | |
| Add AFL to Watchlist: View: Get AFL Trend Analysis ➞ | |
 | FOX Twenty-First Century Fox, Inc. |
| Sector: Services & Goods | |
| SubSector: Entertainment - Diversified | |
| MarketCap: 24211.2 Millions | |
| Recent Price: 28.97 Smart Investing & Trading Score: 74 | |
| Day Percent Change: 0.35% Day Change: 0.10 | |
| Week Change: 0.35% Year-to-date Change: 4.8% | |
| FOX Links: Profile News Message Board | |
| Charts:- Daily , Weekly | |
| Add FOX to Watchlist: View: Get FOX Trend Analysis ➞ | |
 | ICE Intercontinental Exchange, Inc. |
| Sector: Financials | |
| SubSector: Diversified Investments | |
| MarketCap: 46054.6 Millions | |
| Recent Price: 131.65 Smart Investing & Trading Score: 51 | |
| Day Percent Change: 0.34% Day Change: 0.44 | |
| Week Change: 0.34% Year-to-date Change: 2.5% | |
| ICE Links: Profile News Message Board | |
| Charts:- Daily , Weekly | |
| Add ICE to Watchlist: View: Get ICE Trend Analysis ➞ | |
 | APA Apache Corporation |
| Sector: Energy | |
| SubSector: Independent Oil & Gas | |
| MarketCap: 1937.53 Millions | |
| Recent Price: 32.47 Smart Investing & Trading Score: 54 | |
| Day Percent Change: 0.34% Day Change: 0.11 | |
| Week Change: 0.34% Year-to-date Change: -9.5% | |
| APA Links: Profile News Message Board | |
| Charts:- Daily , Weekly | |
| Add APA to Watchlist: View: Get APA Trend Analysis ➞ | |
 | HLT Hilton Worldwide Holdings Inc. |
| Sector: Services & Goods | |
| SubSector: Lodging | |
| MarketCap: 18064.6 Millions | |
| Recent Price: 195.14 Smart Investing & Trading Score: 36 | |
| Day Percent Change: 0.34% Day Change: 0.67 | |
| Week Change: 0.34% Year-to-date Change: 7.2% | |
| HLT Links: Profile News Message Board | |
| Charts:- Daily , Weekly | |
| Add HLT to Watchlist: View: Get HLT Trend Analysis ➞ | |
 | TFX Teleflex Incorporated |
| Sector: Health Care | |
| SubSector: Medical Instruments & Supplies | |
| MarketCap: 12989.3 Millions | |
| Recent Price: 207.27 Smart Investing & Trading Score: 28 | |
| Day Percent Change: 0.34% Day Change: 0.71 | |
| Week Change: 0.34% Year-to-date Change: -16.9% | |
| TFX Links: Profile News Message Board | |
| Charts:- Daily , Weekly | |
| Add TFX to Watchlist: View: Get TFX Trend Analysis ➞ | |
 | VRSN VeriSign, Inc. |
| Sector: Technology | |
| SubSector: Internet Information Providers | |
| MarketCap: 19657 Millions | |
| Recent Price: 184.74 Smart Investing & Trading Score: 42 | |
| Day Percent Change: 0.34% Day Change: 0.62 | |
| Week Change: 0.34% Year-to-date Change: -10.3% | |
| VRSN Links: Profile News Message Board | |
| Charts:- Daily , Weekly | |
| Add VRSN to Watchlist: View: Get VRSN Trend Analysis ➞ | |
 | EXC Exelon Corporation |
| Sector: Utilities | |
| SubSector: Diversified Utilities | |
| MarketCap: 34091.9 Millions | |
| Recent Price: 37.67 Smart Investing & Trading Score: 95 | |
| Day Percent Change: 0.32% Day Change: 0.12 | |
| Week Change: 0.32% Year-to-date Change: 4.9% | |
| EXC Links: Profile News Message Board | |
| Charts:- Daily , Weekly | |
| Add EXC to Watchlist: View: Get EXC Trend Analysis ➞ | |
 | ROST Ross Stores, Inc. |
| Sector: Services & Goods | |
| SubSector: Apparel Stores | |
| MarketCap: 24938.8 Millions | |
| Recent Price: 133.77 Smart Investing & Trading Score: 25 | |
| Day Percent Change: 0.32% Day Change: 0.43 | |
| Week Change: 0.32% Year-to-date Change: -3.3% | |
| ROST Links: Profile News Message Board | |
| Charts:- Daily , Weekly | |
| Add ROST to Watchlist: View: Get ROST Trend Analysis ➞ | |
 | JBL Jabil Inc. |
| Sector: Technology | |
| SubSector: Printed Circuit Boards | |
| MarketCap: 3272.15 Millions | |
| Recent Price: 119.13 Smart Investing & Trading Score: 0 | |
| Day Percent Change: 0.32% Day Change: 0.38 | |
| Week Change: 0.32% Year-to-date Change: -6.5% | |
| JBL Links: Profile News Message Board | |
| Charts:- Daily , Weekly | |
| Add JBL to Watchlist: View: Get JBL Trend Analysis ➞ | |
 | CE Celanese Corporation |
| Sector: Materials | |
| SubSector: Chemicals - Major Diversified | |
| MarketCap: 8521.06 Millions | |
| Recent Price: 154.94 Smart Investing & Trading Score: 44 | |
| Day Percent Change: 0.32% Day Change: 0.49 | |
| Week Change: 0.32% Year-to-date Change: -0.3% | |
| CE Links: Profile News Message Board | |
| Charts:- Daily , Weekly | |
| Add CE to Watchlist: View: Get CE Trend Analysis ➞ | |
 | WELL Welltower Inc. |
| Sector: Financials | |
| SubSector: REIT - Healthcare Facilities | |
| MarketCap: 21398.8 Millions | |
| Recent Price: 91.61 Smart Investing & Trading Score: 74 | |
| Day Percent Change: 0.32% Day Change: 0.29 | |
| Week Change: 0.32% Year-to-date Change: 1.6% | |
| WELL Links: Profile News Message Board | |
| Charts:- Daily , Weekly | |
| Add WELL to Watchlist: View: Get WELL Trend Analysis ➞ | |
| For tabular summary view of above stock list: Summary View ➞ 0 - 25 , 25 - 50 , 50 - 75 , 75 - 100 , 100 - 125 , 125 - 150 , 150 - 175 , 175 - 200 , 200 - 225 , 225 - 250 , 250 - 275 , 275 - 300 , 300 - 325 , 325 - 350 , 350 - 375 , 375 - 400 , 400 - 425 , 425 - 450 , 450 - 475 , 475 - 500 | ||
| Click To Change The Sort Order: By Market Cap or Company Size Performance: Year-to-date, Week and Day | |
| Select Chart Type: | ||
|
Best Stocks Today 12Stocks.com |
© 2024 12Stocks.com Terms & Conditions Privacy Contact Us
All Information Provided Only For Education And Not To Be Used For Investing or Trading. See Terms & Conditions


One More Thing ... Get Best Stocks Delivered Daily!
Never Ever Miss A Move With Our Top Ten Stocks Lists
Find Best Stocks In Any Market - Bull or Bear Market
Take A Peek At Our Top Ten Stocks Lists: Daily, Weekly, Year-to-Date & Top Trends
Find Best Stocks In Any Market - Bull or Bear Market
Take A Peek At Our Top Ten Stocks Lists: Daily, Weekly, Year-to-Date & Top Trends
S&P 500 Stocks With Best Up Trends [0-bearish to 100-bullish]: United Airlines[100], EQT [100], Goldman Sachs[100], Capital One[100], Campbell Soup[100], Northrop Grumman[100], UDR [100], Kimberly-Clark [100], M&T Bank[100], Dominion [100], Church & Dwight Co[100]
Best S&P 500 Stocks Year-to-Date:
NVIDIA [60.57%], Constellation [56.45%], NRG [36.15%], Meta Platforms[36.08%], Progressive [33.73%], Marathon [33.63%], Targa Resources[31.01%], United Airlines[30.73%], Diamondback [30.63%], Western Digital[28.03%], Eaton [27.93%] Best S&P 500 Stocks This Week:
Ford Motor[6.1%], United Airlines[4.98%], NVIDIA [4.35%], Enphase [3.78%], DaVita [3.68%], EQT [3.6%], Zions Ban[3.51%], Truist Financial[3.42%], Goldman Sachs[3.3%], Seagate [3.3%], Blackstone [3.12%] Best S&P 500 Stocks Daily:
Ford Motor[6.10%], United Airlines[4.98%], NVIDIA [4.35%], Enphase [3.78%], DaVita [3.68%], EQT [3.60%], Zions Ban[3.51%], Truist Financial[3.42%], Goldman Sachs[3.30%], Seagate [3.30%], Blackstone [3.12%]