
 Login Sign Up


| |||||
 |  | ||||

| 12Stocks.com Market Intelligence |
Best S&P 500 Stocks
|
On this page, you will find the most comprehensive analysis of S&P 500 stocks and ETFs - from latest trends to performances to charts ➞. First, here are the year-to-date (YTD) performances of the most requested S&P 500 stocks at 12Stocks.com (click stock for review):
| NVIDIA 57% | ||
| Caterpillar 19% | ||
| Merck 15% | ||
| Amazon.com 14% | ||
| Walmart 13% | ||
| Google 10% | ||
| JPMorgan Chase 9% | ||
| Chevron 7% | ||
| Microsoft 6% | ||
| Goldman Sachs 5% | ||
| Johnson & Johnson -6% | ||
| McDonald s -8% | ||
| Starbucks -9% | ||
| Apple -14% | ||
| Gilead -18% | ||
| Intel -32% | ||
| Boeing -35% | ||
| Quick: S&P 500 Stocks Lists: Performances & Trends, S&P 500 Stock Charts
Sort S&P 500 stocks: Daily, Weekly, Year-to-Date, Market Cap & Trends. Filter S&P 500 stocks list by sector: Show all, Tech, Finance, Energy, Staples, Retail, Industrial, Materials, Utilities and HealthCare |
| 12Stocks.com S&P 500 Stocks Performances & Trends Daily Report | |||||||||
|
| 
The overall Smart Investing & Trading Score is 26 (0-bearish to 100-bullish) which puts S&P 500 index in short term bearish to neutral trend. The Smart Investing & Trading Score from previous trading session is 36 and hence a deterioration of trend. | ||||||||
Here are the Smart Investing & Trading Scores of the most requested S&P 500 stocks at 12Stocks.com (click stock name for detailed review):
|


| 12Stocks.com: Top Performing S&P 500 Index Stocks | ||||||||||||||||||||||||||||||||||||||||||||||||
 The top performing S&P 500 Index stocks year to date are
Now, more recently, over last week, the top performing S&P 500 Index stocks on the move are


|
||||||||||||||||||||||||||||||||||||||||||||||||
| 12Stocks.com: Investing in S&P 500 Index with Stocks | |
|
The following table helps investors and traders sort through current performance and trends (as measured by Smart Investing & Trading Score) of various
stocks in the S&P 500 Index. Quick View: Move mouse or cursor over stock symbol (ticker) to view short-term technical chart and over stock name to view long term chart. Click on  to add stock symbol to your watchlist and to add stock symbol to your watchlist and  to view watchlist. Click on any ticker or stock name for detailed market intelligence report for that stock. to view watchlist. Click on any ticker or stock name for detailed market intelligence report for that stock. |
12Stocks.com Performance of Stocks in S&P 500 Index
| Ticker | Stock Name | Watchlist | Category | Recent Price | Smart Investing & Trading Score | Change % | YTD Change% |
| ORCL | Oracle |   | Technology | 115.01 | 26 | -0.86% | 9.08% |
| PEP | PepsiCo | | Consumer Staples | 173.66 | 85 | 0.80% | 2.25% |
| NFLX | Netflix | | Technology | 554.53 | 0 | -9.18% | 13.90% |
| ADBE | Adobe | | Technology | 463.67 | 10 | -2.01% | -22.28% |
| XOM | Exxon Mobil | | Energy | 119.66 | 83 | 0.96% | 19.68% |
| NVDA | NVIDIA | | Technology | 776.07 | 26 | -8.34% | 56.71% |
| CRM | salesforce.com | | Technology | 269.23 | 10 | -0.99% | 2.31% |
| COST | Costco Wholesale | | Services & Goods | 704.84 | 26 | -0.90% | 6.78% |
| LLY | Eli Lilly | | Health Care | 723.17 | 26 | -3.05% | 24.06% |
| WFC | Wells Fargo | | Financials | 60.23 | 100 | 2.55% | 22.38% |
| ABT | Abbott | | Health Care | 107.01 | 17 | 1.65% | -2.78% |
| MCD | McDonald s | | Services & Goods | 271.69 | 49 | 0.26% | -8.37% |
| CVX | Chevron | | Energy | 159.97 | 88 | 1.52% | 7.25% |
| AMGN | Amgen | | Health Care | 267.39 | 35 | 1.77% | -7.16% |
| NKE | NIKE | | Consumer Staples | 95.07 | 69 | -0.70% | -12.43% |
| BMY | Bristol-Myers | | Health Care | 48.87 | 42 | 1.17% | -4.77% |
| MDT | Medtronic | | Health Care | 79.34 | 25 | 0.19% | -3.69% |
| TMO | Thermo Fisher | | Health Care | 543.20 | 40 | 0.31% | 2.34% |
| ABBV | AbbVie | | Health Care | 165.51 | 38 | 0.51% | 6.80% |
| PYPL | PayPal Holdings | | Financials | 61.81 | 36 | -0.47% | 0.65% |
| NEE | NextEra | | Utilities | 64.55 | 88 | 0.84% | 6.27% |
| ACN | Accenture | | Technology | 316.06 | 25 | 0.02% | -9.93% |
| PM | Philip Morris | | Consumer Staples | 93.17 | 100 | 2.16% | -0.97% |
| TXN | Texas Instruments | | Technology | 160.07 | 23 | -2.20% | -6.10% |
| GILD | Gilead | | Health Care | 66.48 | 10 | 0.48% | -17.94% |
| For chart view version of above stock list: Chart View ➞ 0 - 25 , 25 - 50 , 50 - 75 , 75 - 100 , 100 - 125 , 125 - 150 , 150 - 175 , 175 - 200 , 200 - 225 , 225 - 250 , 250 - 275 , 275 - 300 , 300 - 325 , 325 - 350 , 350 - 375 , 375 - 400 , 400 - 425 , 425 - 450 , 450 - 475 , 475 - 500 | ||
 | Click To Change The Sort Order: By Market Cap or Company Size Performance: Year-to-date, Week and Day |  |
|
Get the most comprehensive stock market coverage daily at 12Stocks.com ➞ Best Stocks Today ➞ Best Stocks Weekly ➞ Best Stocks Year-to-Date ➞ Best Stocks Trends ➞  Best Stocks Today 12Stocks.com Best Nasdaq Stocks ➞ Best S&P 500 Stocks ➞ Best Tech Stocks ➞ Best Biotech Stocks ➞ |
| Detailed Overview of S&P 500 Stocks |
| S&P 500 Technical Overview, Leaders & Laggards, Top S&P 500 ETF Funds & Detailed S&P 500 Stocks List, Charts, Trends & More |
| S&P 500: Technical Analysis, Trends & YTD Performance | |
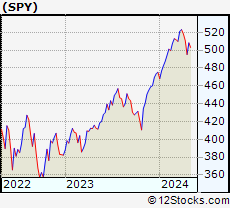
| S&P 500 index as represented by
SPY, an exchange-traded fund [ETF], holds basket of five hundred (mostly largecap) stocks from across all major sectors of the US stock market. The S&P 500 index (contains stocks like Apple and Exxon) is up by 4.06% and is currently outperforming the overall market by 0.91% year-to-date. Below is a quick view of technical charts and trends: | |
 SPY Weekly Chart |
|
| Long Term Trend: Good | |
| Medium Term Trend: Not Good | |
 SPY Daily Chart |
|
| Short Term Trend: Not Good | |
| Overall Trend Score: 26 | |
| YTD Performance: 4.06% | |
| **Trend Scores & Views Are Only For Educational Purposes And Not For Investing | |
| 12Stocks.com: Investing in S&P 500 Index using Exchange Traded Funds | |
|
The following table shows list of key exchange traded funds (ETF) that
help investors track S&P 500 index. The following list also includes leveraged ETF funds that track twice or thrice the daily returns of S&P 500 indices. Short or inverse ETF funds move in the opposite direction to the index they track and are useful during market pullbacks or during bear markets. Quick View: Move mouse or cursor over ETF symbol (ticker) to view short-term technical chart and over ETF name to view long term chart. Click on ticker or stock name for detailed view. Click on to add stock symbol to your watchlist and to view watchlist. |
12Stocks.com List of ETFs that track S&P 500 Index
| Ticker | ETF Name | Watchlist | Recent Price | Smart Investing & Trading Score | Change % | Week % | Year-to-date % |
| SPY | SPDR S&P 500 ETF | | 494.62 | 26 | -0.98 | -3.18 | 4.06% |
| IVV | iShares Core S&P 500 ETF | | 496.60 | 36 | -1.05 | -3.26 | 3.97% |
| VOO | Vanguard 500 ETF | | 454.18 | 36 | -1.04 | -3.28 | 3.98% |
| OEF | iShares S&P 100 | | 234.37 | 26 | -1.37 | -3.61 | 4.92% |
| SSO | ProShares Ultra S&P500 | | 68.82 | 26 | -2.15 | -6.57 | 5.76% |
| UPRO | ProShares UltraPro S&P500 | | 58.91 | 26 | -3.08 | -9.65 | 7.62% |
| SPXL | Direxion Daily S&P500 Bull 3X ETF | | 111.64 | 36 | -3.37 | -9.85 | 7.36% |
| SH | ProShares Short S&P500 | | 12.61 | 74 | 1.12 | 3.45 | -2.93% |
| SDS | ProShares UltraShort S&P500 | | 27.97 | 74 | 2.04 | 6.88 | -6.52% |
| SPXU | ProShares UltraPro Short S&P500 | | 38.22 | 74 | 2.38 | 9.64 | -11.12% |
| SPXS | Direxion Daily S&P 500 Bear 3X ETF | | 10.44 | 49 | 3.21 | 10.77 | -9.65% |
| 12Stocks.com: Charts, Trends, Fundamental Data and Performances of S&P 500 Stocks | |
|
We now take in-depth look at all S&P 500 stocks including charts, multi-period performances and overall trends (as measured by Smart Investing & Trading Score). One can sort S&P 500 stocks (click link to choose) by Daily, Weekly and by Year-to-Date performances. Also, one can sort by size of the company or by market capitalization. |
| Select Your Default Chart Type: | |||||
| |||||
| Click on stock symbol or name for detailed view. Click on to add stock symbol to your watchlist and to view watchlist. Quick View: Move mouse or cursor over "Daily" to quickly view daily technical stock chart and over "Weekly" to view weekly technical stock chart. | |||||

 | ORCL Oracle Corporation |
| Sector: Technology | |
| SubSector: Application Software | |
| MarketCap: 164530 Millions | |
| Recent Price: 115.01 Smart Investing & Trading Score: 26 | |
| Day Percent Change: -0.86% Day Change: -1.00 | |
| Week Change: -5.04% Year-to-date Change: 9.1% | |
| ORCL Links: Profile News Message Board | |
| Charts:- Daily , Weekly | |
| Add ORCL to Watchlist: View: Get ORCL Trend Analysis ➞ | |
 | PEP PepsiCo, Inc. |
| Sector: Consumer Staples | |
| SubSector: Beverages - Soft Drinks | |
| MarketCap: 162458 Millions | |
| Recent Price: 173.66 Smart Investing & Trading Score: 85 | |
| Day Percent Change: 0.80% Day Change: 1.38 | |
| Week Change: 3.3% Year-to-date Change: 2.3% | |
| PEP Links: Profile News Message Board | |
| Charts:- Daily , Weekly | |
| Add PEP to Watchlist: View: Get PEP Trend Analysis ➞ | |
 | NFLX Netflix, Inc. |
| Sector: Technology | |
| SubSector: CATV Systems | |
| MarketCap: 162108 Millions | |
| Recent Price: 554.53 Smart Investing & Trading Score: 0 | |
| Day Percent Change: -9.18% Day Change: -56.02 | |
| Week Change: -10.97% Year-to-date Change: 13.9% | |
| NFLX Links: Profile News Message Board | |
| Charts:- Daily , Weekly | |
| Add NFLX to Watchlist: View: Get NFLX Trend Analysis ➞ | |
 | ADBE Adobe Inc. |
| Sector: Technology | |
| SubSector: Application Software | |
| MarketCap: 157868 Millions | |
| Recent Price: 463.67 Smart Investing & Trading Score: 10 | |
| Day Percent Change: -2.01% Day Change: -9.51 | |
| Week Change: -2.2% Year-to-date Change: -22.3% | |
| ADBE Links: Profile News Message Board | |
| Charts:- Daily , Weekly | |
| Add ADBE to Watchlist: View: Get ADBE Trend Analysis ➞ | |
 | XOM Exxon Mobil Corporation |
| Sector: Energy | |
| SubSector: Major Integrated Oil & Gas | |
| MarketCap: 156450 Millions | |
| Recent Price: 119.66 Smart Investing & Trading Score: 83 | |
| Day Percent Change: 0.96% Day Change: 1.14 | |
| Week Change: -0.59% Year-to-date Change: 19.7% | |
| XOM Links: Profile News Message Board | |
| Charts:- Daily , Weekly | |
| Add XOM to Watchlist: View: Get XOM Trend Analysis ➞ | |
 | NVDA NVIDIA Corporation |
| Sector: Technology | |
| SubSector: Semiconductor - Specialized | |
| MarketCap: 143476 Millions | |
| Recent Price: 776.07 Smart Investing & Trading Score: 26 | |
| Day Percent Change: -8.34% Day Change: -70.64 | |
| Week Change: -12% Year-to-date Change: 56.7% | |
| NVDA Links: Profile News Message Board | |
| Charts:- Daily , Weekly | |
| Add NVDA to Watchlist: View: Get NVDA Trend Analysis ➞ | |
 | CRM salesforce.com, inc. |
| Sector: Technology | |
| SubSector: Application Software | |
| MarketCap: 137120 Millions | |
| Recent Price: 269.23 Smart Investing & Trading Score: 10 | |
| Day Percent Change: -0.99% Day Change: -2.69 | |
| Week Change: -8.52% Year-to-date Change: 2.3% | |
| CRM Links: Profile News Message Board | |
| Charts:- Daily , Weekly | |
| Add CRM to Watchlist: View: Get CRM Trend Analysis ➞ | |
 | COST Costco Wholesale Corporation |
| Sector: Services & Goods | |
| SubSector: Discount, Variety Stores | |
| MarketCap: 136355 Millions | |
| Recent Price: 704.84 Smart Investing & Trading Score: 26 | |
| Day Percent Change: -0.90% Day Change: -6.41 | |
| Week Change: -3.62% Year-to-date Change: 6.8% | |
| COST Links: Profile News Message Board | |
| Charts:- Daily , Weekly | |
| Add COST to Watchlist: View: Get COST Trend Analysis ➞ | |
 | LLY Eli Lilly and Company |
| Sector: Health Care | |
| SubSector: Drug Manufacturers - Major | |
| MarketCap: 130066 Millions | |
| Recent Price: 723.17 Smart Investing & Trading Score: 26 | |
| Day Percent Change: -3.05% Day Change: -22.78 | |
| Week Change: -3.79% Year-to-date Change: 24.1% | |
| LLY Links: Profile News Message Board | |
| Charts:- Daily , Weekly | |
| Add LLY to Watchlist: View: Get LLY Trend Analysis ➞ | |
 | WFC Wells Fargo & Company |
| Sector: Financials | |
| SubSector: Money Center Banks | |
| MarketCap: 129138 Millions | |
| Recent Price: 60.23 Smart Investing & Trading Score: 100 | |
| Day Percent Change: 2.55% Day Change: 1.49 | |
| Week Change: 6.67% Year-to-date Change: 22.4% | |
| WFC Links: Profile News Message Board | |
| Charts:- Daily , Weekly | |
| Add WFC to Watchlist: View: Get WFC Trend Analysis ➞ | |
 | ABT Abbott Laboratories |
| Sector: Health Care | |
| SubSector: Medical Appliances & Equipment | |
| MarketCap: 125288 Millions | |
| Recent Price: 107.01 Smart Investing & Trading Score: 17 | |
| Day Percent Change: 1.65% Day Change: 1.74 | |
| Week Change: -1.92% Year-to-date Change: -2.8% | |
| ABT Links: Profile News Message Board | |
| Charts:- Daily , Weekly | |
| Add ABT to Watchlist: View: Get ABT Trend Analysis ➞ | |
 | MCD McDonald s Corporation |
| Sector: Services & Goods | |
| SubSector: Restaurants | |
| MarketCap: 122481 Millions | |
| Recent Price: 271.69 Smart Investing & Trading Score: 49 | |
| Day Percent Change: 0.26% Day Change: 0.71 | |
| Week Change: 1.61% Year-to-date Change: -8.4% | |
| MCD Links: Profile News Message Board | |
| Charts:- Daily , Weekly | |
| Add MCD to Watchlist: View: Get MCD Trend Analysis ➞ | |
 | CVX Chevron Corporation |
| Sector: Energy | |
| SubSector: Major Integrated Oil & Gas | |
| MarketCap: 121521 Millions | |
| Recent Price: 159.97 Smart Investing & Trading Score: 88 | |
| Day Percent Change: 1.52% Day Change: 2.40 | |
| Week Change: 0.64% Year-to-date Change: 7.3% | |
| CVX Links: Profile News Message Board | |
| Charts:- Daily , Weekly | |
| Add CVX to Watchlist: View: Get CVX Trend Analysis ➞ | |
 | AMGN Amgen Inc. |
| Sector: Health Care | |
| SubSector: Biotechnology | |
| MarketCap: 121030 Millions | |
| Recent Price: 267.39 Smart Investing & Trading Score: 35 | |
| Day Percent Change: 1.77% Day Change: 4.64 | |
| Week Change: 0.04% Year-to-date Change: -7.2% | |
| AMGN Links: Profile News Message Board | |
| Charts:- Daily , Weekly | |
| Add AMGN to Watchlist: View: Get AMGN Trend Analysis ➞ | |
 | NKE NIKE, Inc. |
| Sector: Consumer Staples | |
| SubSector: Textile - Apparel Footwear & Accessories | |
| MarketCap: 118918 Millions | |
| Recent Price: 95.07 Smart Investing & Trading Score: 69 | |
| Day Percent Change: -0.70% Day Change: -0.67 | |
| Week Change: 3.34% Year-to-date Change: -12.4% | |
| NKE Links: Profile News Message Board | |
| Charts:- Daily , Weekly | |
| Add NKE to Watchlist: View: Get NKE Trend Analysis ➞ | |
 | BMY Bristol-Myers Squibb Company |
| Sector: Health Care | |
| SubSector: Drug Manufacturers - Major | |
| MarketCap: 117052 Millions | |
| Recent Price: 48.87 Smart Investing & Trading Score: 42 | |
| Day Percent Change: 1.17% Day Change: 0.57 | |
| Week Change: 1.21% Year-to-date Change: -4.8% | |
| BMY Links: Profile News Message Board | |
| Charts:- Daily , Weekly | |
| Add BMY to Watchlist: View: Get BMY Trend Analysis ➞ | |
 | MDT Medtronic plc |
| Sector: Health Care | |
| SubSector: Medical Appliances & Equipment | |
| MarketCap: 113698 Millions | |
| Recent Price: 79.34 Smart Investing & Trading Score: 25 | |
| Day Percent Change: 0.19% Day Change: 0.15 | |
| Week Change: -0.99% Year-to-date Change: -3.7% | |
| MDT Links: Profile News Message Board | |
| Charts:- Daily , Weekly | |
| Add MDT to Watchlist: View: Get MDT Trend Analysis ➞ | |
 | TMO Thermo Fisher Scientific Inc. |
| Sector: Health Care | |
| SubSector: Medical Laboratories & Research | |
| MarketCap: 112999 Millions | |
| Recent Price: 543.20 Smart Investing & Trading Score: 40 | |
| Day Percent Change: 0.31% Day Change: 1.68 | |
| Week Change: -3.9% Year-to-date Change: 2.3% | |
| TMO Links: Profile News Message Board | |
| Charts:- Daily , Weekly | |
| Add TMO to Watchlist: View: Get TMO Trend Analysis ➞ | |
 | ABBV AbbVie Inc. |
| Sector: Health Care | |
| SubSector: Drug Manufacturers - Major | |
| MarketCap: 110080 Millions | |
| Recent Price: 165.51 Smart Investing & Trading Score: 38 | |
| Day Percent Change: 0.51% Day Change: 0.84 | |
| Week Change: 1.99% Year-to-date Change: 6.8% | |
| ABBV Links: Profile News Message Board | |
| Charts:- Daily , Weekly | |
| Add ABBV to Watchlist: View: Get ABBV Trend Analysis ➞ | |
 | PYPL PayPal Holdings, Inc. |
| Sector: Financials | |
| SubSector: Credit Services | |
| MarketCap: 108949 Millions | |
| Recent Price: 61.81 Smart Investing & Trading Score: 36 | |
| Day Percent Change: -0.47% Day Change: -0.29 | |
| Week Change: -4.3% Year-to-date Change: 0.7% | |
| PYPL Links: Profile News Message Board | |
| Charts:- Daily , Weekly | |
| Add PYPL to Watchlist: View: Get PYPL Trend Analysis ➞ | |
 | NEE NextEra Energy, Inc. |
| Sector: Utilities | |
| SubSector: Electric Utilities | |
| MarketCap: 108288 Millions | |
| Recent Price: 64.55 Smart Investing & Trading Score: 88 | |
| Day Percent Change: 0.84% Day Change: 0.54 | |
| Week Change: 2.33% Year-to-date Change: 6.3% | |
| NEE Links: Profile News Message Board | |
| Charts:- Daily , Weekly | |
| Add NEE to Watchlist: View: Get NEE Trend Analysis ➞ | |
 | ACN Accenture plc |
| Sector: Technology | |
| SubSector: Information Technology Services | |
| MarketCap: 106627 Millions | |
| Recent Price: 316.06 Smart Investing & Trading Score: 25 | |
| Day Percent Change: 0.02% Day Change: 0.06 | |
| Week Change: 0.21% Year-to-date Change: -9.9% | |
| ACN Links: Profile News Message Board | |
| Charts:- Daily , Weekly | |
| Add ACN to Watchlist: View: Get ACN Trend Analysis ➞ | |
 | PM Philip Morris International Inc. |
| Sector: Consumer Staples | |
| SubSector: Cigarettes | |
| MarketCap: 105035 Millions | |
| Recent Price: 93.17 Smart Investing & Trading Score: 100 | |
| Day Percent Change: 2.16% Day Change: 1.97 | |
| Week Change: 4.86% Year-to-date Change: -1.0% | |
| PM Links: Profile News Message Board | |
| Charts:- Daily , Weekly | |
| Add PM to Watchlist: View: Get PM Trend Analysis ➞ | |
 | TXN Texas Instruments Incorporated |
| Sector: Technology | |
| SubSector: Semiconductor - Broad Line | |
| MarketCap: 99509.1 Millions | |
| Recent Price: 160.07 Smart Investing & Trading Score: 23 | |
| Day Percent Change: -2.20% Day Change: -3.60 | |
| Week Change: -3.76% Year-to-date Change: -6.1% | |
| TXN Links: Profile News Message Board | |
| Charts:- Daily , Weekly | |
| Add TXN to Watchlist: View: Get TXN Trend Analysis ➞ | |
 | GILD Gilead Sciences, Inc. |
| Sector: Health Care | |
| SubSector: Biotechnology | |
| MarketCap: 99485.6 Millions | |
| Recent Price: 66.48 Smart Investing & Trading Score: 10 | |
| Day Percent Change: 0.48% Day Change: 0.32 | |
| Week Change: -3.16% Year-to-date Change: -17.9% | |
| GILD Links: Profile News Message Board | |
| Charts:- Daily , Weekly | |
| Add GILD to Watchlist: View: Get GILD Trend Analysis ➞ | |
| For tabular summary view of above stock list: Summary View ➞ 0 - 25 , 25 - 50 , 50 - 75 , 75 - 100 , 100 - 125 , 125 - 150 , 150 - 175 , 175 - 200 , 200 - 225 , 225 - 250 , 250 - 275 , 275 - 300 , 300 - 325 , 325 - 350 , 350 - 375 , 375 - 400 , 400 - 425 , 425 - 450 , 450 - 475 , 475 - 500 | ||
| Click To Change The Sort Order: By Market Cap or Company Size Performance: Year-to-date, Week and Day | |
| Select Chart Type: | ||
|
Best Stocks Today 12Stocks.com |
© 2024 12Stocks.com Terms & Conditions Privacy Contact Us
All Information Provided Only For Education And Not To Be Used For Investing or Trading. See Terms & Conditions


One More Thing ... Get Best Stocks Delivered Daily!
Never Ever Miss A Move With Our Top Ten Stocks Lists
Find Best Stocks In Any Market - Bull or Bear Market
Take A Peek At Our Top Ten Stocks Lists: Daily, Weekly, Year-to-Date & Top Trends
Find Best Stocks In Any Market - Bull or Bear Market
Take A Peek At Our Top Ten Stocks Lists: Daily, Weekly, Year-to-Date & Top Trends
S&P 500 Stocks With Best Up Trends [0-bearish to 100-bullish]: Bunge [100], Kinder Morgan[100], Entergy [100], Wells Fargo[100], Duke [100], Philip Morris[100], General Mills[100], Lockheed Martin[100], Consolidated Edison[100], Conagra Brands[100], Genuine Parts[100]
Best S&P 500 Stocks Year-to-Date:
NVIDIA [56.71%], Constellation [52.26%], Meta Platforms[38.28%], Progressive [34.59%], NRG [34.26%], Marathon [31.63%], Targa Resources[29.75%], Diamondback [29.38%], Eaton [26.38%], Western Digital[25.66%], Valero [25.27%] Best S&P 500 Stocks This Week:
United Airlines[22.58%], UnitedHealth [13.96%], Genuine Parts[11.21%], Globe Life[10.86%], ProShares UltraPro[9.64%], American Airlines[7.11%], Southwest Airlines[6.79%], Wells Fargo[6.67%], General Mills[6.51%], Centene [6.15%], Bunge [6.1%] Best S&P 500 Stocks Daily:
Fifth Third[5.46%], American Express[5.14%], Bunge [3.38%], J. M.[3.24%], Bank of America[3.17%], Kinder Morgan[3.13%], Entergy [2.91%], Walgreens Boots[2.76%], Edison [2.72%], Aflac [2.70%], HCA Healthcare[2.59%]