
 Login Sign Up


| |||||
 |  | ||||

| 12Stocks.com Market Intelligence |
Best S&P 100 Stocks
| In a hurry? S&P 100 Stocks Lists: Performance Trends Table, Stock Charts
Sort S&P 100 stocks: Daily, Weekly, Year-to-Date, Market Cap & Trends. |
| 12Stocks.com S&P 100 Stocks Performances & Trends Daily | |||||||||
|
|  The overall Smart Investing & Trading Score is 58 (0-bearish to 100-bullish) which puts S&P 100 index in short term neutral trend. The Smart Investing & Trading Score from previous trading session is 51 and hence an improvement of trend.
| ||||||||
Here are the Smart Investing & Trading Scores of the most requested S&P 100 stocks at 12Stocks.com (click stock name for detailed review):
|


| 12Stocks.com: Top Performing S&P 100 Index Stocks | ||||||||||||||||||||||||||||||||||||||||||||||||
 The top performing S&P 100 Index stocks year to date are
Now, more recently, over last week, the top performing S&P 100 Index stocks on the move are


|
||||||||||||||||||||||||||||||||||||||||||||||||
| 12Stocks.com: Investing in S&P 100 Index with Stocks | |
|
The following table helps investors and traders sort through current performance and trends (as measured by Smart Investing & Trading Score) of various
stocks in the S&P 100 Index. Quick View: Move mouse or cursor over stock symbol (ticker) to view short-term technical chart and over stock name to view long term chart. Click on  to add stock symbol to your watchlist and to add stock symbol to your watchlist and  to view watchlist. Click on any ticker or stock name for detailed market intelligence report for that stock. to view watchlist. Click on any ticker or stock name for detailed market intelligence report for that stock. |
12Stocks.com Performance of Stocks in S&P 100 Index
| Ticker | Stock Name | Watchlist | Category | Recent Price | Smart Investing & Trading Score | Change % | YTD Change% |
| QCOM | QUALCOMM |   | Technology | 161.35 | 56 | 0.73% | 11.56% |
| IBM | Business | | Technology | 182.19 | 25 | 0.16% | 11.40% |
| CL | Colgate-Palmolive | | Consumer Staples | 88.58 | 85 | 0.28% | 11.13% |
| AIG | American | | Financials | 74.93 | 70 | -0.04% | 10.60% |
| BK | Bank of New York | | Financials | 57.44 | 95 | 0.49% | 10.36% |
| PG | Procter & Gamble | | Consumer Staples | 161.50 | 100 | 0.60% | 10.21% |
| GS | Goldman Sachs | | Financials | 424.00 | 100 | 1.59% | 9.91% |
| COST | Costco Wholesale | | Services & Goods | 722.68 | 80 | 1.01% | 9.48% |
| DHR | Danaher | | Industrials | 253.11 | 100 | 7.21% | 9.41% |
| ABBV | AbbVie | | Health Care | 169.54 | 73 | 0.98% | 9.40% |
| SCHW | Charles Schwab | | Financials | 75.23 | 100 | 1.31% | 9.35% |
| MET | MetLife | | Financials | 72.22 | 75 | 0.36% | 9.21% |
| CVX | Chevron | | Energy | 162.85 | 100 | 0.57% | 9.18% |
| ORCL | Oracle | | Technology | 115.09 | 36 | 0.49% | 9.16% |
| NEE | NextEra Energy | | Utilities | 66.20 | 100 | 1.36% | 8.99% |
| MA | Mastercard | | Financials | 462.82 | 58 | 1.33% | 8.51% |
| MSFT | Microsoft | | Technology | 407.57 | 58 | 1.65% | 8.38% |
| LIN | Linde | | Materials | 445.06 | 44 | -0.43% | 8.36% |
| TMO | Thermo Fisher | | Health Care | 574.59 | 85 | 4.78% | 8.25% |
| FDX | FedEx | | Transports | 271.75 | 78 | 0.59% | 7.42% |
| OEF | iShares S&P | | Utilities | 239.95 | 58 | 1.33% | 7.41% |
| SPY | SPDR S&P | | Utilities | 505.65 | 58 | 1.19% | 6.38% |
| MO | Altria | | Consumer Staples | 42.87 | 100 | 0.70% | 6.27% |
| F | Ford Motor | | Consumer Staples | 12.94 | 80 | 0.47% | 6.15% |
| VZ | Verizon | | Technology | 39.70 | 15 | 2.85% | 5.31% |
| For chart view version of above stock list: Chart View ➞ 0 - 25 , 25 - 50 , 50 - 75 , 75 - 100 , 100 - 125 | ||
 | Click To Change The Sort Order: By Market Cap or Company Size Performance: Year-to-date, Week and Day |  |
|
Get the most comprehensive stock market coverage daily at 12Stocks.com ➞ Best Stocks Today ➞ Best Stocks Weekly ➞ Best Stocks Year-to-Date ➞ Best Stocks Trends ➞  Best Stocks Today 12Stocks.com Best Nasdaq Stocks ➞ Best S&P 500 Stocks ➞ Best Tech Stocks ➞ Best Biotech Stocks ➞ |
| Detailed Overview of S&P 100 Stocks |
| S&P 100 Technical Overview, Leaders & Laggards, Top S&P 100 ETF Funds & Detailed S&P 100 Stocks List, Charts, Trends & More |
| S&P 100: Technical Analysis, Trends & YTD Performance | |
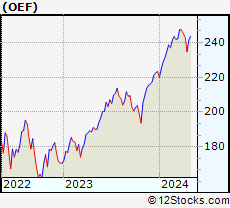
| S&P 100 index as represented by
OEF, an exchange-traded fund [ETF], holds basket of one hundred US (mostly largecap) stocks from across all major sectors of the US stock market. The S&P 100 index (contains stocks like Apple and Exxon) is up by 7.41% and is currently outperforming the overall market by 1.77% year-to-date. Below is a quick view of technical charts and trends: | |
 OEF Weekly Chart |
|
| Long Term Trend: Good | |
| Medium Term Trend: Not Good | |
 OEF Daily Chart |
|
| Short Term Trend: Very Good | |
| Overall Trend Score: 58 | |
| YTD Performance: 7.41% | |
| **Trend Scores & Views Are Only For Educational Purposes And Not For Investing | |
| 12Stocks.com: Investing in S&P 100 Index using Exchange Traded Funds | |
|
The following table shows list of key exchange traded funds (ETF) that
help investors track S&P 100 index. We have also included ETF funds that track S&P 500 index since it is market-cap weighted. The following list also includes leveraged ETF funds that track twice or thrice the daily returns of S&P 100 indices. Short or inverse ETF funds move in the opposite direction to the index they track and are useful during market pullbacks or during bear markets. Quick View: Move mouse or cursor over ETF symbol (ticker) to view short-term technical chart and over ETF name to view long term chart. Click on ticker or stock name for detailed view. Click on to add stock symbol to your watchlist and to view watchlist. |
12Stocks.com List of ETFs that track S&P 100 Index
| Ticker | ETF Name | Watchlist | Recent Price | Smart Investing & Trading Score | Change % | Week % | Year-to-date % |
| SPY | SPDR S&P 500 ETF | | 505.65 | 58 | 1.19 | 2.12 | 6.38% |
| SPXS | Direxion Daily S&P 500 Bear 3X ETF | | 9.75 | 32 | -5.43 | -5.89 | -15.58% |
| SH | ProShares Short S&P500 | | 12.34 | 42 | -1.20 | -1.99 | -5% |
| SDS | ProShares UltraShort S&P500 | | 26.78 | 37 | -2.30 | -4.01 | -10.49% |
| SSO | ProShares Ultra S&P500 | | 72.04 | 58 | 2.43 | 4.24 | 10.71% |
| SPXU | ProShares UltraPro Short S&P500 | | 35.99 | 42 | -3.62 | -6.1 | -16.3% |
| UPRO | ProShares UltraPro S&P500 | | 62.93 | 58 | 3.59 | 6.37 | 14.96% |
| SPXL | Direxion Daily S&P500 Bull 3X ETF | | 119.51 | 63 | 3.52 | 6.18 | 14.92% |
| VOO | Vanguard 500 ETF | | 464.84 | 63 | 2.03 | 2.14 | 6.42% |
| OEF | iShares S&P 100 | | 239.95 | 58 | 1.33 | 2.25 | 7.41% |
| 12Stocks.com: Charts, Trends, Fundamental Data and Performances of S&P 100 Stocks | |
|
We now take in-depth look at all S&P 100 stocks including charts, multi-period performances and overall trends (as measured by Smart Investing & Trading Score). One can sort S&P 100 stocks (click link to choose) by Daily, Weekly and by Year-to-Date performances. Also, one can sort by size of the company or by market capitalization. |
| Select Your Default Chart Type: | |||||
| |||||
| Click on stock symbol or name for detailed view. Click on to add stock symbol to your watchlist and to view watchlist. Quick View: Move mouse or cursor over "Daily" to quickly view daily technical stock chart and over "Weekly" to view weekly technical stock chart. | |||||
 | QCOM QUALCOMM Incorporated |
| Sector: Technology | |
| SubSector: Communication Equipment | |
| MarketCap: 77517.7 Millions | |
| Recent Price: 161.35 Smart Investing & Trading Score: 56 | |
| Day Percent Change: 0.73% Day Change: 1.17 | |
| Week Change: 2.36% Year-to-date Change: 11.6% | |
| QCOM Links: Profile News Message Board | |
| Charts:- Daily , Weekly | |
| Add QCOM to Watchlist: View: Get Complete QCOM Trend Analysis ➞ | |
 | IBM International Business Machines Corporation |
| Sector: Technology | |
| SubSector: Information Technology Services | |
| MarketCap: 97241.6 Millions | |
| Recent Price: 182.19 Smart Investing & Trading Score: 25 | |
| Day Percent Change: 0.16% Day Change: 0.29 | |
| Week Change: 0.34% Year-to-date Change: 11.4% | |
| IBM Links: Profile News Message Board | |
| Charts:- Daily , Weekly | |
| Add IBM to Watchlist: View: Get Complete IBM Trend Analysis ➞ | |
 | CL Colgate-Palmolive Company |
| Sector: Consumer Staples | |
| SubSector: Personal Products | |
| MarketCap: 57242.7 Millions | |
| Recent Price: 88.58 Smart Investing & Trading Score: 85 | |
| Day Percent Change: 0.28% Day Change: 0.25 | |
| Week Change: 1.66% Year-to-date Change: 11.1% | |
| CL Links: Profile News Message Board | |
| Charts:- Daily , Weekly | |
| Add CL to Watchlist: View: Get Complete CL Trend Analysis ➞ | |
 | AIG American International Group, Inc. |
| Sector: Financials | |
| SubSector: Property & Casualty Insurance | |
| MarketCap: 21219 Millions | |
| Recent Price: 74.93 Smart Investing & Trading Score: 70 | |
| Day Percent Change: -0.04% Day Change: -0.03 | |
| Week Change: 0.94% Year-to-date Change: 10.6% | |
| AIG Links: Profile News Message Board | |
| Charts:- Daily , Weekly | |
| Add AIG to Watchlist: View: Get Complete AIG Trend Analysis ➞ | |
 | BK The Bank of New York Mellon Corporation |
| Sector: Financials | |
| SubSector: Asset Management | |
| MarketCap: 29807.5 Millions | |
| Recent Price: 57.44 Smart Investing & Trading Score: 95 | |
| Day Percent Change: 0.49% Day Change: 0.28 | |
| Week Change: 2.04% Year-to-date Change: 10.4% | |
| BK Links: Profile News Message Board | |
| Charts:- Daily , Weekly | |
| Add BK to Watchlist: View: Get Complete BK Trend Analysis ➞ | |
 | PG The Procter & Gamble Company |
| Sector: Consumer Staples | |
| SubSector: Personal Products | |
| MarketCap: 277162 Millions | |
| Recent Price: 161.50 Smart Investing & Trading Score: 100 | |
| Day Percent Change: 0.60% Day Change: 0.96 | |
| Week Change: 2.12% Year-to-date Change: 10.2% | |
| PG Links: Profile News Message Board | |
| Charts:- Daily , Weekly | |
| Add PG to Watchlist: View: Get Complete PG Trend Analysis ➞ | |
 | GS The Goldman Sachs Group, Inc. |
| Sector: Financials | |
| SubSector: Investment Brokerage - National | |
| MarketCap: 54579.3 Millions | |
| Recent Price: 424.00 Smart Investing & Trading Score: 100 | |
| Day Percent Change: 1.59% Day Change: 6.65 | |
| Week Change: 4.95% Year-to-date Change: 9.9% | |
| GS Links: Profile News Message Board | |
| Charts:- Daily , Weekly | |
| Add GS to Watchlist: View: Get Complete GS Trend Analysis ➞ | |
 | COST Costco Wholesale Corporation |
| Sector: Services & Goods | |
| SubSector: Discount, Variety Stores | |
| MarketCap: 136355 Millions | |
| Recent Price: 722.68 Smart Investing & Trading Score: 80 | |
| Day Percent Change: 1.01% Day Change: 7.22 | |
| Week Change: 1.86% Year-to-date Change: 9.5% | |
| COST Links: Profile News Message Board | |
| Charts:- Daily , Weekly | |
| Add COST to Watchlist: View: Get Complete COST Trend Analysis ➞ | |
 | DHR Danaher Corporation |
| Sector: Industrials | |
| SubSector: Diversified Machinery | |
| MarketCap: 93210.3 Millions | |
| Recent Price: 253.11 Smart Investing & Trading Score: 100 | |
| Day Percent Change: 7.21% Day Change: 17.03 | |
| Week Change: 7.47% Year-to-date Change: 9.4% | |
| DHR Links: Profile News Message Board | |
| Charts:- Daily , Weekly | |
| Add DHR to Watchlist: View: Get Complete DHR Trend Analysis ➞ | |
 | ABBV AbbVie Inc. |
| Sector: Health Care | |
| SubSector: Drug Manufacturers - Major | |
| MarketCap: 110080 Millions | |
| Recent Price: 169.54 Smart Investing & Trading Score: 73 | |
| Day Percent Change: 0.98% Day Change: 1.65 | |
| Week Change: 1.88% Year-to-date Change: 9.4% | |
| ABBV Links: Profile News Message Board | |
| Charts:- Daily , Weekly | |
| Add ABBV to Watchlist: View: Get Complete ABBV Trend Analysis ➞ | |
 | SCHW The Charles Schwab Corporation |
| Sector: Financials | |
| SubSector: Investment Brokerage - National | |
| MarketCap: 45115.8 Millions | |
| Recent Price: 75.23 Smart Investing & Trading Score: 100 | |
| Day Percent Change: 1.31% Day Change: 0.97 | |
| Week Change: 2.47% Year-to-date Change: 9.4% | |
| SCHW Links: Profile News Message Board | |
| Charts:- Daily , Weekly | |
| Add SCHW to Watchlist: View: Get Complete SCHW Trend Analysis ➞ | |
 | MET MetLife, Inc. |
| Sector: Financials | |
| SubSector: Life Insurance | |
| MarketCap: 26272.9 Millions | |
| Recent Price: 72.22 Smart Investing & Trading Score: 75 | |
| Day Percent Change: 0.36% Day Change: 0.26 | |
| Week Change: 1.56% Year-to-date Change: 9.2% | |
| MET Links: Profile News Message Board | |
| Charts:- Daily , Weekly | |
| Add MET to Watchlist: View: Get Complete MET Trend Analysis ➞ | |
 | CVX Chevron Corporation |
| Sector: Energy | |
| SubSector: Major Integrated Oil & Gas | |
| MarketCap: 121521 Millions | |
| Recent Price: 162.85 Smart Investing & Trading Score: 100 | |
| Day Percent Change: 0.57% Day Change: 0.93 | |
| Week Change: 1.78% Year-to-date Change: 9.2% | |
| CVX Links: Profile News Message Board | |
| Charts:- Daily , Weekly | |
| Add CVX to Watchlist: View: Get Complete CVX Trend Analysis ➞ | |
 | ORCL Oracle Corporation |
| Sector: Technology | |
| SubSector: Application Software | |
| MarketCap: 164530 Millions | |
| Recent Price: 115.09 Smart Investing & Trading Score: 36 | |
| Day Percent Change: 0.49% Day Change: 0.56 | |
| Week Change: 0.18% Year-to-date Change: 9.2% | |
| ORCL Links: Profile News Message Board | |
| Charts:- Daily , Weekly | |
| Add ORCL to Watchlist: View: Get Complete ORCL Trend Analysis ➞ | |
 | NEE NextEra Energy, Inc. |
| Sector: Utilities | |
| SubSector: Electric Utilities | |
| MarketCap: 108288 Millions | |
| Recent Price: 66.20 Smart Investing & Trading Score: 100 | |
| Day Percent Change: 1.36% Day Change: 0.89 | |
| Week Change: 2.95% Year-to-date Change: 9.0% | |
| NEE Links: Profile News Message Board | |
| Charts:- Daily , Weekly | |
| Add NEE to Watchlist: View: Get Complete NEE Trend Analysis ➞ | |
 | MA Mastercard Incorporated |
| Sector: Financials | |
| SubSector: Credit Services | |
| MarketCap: 234809 Millions | |
| Recent Price: 462.82 Smart Investing & Trading Score: 58 | |
| Day Percent Change: 1.33% Day Change: 6.07 | |
| Week Change: 1.63% Year-to-date Change: 8.5% | |
| MA Links: Profile News Message Board | |
| Charts:- Daily , Weekly | |
| Add MA to Watchlist: View: Get Complete MA Trend Analysis ➞ | |
 | MSFT Microsoft Corporation |
| Sector: Technology | |
| SubSector: Business Software & Services | |
| MarketCap: 1154150 Millions | |
| Recent Price: 407.57 Smart Investing & Trading Score: 58 | |
| Day Percent Change: 1.65% Day Change: 6.61 | |
| Week Change: 2.12% Year-to-date Change: 8.4% | |
| MSFT Links: Profile News Message Board | |
| Charts:- Daily , Weekly | |
| Add MSFT to Watchlist: View: Get Complete MSFT Trend Analysis ➞ | |
 | LIN Linde plc |
| Sector: Materials | |
| SubSector: Specialty Chemicals | |
| MarketCap: 88539.2 Millions | |
| Recent Price: 445.06 Smart Investing & Trading Score: 44 | |
| Day Percent Change: -0.43% Day Change: -1.91 | |
| Week Change: -0.28% Year-to-date Change: 8.4% | |
| LIN Links: Profile News Message Board | |
| Charts:- Daily , Weekly | |
| Add LIN to Watchlist: View: Get Complete LIN Trend Analysis ➞ | |
 | TMO Thermo Fisher Scientific Inc. |
| Sector: Health Care | |
| SubSector: Medical Laboratories & Research | |
| MarketCap: 112999 Millions | |
| Recent Price: 574.59 Smart Investing & Trading Score: 85 | |
| Day Percent Change: 4.78% Day Change: 26.21 | |
| Week Change: 5.47% Year-to-date Change: 8.3% | |
| TMO Links: Profile News Message Board | |
| Charts:- Daily , Weekly | |
| Add TMO to Watchlist: View: Get Complete TMO Trend Analysis ➞ | |
 | FDX FedEx Corporation |
| Sector: Transports | |
| SubSector: Air Delivery & Freight Services | |
| MarketCap: 33188 Millions | |
| Recent Price: 271.75 Smart Investing & Trading Score: 78 | |
| Day Percent Change: 0.59% Day Change: 1.60 | |
| Week Change: 1.78% Year-to-date Change: 7.4% | |
| FDX Links: Profile News Message Board | |
| Charts:- Daily , Weekly | |
| Add FDX to Watchlist: View: Get Complete FDX Trend Analysis ➞ | |
 | OEF iShares S&P 100 |
| Sector: Utilities | |
| SubSector: Exchange Traded Fund | |
| MarketCap: 0 Millions | |
| Recent Price: 239.95 Smart Investing & Trading Score: 58 | |
| Day Percent Change: 1.33% Day Change: 3.14 | |
| Week Change: 2.25% Year-to-date Change: 7.4% | |
| OEF Links: Profile News Message Board | |
| Charts:- Daily , Weekly | |
| Add OEF to Watchlist: View: Get Complete OEF Trend Analysis ➞ | |
 | SPY SPDR S&P 500 ETF |
| Sector: Utilities | |
| SubSector: Exchange Traded Fund | |
| MarketCap: 0 Millions | |
| Recent Price: 505.65 Smart Investing & Trading Score: 58 | |
| Day Percent Change: 1.19% Day Change: 5.93 | |
| Week Change: 2.12% Year-to-date Change: 6.4% | |
| SPY Links: Profile News Message Board | |
| Charts:- Daily , Weekly | |
| Add SPY to Watchlist: View: Get Complete SPY Trend Analysis ➞ | |
 | MO Altria Group, Inc. |
| Sector: Consumer Staples | |
| SubSector: Cigarettes | |
| MarketCap: 70806.3 Millions | |
| Recent Price: 42.87 Smart Investing & Trading Score: 100 | |
| Day Percent Change: 0.70% Day Change: 0.30 | |
| Week Change: 1.85% Year-to-date Change: 6.3% | |
| MO Links: Profile News Message Board | |
| Charts:- Daily , Weekly | |
| Add MO to Watchlist: View: Get Complete MO Trend Analysis ➞ | |
 | F Ford Motor Company |
| Sector: Consumer Staples | |
| SubSector: Auto Manufacturers - Major | |
| MarketCap: 19052.1 Millions | |
| Recent Price: 12.94 Smart Investing & Trading Score: 80 | |
| Day Percent Change: 0.47% Day Change: 0.06 | |
| Week Change: 6.59% Year-to-date Change: 6.2% | |
| F Links: Profile News Message Board | |
| Charts:- Daily , Weekly | |
| Add F to Watchlist: View: Get Complete F Trend Analysis ➞ | |
 | VZ Verizon Communications Inc. |
| Sector: Technology | |
| SubSector: Telecom Services - Domestic | |
| MarketCap: 229427 Millions | |
| Recent Price: 39.70 Smart Investing & Trading Score: 15 | |
| Day Percent Change: 2.85% Day Change: 1.10 | |
| Week Change: -1.95% Year-to-date Change: 5.3% | |
| VZ Links: Profile News Message Board | |
| Charts:- Daily , Weekly | |
| Add VZ to Watchlist: View: Get Complete VZ Trend Analysis ➞ | |
| For tabular summary view of above stock list: Summary View ➞ 0 - 25 , 25 - 50 , 50 - 75 , 75 - 100 , 100 - 125 | ||
| Click To Change The Sort Order: By Market Cap or Company Size Performance: Year-to-date, Week and Day | |
| Select Chart Type: | ||
|
Best Stocks Today 12Stocks.com |
� 2024 12Stocks.com Terms & Conditions Privacy Contact Us
All Information Provided Only For Education And Not To Be Used For Investing or Trading. See Terms & Conditions


One More Thing ... Get Best Stocks Delivered Daily!
Never Ever Miss A Move With Our Top Ten Stocks Lists
Find Best Stocks In Any Market - Bull or Bear Market
Take A Peek At Our Top Ten Stocks Lists: Daily, Weekly, Year-to-Date & Top Trends
Find Best Stocks In Any Market - Bull or Bear Market
Take A Peek At Our Top Ten Stocks Lists: Daily, Weekly, Year-to-Date & Top Trends
S&P 100 Stocks With Best Up Trends [0-bearish to 100-bullish]: Danaher [100], Philip Morris[100], Citi [100], American Express[100], Morgan Stanley[100], Bank of America[100], Goldman Sachs[100], NextEra Energy[100], Charles Schwab[100], Altria [100], Procter & Gamble[100]
Best S&P 100 Stocks Year-to-Date:
NVIDIA [66.44%], Meta Platforms[40.09%], Eli Lilly[27.92%], American Express[27.55%], General Electric[27.42%], Walt Disney[25.94%], General Motors[25.56%], Wells Fargo[23.81%], Caterpillar [22.86%], Citi [21.83%], Exxon Mobil[21.05%] Best S&P 100 Stocks This Week:
General Electric[9.83%], NVIDIA [8.17%], Danaher [7.47%], Ford Motor[6.59%], General Motors[6.44%], Citi [5.97%], Thermo Fisher[5.47%], Goldman Sachs[4.95%], United Parcel[4.27%], Philip Morris[4.15%], Netflix [4.09%] Best S&P 100 Stocks Daily:
General Electric[8.28%], Danaher [7.21%], Thermo Fisher[4.78%], General Motors[4.37%], Netflix [4.17%], Philip Morris[3.83%], NVIDIA [3.65%], Meta Platforms[2.95%], Verizon [2.85%], Citi [2.82%], American Express[2.56%]