
 Login Sign Up


| |||||
 |  | ||||

| 12Stocks.com Market Intelligence |
Best S&P 100 Stocks
| In a hurry? S&P 100 Stocks Lists: Performance Trends Table, Stock Charts
Sort S&P 100 stocks: Daily, Weekly, Year-to-Date, Market Cap & Trends. |
| 12Stocks.com S&P 100 Stocks Performances & Trends Daily | |||||||||
|
|  The overall Smart Investing & Trading Score is 26 (0-bearish to 100-bullish) which puts S&P 100 index in short term bearish to neutral trend. The Smart Investing & Trading Score from previous trading session is 31 and a deterioration of trend continues.
| ||||||||
Here are the Smart Investing & Trading Scores of the most requested S&P 100 stocks at 12Stocks.com (click stock name for detailed review):
|


| 12Stocks.com: Top Performing S&P 100 Index Stocks | ||||||||||||||||||||||||||||||||||||||||||||||||
 The top performing S&P 100 Index stocks year to date are
Now, more recently, over last week, the top performing S&P 100 Index stocks on the move are


|
||||||||||||||||||||||||||||||||||||||||||||||||
| 12Stocks.com: Investing in S&P 100 Index with Stocks | |
|
The following table helps investors and traders sort through current performance and trends (as measured by Smart Investing & Trading Score) of various
stocks in the S&P 100 Index. Quick View: Move mouse or cursor over stock symbol (ticker) to view short-term technical chart and over stock name to view long term chart. Click on  to add stock symbol to your watchlist and to add stock symbol to your watchlist and  to view watchlist. Click on any ticker or stock name for detailed market intelligence report for that stock. to view watchlist. Click on any ticker or stock name for detailed market intelligence report for that stock. |
12Stocks.com Performance of Stocks in S&P 100 Index
| Ticker | Stock Name | Watchlist | Category | Recent Price | Smart Investing & Trading Score | Change % | YTD Change% |
| NVDA | NVIDIA |   | Technology | 847.15 | 41 | 0.81% | 71.07% |
| META | Meta Platforms | | Technology | 501.84 | 78 | 1.55% | 41.76% |
| LLY | Eli Lilly | | Health Care | 745.95 | 44 | -0.64% | 27.97% |
| NFLX | Netflix | | Technology | 610.62 | 41 | -0.50% | 25.41% |
| DIS | Walt Disney | | Services & Goods | 112.43 | 54 | -0.45% | 24.52% |
| CAT | Caterpillar | | Industrials | 357.93 | 43 | -0.11% | 21.06% |
| GE | General Electric | | Industrials | 152.94 | 51 | -1.75% | 19.83% |
| WFC | Wells Fargo | | Financials | 58.74 | 90 | 2.73% | 19.34% |
| XOM | Exxon Mobil | | Energy | 118.52 | 58 | -0.09% | 18.54% |
| GM | General Motors | | Consumer Staples | 42.44 | 46 | -0.05% | 18.15% |
| AMZN | Amazon.com | | Services & Goods | 179.22 | 39 | -1.14% | 17.95% |
| TGT | Target | | Services & Goods | 166.58 | 68 | 1.28% | 16.96% |
| AXP | American Express | | Financials | 217.50 | 56 | -0.08% | 16.10% |
| MRK | Merck | | Health Care | 125.23 | 41 | -0.11% | 14.87% |
| C | Citi | | Financials | 58.32 | 56 | 0.26% | 13.37% |
| AVGO | Broadcom | | Technology | 1259.04 | 26 | -1.84% | 12.79% |
| WMT | Walmart | | Services & Goods | 59.26 | 26 | -0.65% | 12.77% |
| EMR | Emerson Electric | | Industrials | 109.31 | 36 | -0.46% | 12.31% |
| GOOG | | Technology | 157.49 | 90 | 0.39% | 11.75% | |
| GOOGL | | Technology | 155.97 | 90 | 0.32% | 11.65% | |
| QCOM | QUALCOMM | | Technology | 161.45 | 31 | -1.75% | 11.63% |
| IBM | Business | | Technology | 181.47 | 18 | -0.89% | 10.96% |
| COP | ConocoPhillips | | Energy | 127.81 | 44 | -0.41% | 10.11% |
| ORCL | Oracle | | Technology | 116.00 | 26 | -2.25% | 10.03% |
| GD | General Dynamics | | Industrials | 285.27 | 76 | 0.28% | 9.86% |
| For chart view version of above stock list: Chart View ➞ 0 - 25 , 25 - 50 , 50 - 75 , 75 - 100 , 100 - 125 | ||
 | Click To Change The Sort Order: By Market Cap or Company Size Performance: Year-to-date, Week and Day |  |
|
Get the most comprehensive stock market coverage daily at 12Stocks.com ➞ Best Stocks Today ➞ Best Stocks Weekly ➞ Best Stocks Year-to-Date ➞ Best Stocks Trends ➞  Best Stocks Today 12Stocks.com Best Nasdaq Stocks ➞ Best S&P 500 Stocks ➞ Best Tech Stocks ➞ Best Biotech Stocks ➞ |
| Detailed Overview of S&P 100 Stocks |
| S&P 100 Technical Overview, Leaders & Laggards, Top S&P 100 ETF Funds & Detailed S&P 100 Stocks List, Charts, Trends & More |
| S&P 100: Technical Analysis, Trends & YTD Performance | |
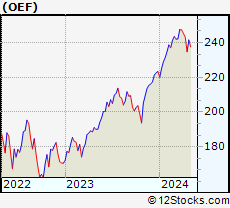
| S&P 100 index as represented by
OEF, an exchange-traded fund [ETF], holds basket of one hundred US (mostly largecap) stocks from across all major sectors of the US stock market. The S&P 100 index (contains stocks like Apple and Exxon) is up by 6.37% and is currently outperforming the overall market by 2.18% year-to-date. Below is a quick view of technical charts and trends: | |
 OEF Weekly Chart |
|
| Long Term Trend: Good | |
| Medium Term Trend: Not Good | |
 OEF Daily Chart |
|
| Short Term Trend: Not Good | |
| Overall Trend Score: 26 | |
| YTD Performance: 6.37% | |
| **Trend Scores & Views Are Only For Educational Purposes And Not For Investing | |
| 12Stocks.com: Investing in S&P 100 Index using Exchange Traded Funds | |
|
The following table shows list of key exchange traded funds (ETF) that
help investors track S&P 100 index. We have also included ETF funds that track S&P 500 index since it is market-cap weighted. The following list also includes leveraged ETF funds that track twice or thrice the daily returns of S&P 100 indices. Short or inverse ETF funds move in the opposite direction to the index they track and are useful during market pullbacks or during bear markets. Quick View: Move mouse or cursor over ETF symbol (ticker) to view short-term technical chart and over ETF name to view long term chart. Click on ticker or stock name for detailed view. Click on to add stock symbol to your watchlist and to view watchlist. |
12Stocks.com List of ETFs that track S&P 100 Index
| Ticker | ETF Name | Watchlist | Recent Price | Smart Investing & Trading Score | Change % | Week % | Year-to-date % |
| SPY | SPDR S&P 500 ETF | | 499.52 | 36 | -0.21 | -2.22 | 5.09% |
| SPXS | Direxion Daily S&P 500 Bear 3X ETF | | 10.11 | 59 | 1.00 | 7.32 | -12.47% |
| SH | ProShares Short S&P500 | | 12.47 | 74 | 0.24 | 2.3 | -4% |
| SDS | ProShares UltraShort S&P500 | | 27.41 | 74 | 0.51 | 4.74 | -8.39% |
| UPRO | ProShares UltraPro S&P500 | | 60.78 | 36 | -0.78 | -6.78 | 11.03% |
| SPXU | ProShares UltraPro Short S&P500 | | 37.33 | 69 | 0.70 | 7.09 | -13.19% |
| VOO | Vanguard 500 ETF | | 458.94 | 44 | -0.23 | -2.26 | 5.07% |
| SPXL | Direxion Daily S&P500 Bull 3X ETF | | 115.53 | 36 | -0.70 | -6.71 | 11.1% |
| SSO | ProShares Ultra S&P500 | | 70.33 | 36 | -0.47 | -4.52 | 8.08% |
| OEF | iShares S&P 100 | | 237.62 | 26 | -0.13 | -2.27 | 6.37% |
| 12Stocks.com: Charts, Trends, Fundamental Data and Performances of S&P 100 Stocks | |
|
We now take in-depth look at all S&P 100 stocks including charts, multi-period performances and overall trends (as measured by Smart Investing & Trading Score). One can sort S&P 100 stocks (click link to choose) by Daily, Weekly and by Year-to-Date performances. Also, one can sort by size of the company or by market capitalization. |
| Select Your Default Chart Type: | |||||
| |||||
| Click on stock symbol or name for detailed view. Click on to add stock symbol to your watchlist and to view watchlist. Quick View: Move mouse or cursor over "Daily" to quickly view daily technical stock chart and over "Weekly" to view weekly technical stock chart. | |||||

 | NVDA NVIDIA Corporation |
| Sector: Technology | |
| SubSector: Semiconductor - Specialized | |
| MarketCap: 143476 Millions | |
| Recent Price: 847.15 Smart Investing & Trading Score: 41 | |
| Day Percent Change: 0.81% Day Change: 6.80 | |
| Week Change: -3.94% Year-to-date Change: 71.1% | |
| NVDA Links: Profile News Message Board | |
| Charts:- Daily , Weekly | |
| Add NVDA to Watchlist: View: Get Complete NVDA Trend Analysis ➞ | |
 | META Meta Platforms, Inc. |
| Sector: Technology | |
| SubSector: Internet Content & Information | |
| MarketCap: 732990 Millions | |
| Recent Price: 501.84 Smart Investing & Trading Score: 78 | |
| Day Percent Change: 1.55% Day Change: 7.66 | |
| Week Change: -1.97% Year-to-date Change: 41.8% | |
| META Links: Profile News Message Board | |
| Charts:- Daily , Weekly | |
| Add META to Watchlist: View: Get Complete META Trend Analysis ➞ | |
 | LLY Eli Lilly and Company |
| Sector: Health Care | |
| SubSector: Drug Manufacturers - Major | |
| MarketCap: 130066 Millions | |
| Recent Price: 745.95 Smart Investing & Trading Score: 44 | |
| Day Percent Change: -0.64% Day Change: -4.82 | |
| Week Change: -0.76% Year-to-date Change: 28.0% | |
| LLY Links: Profile News Message Board | |
| Charts:- Daily , Weekly | |
| Add LLY to Watchlist: View: Get Complete LLY Trend Analysis ➞ | |
 | NFLX Netflix, Inc. |
| Sector: Technology | |
| SubSector: CATV Systems | |
| MarketCap: 162108 Millions | |
| Recent Price: 610.62 Smart Investing & Trading Score: 41 | |
| Day Percent Change: -0.50% Day Change: -3.08 | |
| Week Change: -1.96% Year-to-date Change: 25.4% | |
| NFLX Links: Profile News Message Board | |
| Charts:- Daily , Weekly | |
| Add NFLX to Watchlist: View: Get Complete NFLX Trend Analysis ➞ | |
 | DIS The Walt Disney Company |
| Sector: Services & Goods | |
| SubSector: Entertainment - Diversified | |
| MarketCap: 178396 Millions | |
| Recent Price: 112.43 Smart Investing & Trading Score: 54 | |
| Day Percent Change: -0.45% Day Change: -0.51 | |
| Week Change: -1.39% Year-to-date Change: 24.5% | |
| DIS Links: Profile News Message Board | |
| Charts:- Daily , Weekly | |
| Add DIS to Watchlist: View: Get Complete DIS Trend Analysis ➞ | |
 | CAT Caterpillar Inc. |
| Sector: Industrials | |
| SubSector: Farm & Construction Machinery | |
| MarketCap: 58636 Millions | |
| Recent Price: 357.93 Smart Investing & Trading Score: 43 | |
| Day Percent Change: -0.11% Day Change: -0.39 | |
| Week Change: -2.11% Year-to-date Change: 21.1% | |
| CAT Links: Profile News Message Board | |
| Charts:- Daily , Weekly | |
| Add CAT to Watchlist: View: Get Complete CAT Trend Analysis ➞ | |
 | GE General Electric Company |
| Sector: Industrials | |
| SubSector: Diversified Machinery | |
| MarketCap: 64710.6 Millions | |
| Recent Price: 152.94 Smart Investing & Trading Score: 51 | |
| Day Percent Change: -1.75% Day Change: -2.73 | |
| Week Change: -1.09% Year-to-date Change: 19.8% | |
| GE Links: Profile News Message Board | |
| Charts:- Daily , Weekly | |
| Add GE to Watchlist: View: Get Complete GE Trend Analysis ➞ | |
 | WFC Wells Fargo & Company |
| Sector: Financials | |
| SubSector: Money Center Banks | |
| MarketCap: 129138 Millions | |
| Recent Price: 58.74 Smart Investing & Trading Score: 90 | |
| Day Percent Change: 2.73% Day Change: 1.56 | |
| Week Change: 4.02% Year-to-date Change: 19.3% | |
| WFC Links: Profile News Message Board | |
| Charts:- Daily , Weekly | |
| Add WFC to Watchlist: View: Get Complete WFC Trend Analysis ➞ | |
 | XOM Exxon Mobil Corporation |
| Sector: Energy | |
| SubSector: Major Integrated Oil & Gas | |
| MarketCap: 156450 Millions | |
| Recent Price: 118.52 Smart Investing & Trading Score: 58 | |
| Day Percent Change: -0.09% Day Change: -0.11 | |
| Week Change: -1.54% Year-to-date Change: 18.5% | |
| XOM Links: Profile News Message Board | |
| Charts:- Daily , Weekly | |
| Add XOM to Watchlist: View: Get Complete XOM Trend Analysis ➞ | |
 | GM General Motors Company |
| Sector: Consumer Staples | |
| SubSector: Auto Manufacturers - Major | |
| MarketCap: 29252.4 Millions | |
| Recent Price: 42.44 Smart Investing & Trading Score: 46 | |
| Day Percent Change: -0.05% Day Change: -0.02 | |
| Week Change: -1.49% Year-to-date Change: 18.2% | |
| GM Links: Profile News Message Board | |
| Charts:- Daily , Weekly | |
| Add GM to Watchlist: View: Get Complete GM Trend Analysis ➞ | |
 | AMZN Amazon.com, Inc. |
| Sector: Services & Goods | |
| SubSector: Catalog & Mail Order Houses | |
| MarketCap: 998070 Millions | |
| Recent Price: 179.22 Smart Investing & Trading Score: 39 | |
| Day Percent Change: -1.14% Day Change: -2.06 | |
| Week Change: -3.71% Year-to-date Change: 18.0% | |
| AMZN Links: Profile News Message Board | |
| Charts:- Daily , Weekly | |
| Add AMZN to Watchlist: View: Get Complete AMZN Trend Analysis ➞ | |
 | TGT Target Corporation |
| Sector: Services & Goods | |
| SubSector: Discount, Variety Stores | |
| MarketCap: 55980.6 Millions | |
| Recent Price: 166.58 Smart Investing & Trading Score: 68 | |
| Day Percent Change: 1.28% Day Change: 2.11 | |
| Week Change: 0.28% Year-to-date Change: 17.0% | |
| TGT Links: Profile News Message Board | |
| Charts:- Daily , Weekly | |
| Add TGT to Watchlist: View: Get Complete TGT Trend Analysis ➞ | |
 | AXP American Express Company |
| Sector: Financials | |
| SubSector: Credit Services | |
| MarketCap: 68388 Millions | |
| Recent Price: 217.50 Smart Investing & Trading Score: 56 | |
| Day Percent Change: -0.08% Day Change: -0.17 | |
| Week Change: -0.32% Year-to-date Change: 16.1% | |
| AXP Links: Profile News Message Board | |
| Charts:- Daily , Weekly | |
| Add AXP to Watchlist: View: Get Complete AXP Trend Analysis ➞ | |
 | MRK Merck & Co., Inc. |
| Sector: Health Care | |
| SubSector: Drug Manufacturers - Major | |
| MarketCap: 192657 Millions | |
| Recent Price: 125.23 Smart Investing & Trading Score: 41 | |
| Day Percent Change: -0.11% Day Change: -0.14 | |
| Week Change: -0.41% Year-to-date Change: 14.9% | |
| MRK Links: Profile News Message Board | |
| Charts:- Daily , Weekly | |
| Add MRK to Watchlist: View: Get Complete MRK Trend Analysis ➞ | |
 | C Citigroup Inc. |
| Sector: Financials | |
| SubSector: Money Center Banks | |
| MarketCap: 94128 Millions | |
| Recent Price: 58.32 Smart Investing & Trading Score: 56 | |
| Day Percent Change: 0.26% Day Change: 0.15 | |
| Week Change: -2.28% Year-to-date Change: 13.4% | |
| C Links: Profile News Message Board | |
| Charts:- Daily , Weekly | |
| Add C to Watchlist: View: Get Complete C Trend Analysis ➞ | |
 | AVGO Broadcom Inc. |
| Sector: Technology | |
| SubSector: Semiconductor - Broad Line | |
| MarketCap: 86329.1 Millions | |
| Recent Price: 1259.04 Smart Investing & Trading Score: 26 | |
| Day Percent Change: -1.84% Day Change: -23.59 | |
| Week Change: -6.33% Year-to-date Change: 12.8% | |
| AVGO Links: Profile News Message Board | |
| Charts:- Daily , Weekly | |
| Add AVGO to Watchlist: View: Get Complete AVGO Trend Analysis ➞ | |
 | WMT Walmart Inc. |
| Sector: Services & Goods | |
| SubSector: Discount, Variety Stores | |
| MarketCap: 355610 Millions | |
| Recent Price: 59.26 Smart Investing & Trading Score: 26 | |
| Day Percent Change: -0.65% Day Change: -0.39 | |
| Week Change: -1.46% Year-to-date Change: 12.8% | |
| WMT Links: Profile News Message Board | |
| Charts:- Daily , Weekly | |
| Add WMT to Watchlist: View: Get Complete WMT Trend Analysis ➞ | |
 | EMR Emerson Electric Co. |
| Sector: Industrials | |
| SubSector: Industrial Electrical Equipment | |
| MarketCap: 30457.9 Millions | |
| Recent Price: 109.31 Smart Investing & Trading Score: 36 | |
| Day Percent Change: -0.46% Day Change: -0.50 | |
| Week Change: -2.96% Year-to-date Change: 12.3% | |
| EMR Links: Profile News Message Board | |
| Charts:- Daily , Weekly | |
| Add EMR to Watchlist: View: Get Complete EMR Trend Analysis ➞ | |
 | GOOG Alphabet Inc. |
| Sector: Technology | |
| SubSector: Internet Information Providers | |
| MarketCap: 730159 Millions | |
| Recent Price: 157.49 Smart Investing & Trading Score: 90 | |
| Day Percent Change: 0.39% Day Change: 0.61 | |
| Week Change: -1.07% Year-to-date Change: 11.8% | |
| GOOG Links: Profile News Message Board | |
| Charts:- Daily , Weekly | |
| Add GOOG to Watchlist: View: Get Complete GOOG Trend Analysis ➞ | |
 | GOOGL Alphabet Inc. |
| Sector: Technology | |
| SubSector: Internet Information Providers | |
| MarketCap: 801264 Millions | |
| Recent Price: 155.97 Smart Investing & Trading Score: 90 | |
| Day Percent Change: 0.32% Day Change: 0.50 | |
| Week Change: -1.12% Year-to-date Change: 11.7% | |
| GOOGL Links: Profile News Message Board | |
| Charts:- Daily , Weekly | |
| Add GOOGL to Watchlist: View: Get Complete GOOGL Trend Analysis ➞ | |
 | QCOM QUALCOMM Incorporated |
| Sector: Technology | |
| SubSector: Communication Equipment | |
| MarketCap: 77517.7 Millions | |
| Recent Price: 161.45 Smart Investing & Trading Score: 31 | |
| Day Percent Change: -1.75% Day Change: -2.87 | |
| Week Change: -5.74% Year-to-date Change: 11.6% | |
| QCOM Links: Profile News Message Board | |
| Charts:- Daily , Weekly | |
| Add QCOM to Watchlist: View: Get Complete QCOM Trend Analysis ➞ | |
 | IBM International Business Machines Corporation |
| Sector: Technology | |
| SubSector: Information Technology Services | |
| MarketCap: 97241.6 Millions | |
| Recent Price: 181.47 Smart Investing & Trading Score: 18 | |
| Day Percent Change: -0.89% Day Change: -1.63 | |
| Week Change: -0.44% Year-to-date Change: 11.0% | |
| IBM Links: Profile News Message Board | |
| Charts:- Daily , Weekly | |
| Add IBM to Watchlist: View: Get Complete IBM Trend Analysis ➞ | |
 | COP ConocoPhillips |
| Sector: Energy | |
| SubSector: Independent Oil & Gas | |
| MarketCap: 33504.3 Millions | |
| Recent Price: 127.81 Smart Investing & Trading Score: 44 | |
| Day Percent Change: -0.41% Day Change: -0.52 | |
| Week Change: -2.58% Year-to-date Change: 10.1% | |
| COP Links: Profile News Message Board | |
| Charts:- Daily , Weekly | |
| Add COP to Watchlist: View: Get Complete COP Trend Analysis ➞ | |
 | ORCL Oracle Corporation |
| Sector: Technology | |
| SubSector: Application Software | |
| MarketCap: 164530 Millions | |
| Recent Price: 116.00 Smart Investing & Trading Score: 26 | |
| Day Percent Change: -2.25% Day Change: -2.67 | |
| Week Change: -4.22% Year-to-date Change: 10.0% | |
| ORCL Links: Profile News Message Board | |
| Charts:- Daily , Weekly | |
| Add ORCL to Watchlist: View: Get Complete ORCL Trend Analysis ➞ | |
 | GD General Dynamics Corporation |
| Sector: Industrials | |
| SubSector: Aerospace/Defense Products & Services | |
| MarketCap: 37063.8 Millions | |
| Recent Price: 285.27 Smart Investing & Trading Score: 76 | |
| Day Percent Change: 0.28% Day Change: 0.81 | |
| Week Change: -0.9% Year-to-date Change: 9.9% | |
| GD Links: Profile News Message Board | |
| Charts:- Daily , Weekly | |
| Add GD to Watchlist: View: Get Complete GD Trend Analysis ➞ | |
| For tabular summary view of above stock list: Summary View ➞ 0 - 25 , 25 - 50 , 50 - 75 , 75 - 100 , 100 - 125 | ||
| Click To Change The Sort Order: By Market Cap or Company Size Performance: Year-to-date, Week and Day | |
| Select Chart Type: | ||
|
Best Stocks Today 12Stocks.com |
� 2024 12Stocks.com Terms & Conditions Privacy Contact Us
All Information Provided Only For Education And Not To Be Used For Investing or Trading. See Terms & Conditions


One More Thing ... Get Best Stocks Delivered Daily!
Never Ever Miss A Move With Our Top Ten Stocks Lists
Find Best Stocks In Any Market - Bull or Bear Market
Take A Peek At Our Top Ten Stocks Lists: Daily, Weekly, Year-to-Date & Top Trends
Find Best Stocks In Any Market - Bull or Bear Market
Take A Peek At Our Top Ten Stocks Lists: Daily, Weekly, Year-to-Date & Top Trends
S&P 100 Stocks With Best Up Trends [0-bearish to 100-bullish]: Charles Schwab[93], Wells Fargo[90], Google [90], Google [90], PepsiCo [85], Lockheed Martin[85], NextEra Energy[81], Meta Platforms[78], Southern [78], General Dynamics[76], NIKE [74]
Best S&P 100 Stocks Year-to-Date:
NVIDIA [71.07%], Meta Platforms[41.76%], Eli Lilly[27.97%], Netflix [25.41%], Walt Disney[24.52%], Caterpillar [21.06%], General Electric[19.83%], Wells Fargo[19.34%], Exxon Mobil[18.54%], General Motors[18.15%], Amazon.com [17.95%] Best S&P 100 Stocks This Week:
UnitedHealth [12.29%], Morgan Stanley[4.72%], Charles Schwab[4.14%], NIKE [4.07%], Wells Fargo[4.02%], Goldman Sachs[3.5%], Kraft Heinz[3.26%], Southern [2.68%], Philip Morris[2.64%], Starbucks [2.59%], PepsiCo [2.52%] Best S&P 100 Stocks Daily:
Capital One[3.55%], UnitedHealth [2.96%], Wells Fargo[2.73%], PepsiCo [1.68%], Comcast [1.63%], Meta Platforms[1.55%], Bank of America[1.53%], Duke Energy[1.51%], MetLife [1.49%], Bank of New York[1.45%], AT&T [1.30%]