
 Login Sign Up


| |||||
 |  | ||||

| 12Stocks.com Market Intelligence |
Best MidCap Stocks
|
| In a hurry? Mid Cap Stocks Lists: Performance Trends Table, Stock Charts
Sort midcap stocks: Daily, Weekly, Year-to-Date, Market Cap & Trends. Filter midcap stocks list by sector: Show all, Tech, Finance, Energy, Staples, Retail, Industrial, Materials, Utilities and HealthCare Filter midcap stocks list by size:All MidCap Large Mid-Range Small |
| 12Stocks.com Mid Cap Stocks Performances & Trends Daily | |||||||||
|
|  The overall Smart Investing & Trading Score is 63 (0-bearish to 100-bullish) which puts Mid Cap index in short term neutral to bullish trend. The Smart Investing & Trading Score from previous trading session is 44 and an improvement of trend continues.
| ||||||||
Here are the Smart Investing & Trading Scores of the most requested mid cap stocks at 12Stocks.com (click stock name for detailed review):
|


| 12Stocks.com: Top Performing Mid Cap Index Stocks | ||||||||||||||||||||||||||||||||||||||||||||||||
 The top performing Mid Cap Index stocks year to date are
Now, more recently, over last week, the top performing Mid Cap Index stocks on the move are


|
||||||||||||||||||||||||||||||||||||||||||||||||
| 12Stocks.com: Investing in Midcap Index with Stocks | |
|
The following table helps investors and traders sort through current performance and trends (as measured by Smart Investing & Trading Score) of various
stocks in the Midcap Index. Quick View: Move mouse or cursor over stock symbol (ticker) to view short-term technical chart and over stock name to view long term chart. Click on  to add stock symbol to your watchlist and to add stock symbol to your watchlist and  to view watchlist. Click on any ticker or stock name for detailed market intelligence report for that stock. to view watchlist. Click on any ticker or stock name for detailed market intelligence report for that stock. |
12Stocks.com Performance of Stocks in Midcap Index
| Ticker | Stock Name | Watchlist | Category | Recent Price | Smart Investing & Trading Score | Change % | YTD Change% |
| WST | West Pharmaceutical |   | Health Care | 390.20 | 85 | 3.96% | 10.81% |
| PODD | Insulet | | Health Care | 167.27 | 67 | 1.73% | -22.91% |
| HOLX | Hologic | | Health Care | 77.19 | 68 | 1.27% | 8.03% |
| DVA | DaVita | | Health Care | 133.91 | 83 | 1.05% | 27.83% |
| EXAS | Exact Sciences | | Health Care | 63.53 | 25 | 1.79% | -14.13% |
| MASI | Masimo | | Health Care | 136.95 | 68 | 1.96% | 16.84% |
| NBIX | Neurocrine Biosciences | | Health Care | 140.09 | 82 | 4.81% | 6.32% |
| ROIV | Roivant Sciences | | Health Care | 10.94 | 68 | 3.06% | -1.53% |
| ELAN | Elanco Animal | | Health Care | 13.46 | 17 | 4.10% | -9.66% |
| XRAY | DENTSPLY SIRONA | | Health Care | 30.86 | 25 | 1.61% | -13.29% |
| SRPT | Sarepta | | Health Care | 117.12 | 30 | 0.14% | 21.46% |
| AGL | agilon health | | Health Care | 5.34 | 67 | 3.49% | -57.79% |
| MOH | Molina | | Health Care | 363.22 | 44 | 0.37% | 0.53% |
| UHS | Universal Health | | Health Care | 164.91 | 58 | 2.35% | 8.18% |
| ICLR | ICON Public | | Health Care | 306.45 | 58 | 2.86% | 8.26% |
| TECH | Bio-Techne | | Health Care | 63.69 | 42 | 1.42% | -17.46% |
| IONS | Ionis | | Health Care | 41.84 | 49 | 1.87% | -17.30% |
| DOCS | Doximity | | Health Care | 24.58 | 17 | -0.85% | -13.54% |
| PRGO | Perrigo | | Health Care | 30.49 | 42 | 1.43% | -5.25% |
| CTLT | Catalent | | Health Care | 56.03 | 61 | -0.04% | 24.71% |
| CHE | Chemed | | Health Care | 616.51 | 58 | 2.00% | 5.43% |
| AMED | Amedisys | | Health Care | 91.16 | 40 | -0.09% | -4.10% |
| NVCR | NovoCure | | Health Care | 12.06 | 35 | 1.90% | -19.26% |
| BRKR | Bruker | | Health Care | 82.46 | 63 | 5.65% | 12.22% |
| CRL | Charles River | | Health Care | 240.13 | 63 | 3.26% | 1.58% |
| For chart view version of above stock list: Chart View ➞ 0 - 25 , 25 - 50 , 50 - 75 | ||
 | Click To Change The Sort Order: By Market Cap or Company Size Performance: Year-to-date, Week and Day |  |
|
Get the most comprehensive stock market coverage daily at 12Stocks.com ➞ Best Stocks Today ➞ Best Stocks Weekly ➞ Best Stocks Year-to-Date ➞ Best Stocks Trends ➞  Best Stocks Today 12Stocks.com Best Nasdaq Stocks ➞ Best S&P 500 Stocks ➞ Best Tech Stocks ➞ Best Biotech Stocks ➞ |
| Detailed Overview of Midcap Stocks |
| Midcap Technical Overview, Leaders & Laggards, Top Midcap ETF Funds & Detailed Midcap Stocks List, Charts, Trends & More |
| Midcap: Technical Analysis, Trends & YTD Performance | |
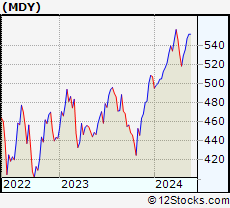
| MidCap segment as represented by
MDY, an exchange-traded fund [ETF], holds basket of about four hundred midcap stocks from across all major sectors of the US stock market. The midcap index (contains stocks like Green Mountain Coffee Roasters and Tractor Supply Company) is up by 4.42% and is currently underperforming the overall market by -1.22% year-to-date. Below is a quick view of technical charts and trends: | |
 MDY Weekly Chart |
|
| Long Term Trend: Very Good | |
| Medium Term Trend: Not Good | |
 MDY Daily Chart |
|
| Short Term Trend: Very Good | |
| Overall Trend Score: 63 | |
| YTD Performance: 4.42% | |
| **Trend Scores & Views Are Only For Educational Purposes And Not For Investing | |
| 12Stocks.com: Investing in Midcap Index using Exchange Traded Funds | |
|
The following table shows list of key exchange traded funds (ETF) that
help investors track Midcap index. The following list also includes leveraged ETF funds that track twice or thrice the daily returns of Midcap indices. Short or inverse ETF funds move in the opposite direction to the index they track and are useful during market pullbacks or during bear markets. Quick View: Move mouse or cursor over ETF symbol (ticker) to view short-term technical chart and over ETF name to view long term chart. Click on ticker or stock name for detailed view. Click on to add stock symbol to your watchlist and to view watchlist. |
12Stocks.com List of ETFs that track Midcap Index
| Ticker | ETF Name | Watchlist | Recent Price | Smart Investing & Trading Score | Change % | Week % | Year-to-date % |
| IJH | iShares Core S&P Mid-Cap | | 57.85 | 68 | 1.82 | 2.24 | 4.37% |
| IWS | iShares Russell Mid-Cap Value | | 119.86 | 68 | 0.89 | 1.88 | 3.07% |
| IWP | iShares Russell Mid-Cap Growth | | 108.63 | 58 | 1.80 | 2.77 | 3.99% |
| IWR | iShares Russell Mid-Cap | | 80.37 | 63 | 1.25 | 2.17 | 3.4% |
| MDY | SPDR S&P MidCap 400 ETF | | 529.80 | 63 | 1.20 | 2.22 | 4.42% |
| IJK | iShares S&P Mid-Cap 400 Growth | | 86.93 | 63 | 1.58 | 2.45 | 9.73% |
| IJJ | iShares S&P Mid-Cap 400 Value | | 112.47 | 63 | 0.83 | 1.74 | -1.38% |
| XMLV | PowerShares S&P MidCap Low Volatil ETF | | 54.91 | 75 | 0.68 | 1.38 | 3.25% |
| UMDD | ProShares UltraPro MidCap400 | | 24.11 | 63 | 4.06 | 6.86 | 8.02% |
| SMDD | ProShares UltraPro Short MidCap400 | | 11.65 | 32 | -3.79 | -7.26 | -13.46% |
| MVV | ProShares Ultra MidCap400 | | 61.54 | 63 | 2.07 | 4.31 | 6.31% |
| MZZ | ProShares UltraShort MidCap400 | | 11.66 | 27 | -2.51 | -4.2 | -7.24% |
| MYY | ProShares Short MidCap400 | | 20.74 | 32 | -1.09 | -2.12 | -3.33% |
| 12Stocks.com: Charts, Trends, Fundamental Data and Performances of MidCap Stocks | |
|
We now take in-depth look at all MidCap stocks including charts, multi-period performances and overall trends (as measured by Smart Investing & Trading Score). One can sort MidCap stocks (click link to choose) by Daily, Weekly and by Year-to-Date performances. Also, one can sort by size of the company or by market capitalization. |
| Select Your Default Chart Type: | |||||
| |||||
| Click on stock symbol or name for detailed view. Click on to add stock symbol to your watchlist and to view watchlist. Quick View: Move mouse or cursor over "Daily" to quickly view daily technical stock chart and over "Weekly" to view weekly technical stock chart. | |||||

 | WST West Pharmaceutical Services, Inc. |
| Sector: Health Care | |
| SubSector: Medical Instruments & Supplies | |
| MarketCap: 9989 Millions | |
| Recent Price: 390.20 Smart Investing & Trading Score: 85 | |
| Day Percent Change: 3.96% Day Change: 14.85 | |
| Week Change: 4.88% Year-to-date Change: 10.8% | |
| WST Links: Profile News Message Board | |
| Charts:- Daily , Weekly | |
| Add WST to Watchlist: View: Get Complete WST Trend Analysis ➞ | |
 | PODD Insulet Corporation |
| Sector: Health Care | |
| SubSector: Medical Instruments & Supplies | |
| MarketCap: 9313.2 Millions | |
| Recent Price: 167.27 Smart Investing & Trading Score: 67 | |
| Day Percent Change: 1.73% Day Change: 2.85 | |
| Week Change: 0.61% Year-to-date Change: -22.9% | |
| PODD Links: Profile News Message Board | |
| Charts:- Daily , Weekly | |
| Add PODD to Watchlist: View: Get Complete PODD Trend Analysis ➞ | |
 | HOLX Hologic, Inc. |
| Sector: Health Care | |
| SubSector: Medical Instruments & Supplies | |
| MarketCap: 9075.2 Millions | |
| Recent Price: 77.19 Smart Investing & Trading Score: 68 | |
| Day Percent Change: 1.27% Day Change: 0.97 | |
| Week Change: 2.4% Year-to-date Change: 8.0% | |
| HOLX Links: Profile News Message Board | |
| Charts:- Daily , Weekly | |
| Add HOLX to Watchlist: View: Get Complete HOLX Trend Analysis ➞ | |
 | DVA DaVita Inc. |
| Sector: Health Care | |
| SubSector: Specialized Health Services | |
| MarketCap: 8954.36 Millions | |
| Recent Price: 133.91 Smart Investing & Trading Score: 83 | |
| Day Percent Change: 1.05% Day Change: 1.39 | |
| Week Change: 4.76% Year-to-date Change: 27.8% | |
| DVA Links: Profile News Message Board | |
| Charts:- Daily , Weekly | |
| Add DVA to Watchlist: View: Get Complete DVA Trend Analysis ➞ | |
 | EXAS Exact Sciences Corporation |
| Sector: Health Care | |
| SubSector: Medical Laboratories & Research | |
| MarketCap: 8572 Millions | |
| Recent Price: 63.53 Smart Investing & Trading Score: 25 | |
| Day Percent Change: 1.79% Day Change: 1.12 | |
| Week Change: 4.22% Year-to-date Change: -14.1% | |
| EXAS Links: Profile News Message Board | |
| Charts:- Daily , Weekly | |
| Add EXAS to Watchlist: View: Get Complete EXAS Trend Analysis ➞ | |
 | MASI Masimo Corporation |
| Sector: Health Care | |
| SubSector: Medical Instruments & Supplies | |
| MarketCap: 8493.2 Millions | |
| Recent Price: 136.95 Smart Investing & Trading Score: 68 | |
| Day Percent Change: 1.96% Day Change: 2.63 | |
| Week Change: 1.62% Year-to-date Change: 16.8% | |
| MASI Links: Profile News Message Board | |
| Charts:- Daily , Weekly | |
| Add MASI to Watchlist: View: Get Complete MASI Trend Analysis ➞ | |
 | NBIX Neurocrine Biosciences, Inc. |
| Sector: Health Care | |
| SubSector: Biotechnology | |
| MarketCap: 7897.85 Millions | |
| Recent Price: 140.09 Smart Investing & Trading Score: 82 | |
| Day Percent Change: 4.81% Day Change: 6.43 | |
| Week Change: 6.13% Year-to-date Change: 6.3% | |
| NBIX Links: Profile News Message Board | |
| Charts:- Daily , Weekly | |
| Add NBIX to Watchlist: View: Get Complete NBIX Trend Analysis ➞ | |
 | ROIV Roivant Sciences Ltd. |
| Sector: Health Care | |
| SubSector: Biotechnology | |
| MarketCap: 7780 Millions | |
| Recent Price: 10.94 Smart Investing & Trading Score: 68 | |
| Day Percent Change: 3.06% Day Change: 0.33 | |
| Week Change: 4.54% Year-to-date Change: -1.5% | |
| ROIV Links: Profile News Message Board | |
| Charts:- Daily , Weekly | |
| Add ROIV to Watchlist: View: Get Complete ROIV Trend Analysis ➞ | |
 | ELAN Elanco Animal Health Incorporated |
| Sector: Health Care | |
| SubSector: Drugs - Generic | |
| MarketCap: 7752.15 Millions | |
| Recent Price: 13.46 Smart Investing & Trading Score: 17 | |
| Day Percent Change: 4.10% Day Change: 0.53 | |
| Week Change: 3.94% Year-to-date Change: -9.7% | |
| ELAN Links: Profile News Message Board | |
| Charts:- Daily , Weekly | |
| Add ELAN to Watchlist: View: Get Complete ELAN Trend Analysis ➞ | |
 | XRAY DENTSPLY SIRONA Inc. |
| Sector: Health Care | |
| SubSector: Medical Instruments & Supplies | |
| MarketCap: 7746.1 Millions | |
| Recent Price: 30.86 Smart Investing & Trading Score: 25 | |
| Day Percent Change: 1.61% Day Change: 0.49 | |
| Week Change: 1.18% Year-to-date Change: -13.3% | |
| XRAY Links: Profile News Message Board | |
| Charts:- Daily , Weekly | |
| Add XRAY to Watchlist: View: Get Complete XRAY Trend Analysis ➞ | |
 | SRPT Sarepta Therapeutics, Inc. |
| Sector: Health Care | |
| SubSector: Biotechnology | |
| MarketCap: 7388.05 Millions | |
| Recent Price: 117.12 Smart Investing & Trading Score: 30 | |
| Day Percent Change: 0.14% Day Change: 0.16 | |
| Week Change: 1.3% Year-to-date Change: 21.5% | |
| SRPT Links: Profile News Message Board | |
| Charts:- Daily , Weekly | |
| Add SRPT to Watchlist: View: Get Complete SRPT Trend Analysis ➞ | |
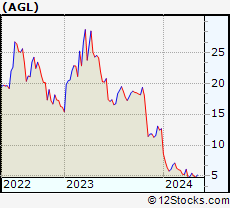 | AGL agilon health, inc. |
| Sector: Health Care | |
| SubSector: Medical Care Facilities | |
| MarketCap: 7310 Millions | |
| Recent Price: 5.34 Smart Investing & Trading Score: 67 | |
| Day Percent Change: 3.49% Day Change: 0.18 | |
| Week Change: -2.2% Year-to-date Change: -57.8% | |
| AGL Links: Profile News Message Board | |
| Charts:- Daily , Weekly | |
| Add AGL to Watchlist: View: Get Complete AGL Trend Analysis ➞ | |
 | MOH Molina Healthcare, Inc. |
| Sector: Health Care | |
| SubSector: Health Care Plans | |
| MarketCap: 7235.6 Millions | |
| Recent Price: 363.22 Smart Investing & Trading Score: 44 | |
| Day Percent Change: 0.37% Day Change: 1.35 | |
| Week Change: -1.17% Year-to-date Change: 0.5% | |
| MOH Links: Profile News Message Board | |
| Charts:- Daily , Weekly | |
| Add MOH to Watchlist: View: Get Complete MOH Trend Analysis ➞ | |
 | UHS Universal Health Services, Inc. |
| Sector: Health Care | |
| SubSector: Hospitals | |
| MarketCap: 7217.66 Millions | |
| Recent Price: 164.91 Smart Investing & Trading Score: 58 | |
| Day Percent Change: 2.35% Day Change: 3.78 | |
| Week Change: 4.72% Year-to-date Change: 8.2% | |
| UHS Links: Profile News Message Board | |
| Charts:- Daily , Weekly | |
| Add UHS to Watchlist: View: Get Complete UHS Trend Analysis ➞ | |
 | ICLR ICON Public Limited Company |
| Sector: Health Care | |
| SubSector: Medical Laboratories & Research | |
| MarketCap: 7011 Millions | |
| Recent Price: 306.45 Smart Investing & Trading Score: 58 | |
| Day Percent Change: 2.86% Day Change: 8.52 | |
| Week Change: 6.32% Year-to-date Change: 8.3% | |
| ICLR Links: Profile News Message Board | |
| Charts:- Daily , Weekly | |
| Add ICLR to Watchlist: View: Get Complete ICLR Trend Analysis ➞ | |
 | TECH Bio-Techne Corporation |
| Sector: Health Care | |
| SubSector: Biotechnology | |
| MarketCap: 6958.05 Millions | |
| Recent Price: 63.69 Smart Investing & Trading Score: 42 | |
| Day Percent Change: 1.42% Day Change: 0.89 | |
| Week Change: 2.53% Year-to-date Change: -17.5% | |
| TECH Links: Profile News Message Board | |
| Charts:- Daily , Weekly | |
| Add TECH to Watchlist: View: Get Complete TECH Trend Analysis ➞ | |
 | IONS Ionis Pharmaceuticals, Inc. |
| Sector: Health Care | |
| SubSector: Biotechnology | |
| MarketCap: 6725.05 Millions | |
| Recent Price: 41.84 Smart Investing & Trading Score: 49 | |
| Day Percent Change: 1.87% Day Change: 0.77 | |
| Week Change: 2.85% Year-to-date Change: -17.3% | |
| IONS Links: Profile News Message Board | |
| Charts:- Daily , Weekly | |
| Add IONS to Watchlist: View: Get Complete IONS Trend Analysis ➞ | |
 | DOCS Doximity, Inc. |
| Sector: Health Care | |
| SubSector: Health Information Services | |
| MarketCap: 6540 Millions | |
| Recent Price: 24.58 Smart Investing & Trading Score: 17 | |
| Day Percent Change: -0.85% Day Change: -0.21 | |
| Week Change: -0.2% Year-to-date Change: -13.5% | |
| DOCS Links: Profile News Message Board | |
| Charts:- Daily , Weekly | |
| Add DOCS to Watchlist: View: Get Complete DOCS Trend Analysis ➞ | |
 | PRGO Perrigo Company plc |
| Sector: Health Care | |
| SubSector: Drug Related Products | |
| MarketCap: 6493.93 Millions | |
| Recent Price: 30.49 Smart Investing & Trading Score: 42 | |
| Day Percent Change: 1.43% Day Change: 0.43 | |
| Week Change: -1.01% Year-to-date Change: -5.3% | |
| PRGO Links: Profile News Message Board | |
| Charts:- Daily , Weekly | |
| Add PRGO to Watchlist: View: Get Complete PRGO Trend Analysis ➞ | |
 | CTLT Catalent, Inc. |
| Sector: Health Care | |
| SubSector: Drugs - Generic | |
| MarketCap: 6351.95 Millions | |
| Recent Price: 56.03 Smart Investing & Trading Score: 61 | |
| Day Percent Change: -0.04% Day Change: -0.02 | |
| Week Change: 0.99% Year-to-date Change: 24.7% | |
| CTLT Links: Profile News Message Board | |
| Charts:- Daily , Weekly | |
| Add CTLT to Watchlist: View: Get Complete CTLT Trend Analysis ➞ | |
 | CHE Chemed Corporation |
| Sector: Health Care | |
| SubSector: Home Health Care | |
| MarketCap: 6148.95 Millions | |
| Recent Price: 616.51 Smart Investing & Trading Score: 58 | |
| Day Percent Change: 2.00% Day Change: 12.09 | |
| Week Change: 2.68% Year-to-date Change: 5.4% | |
| CHE Links: Profile News Message Board | |
| Charts:- Daily , Weekly | |
| Add CHE to Watchlist: View: Get Complete CHE Trend Analysis ➞ | |
 | AMED Amedisys, Inc. |
| Sector: Health Care | |
| SubSector: Home Health Care | |
| MarketCap: 6058.95 Millions | |
| Recent Price: 91.16 Smart Investing & Trading Score: 40 | |
| Day Percent Change: -0.09% Day Change: -0.08 | |
| Week Change: 0.84% Year-to-date Change: -4.1% | |
| AMED Links: Profile News Message Board | |
| Charts:- Daily , Weekly | |
| Add AMED to Watchlist: View: Get Complete AMED Trend Analysis ➞ | |
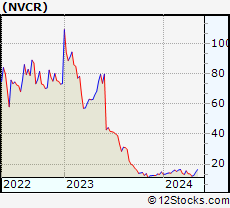 | NVCR NovoCure Limited |
| Sector: Health Care | |
| SubSector: Medical Appliances & Equipment | |
| MarketCap: 5939.5 Millions | |
| Recent Price: 12.06 Smart Investing & Trading Score: 35 | |
| Day Percent Change: 1.90% Day Change: 0.22 | |
| Week Change: -0.29% Year-to-date Change: -19.3% | |
| NVCR Links: Profile News Message Board | |
| Charts:- Daily , Weekly | |
| Add NVCR to Watchlist: View: Get Complete NVCR Trend Analysis ➞ | |
 | BRKR Bruker Corporation |
| Sector: Health Care | |
| SubSector: Medical Laboratories & Research | |
| MarketCap: 5932 Millions | |
| Recent Price: 82.46 Smart Investing & Trading Score: 63 | |
| Day Percent Change: 5.65% Day Change: 4.41 | |
| Week Change: 6.04% Year-to-date Change: 12.2% | |
| BRKR Links: Profile News Message Board | |
| Charts:- Daily , Weekly | |
| Add BRKR to Watchlist: View: Get Complete BRKR Trend Analysis ➞ | |
 | CRL Charles River Laboratories International, Inc. |
| Sector: Health Care | |
| SubSector: Medical Laboratories & Research | |
| MarketCap: 5700.5 Millions | |
| Recent Price: 240.13 Smart Investing & Trading Score: 63 | |
| Day Percent Change: 3.26% Day Change: 7.57 | |
| Week Change: 5.89% Year-to-date Change: 1.6% | |
| CRL Links: Profile News Message Board | |
| Charts:- Daily , Weekly | |
| Add CRL to Watchlist: View: Get Complete CRL Trend Analysis ➞ | |
| For tabular summary view of above stock list: Summary View ➞ 0 - 25 , 25 - 50 , 50 - 75 | ||
| Click To Change The Sort Order: By Market Cap or Company Size Performance: Year-to-date, Week and Day | |
| Select Chart Type: | ||
|
Best Stocks Today 12Stocks.com |
© 2024 12Stocks.com Terms & Conditions Privacy Contact Us
All Information Provided Only For Education And Not To Be Used For Investing or Trading. See Terms & Conditions


One More Thing ... Get Best Stocks Delivered Daily!
Never Ever Miss A Move With Our Top Ten Stocks Lists
Find Best Stocks In Any Market - Bull or Bear Market
Take A Peek At Our Top Ten Stocks Lists: Daily, Weekly, Year-to-Date & Top Trends
Find Best Stocks In Any Market - Bull or Bear Market
Take A Peek At Our Top Ten Stocks Lists: Daily, Weekly, Year-to-Date & Top Trends
Midcap Stocks With Best Up Trends [0-bearish to 100-bullish]: HashiCorp [100], Ryder System[100], Quest Diagnostics[100], Hasbro [100], RLI [100], Popular [100], BioMarin Pharmaceutical[100], SLM [100], Kirby [100], Highwoods Properties[100], HEICO [100]
Best Midcap Stocks Year-to-Date:
AppLovin [78.89%], Vistra Energy[77.7%], ShockWave Medical[72.41%], Spotify [61.41%], Constellation Energy[60.75%], EMCOR [56.93%], Natera [45.34%], Pure Storage[45.26%], Wingstop [42.15%], Williams-Sonoma [41.28%], CAVA [40.73%] Best Midcap Stocks This Week:
HashiCorp [22.53%], Tandem Diabetes[14.92%], Globe Life[13.52%], Ryder System[12.23%], Coinbase Global[12.04%], MongoDB [11.91%], Spotify [9.96%], Kohl s[9.53%], Medpace [9.49%], Repligen [9%], GitLab [8.91%] Best Midcap Stocks Daily:
HashiCorp [19.54%], Globe Life[14.11%], Ryder System[11.94%], Spotify [11.41%], Tandem Diabetes[10.11%], Repligen [8.76%], Medpace [8.21%], Viasat [7.99%], MongoDB [7.69%], GitLab [6.80%], Lucid [6.11%]