
 Login Sign Up


| |||||
 |  | ||||

| 12Stocks.com Market Intelligence |
Best MidCap Stocks
|
| In a hurry? Mid Cap Stocks Lists: Performance Trends Table, Stock Charts
Sort midcap stocks: Daily, Weekly, Year-to-Date, Market Cap & Trends. Filter midcap stocks list by sector: Show all, Tech, Finance, Energy, Staples, Retail, Industrial, Materials, Utilities and HealthCare Filter midcap stocks list by size:All MidCap Large Mid-Range Small |
| 12Stocks.com Mid Cap Stocks Performances & Trends Daily | |||||||||
|
|  The overall Smart Investing & Trading Score is 44 (0-bearish to 100-bullish) which puts Mid Cap index in short term neutral trend. The Smart Investing & Trading Score from previous trading session is 36 and hence an improvement of trend.
| ||||||||
Here are the Smart Investing & Trading Scores of the most requested mid cap stocks at 12Stocks.com (click stock name for detailed review):
|


| 12Stocks.com: Top Performing Mid Cap Index Stocks | ||||||||||||||||||||||||||||||||||||||||||||||||
 The top performing Mid Cap Index stocks year to date are
Now, more recently, over last week, the top performing Mid Cap Index stocks on the move are


|
||||||||||||||||||||||||||||||||||||||||||||||||
| 12Stocks.com: Investing in Midcap Index with Stocks | |
|
The following table helps investors and traders sort through current performance and trends (as measured by Smart Investing & Trading Score) of various
stocks in the Midcap Index. Quick View: Move mouse or cursor over stock symbol (ticker) to view short-term technical chart and over stock name to view long term chart. Click on  to add stock symbol to your watchlist and to add stock symbol to your watchlist and  to view watchlist. Click on any ticker or stock name for detailed market intelligence report for that stock. to view watchlist. Click on any ticker or stock name for detailed market intelligence report for that stock. |
12Stocks.com Performance of Stocks in Midcap Index
| Ticker | Stock Name | Watchlist | Category | Recent Price | Smart Investing & Trading Score | Change % | YTD Change% |
| PHM | Pulte |   | Industrials | 105.43 | 36 | -0.50% | 2.14% |
| PTC | PTC | | Technology | 176.37 | 10 | 0.38% | 0.81% |
| JNPR | Juniper Networks | | Technology | 36.06 | 5 | -0.28% | 22.32% |
| RNR | RenaissanceRe | | Financials | 224.74 | 39 | 0.85% | 14.66% |
| CHE | Chemed | | Health Care | 600.41 | 36 | 0.50% | 2.68% |
| ALB | Albemarle | | Materials | 112.15 | 20 | 0.31% | -22.38% |
| AMH | American Homes | | Financials | 35.27 | 45 | 0.69% | -1.92% |
| TXT | Textron | | Industrials | 93.30 | 56 | 0.78% | 16.02% |
| AIZ | Assurant | | Financials | 173.83 | 58 | 1.72% | 3.17% |
| IPGP | IPG Photonics | | Technology | 84.27 | 18 | -0.38% | -22.36% |
| AMED | Amedisys | | Health Care | 90.40 | 0 | -0.42% | -4.90% |
| HUBB | Hubbell | | Technology | 388.03 | 41 | -1.08% | 17.97% |
| WSO | Watsco | | Services & Goods | 396.92 | 26 | -1.25% | -7.36% |
| AAP | Advance Auto | | Services & Goods | 78.69 | 68 | 1.93% | 28.94% |
| SNA | Snap-on | | Industrials | 268.80 | 0 | 2.69% | -6.94% |
| NVCR | NovoCure | | Health Care | 12.09 | 20 | 0.33% | -19.02% |
| BRKR | Bruker | | Health Care | 77.76 | 26 | -1.02% | 5.82% |
| PEGA | Pega | | Technology | 57.61 | 36 | -1.35% | 17.91% |
| ENTG | Entegris | | Technology | 122.20 | 26 | -3.85% | 1.99% |
| FRT | Federal Realty | | Financials | 99.77 | 42 | 1.26% | -3.18% |
| UGI | UGI | | Utilities | 25.74 | 100 | 8.20% | 4.63% |
| NWSA | News | | Services & Goods | 24.02 | 18 | -0.04% | -2.16% |
| NWL | Newell | | Consumer Staples | 6.88 | 20 | -0.43% | -20.74% |
| HTZ | Hertz Global | | Industrials | 5.97 | 5 | -0.33% | -42.54% |
| ARES | Ares Management | | Financials | 129.53 | 26 | -0.90% | 8.92% |
| For chart view version of above stock list: Chart View ➞ 0 - 25 , 25 - 50 , 50 - 75 , 75 - 100 , 100 - 125 , 125 - 150 , 150 - 175 , 175 - 200 , 200 - 225 , 225 - 250 , 250 - 275 , 275 - 300 , 300 - 325 , 325 - 350 , 350 - 375 , 375 - 400 , 400 - 425 , 425 - 450 , 450 - 475 , 475 - 500 , 500 - 525 , 525 - 550 , 550 - 575 , 575 - 600 , 600 - 625 , 625 - 650 , 650 - 675 , 675 - 700 , 700 - 725 , 725 - 750 , 750 - 775 | ||
 | Click To Change The Sort Order: By Market Cap or Company Size Performance: Year-to-date, Week and Day |  |
|
Get the most comprehensive stock market coverage daily at 12Stocks.com ➞ Best Stocks Today ➞ Best Stocks Weekly ➞ Best Stocks Year-to-Date ➞ Best Stocks Trends ➞  Best Stocks Today 12Stocks.com Best Nasdaq Stocks ➞ Best S&P 500 Stocks ➞ Best Tech Stocks ➞ Best Biotech Stocks ➞ |
| Detailed Overview of Midcap Stocks |
| Midcap Technical Overview, Leaders & Laggards, Top Midcap ETF Funds & Detailed Midcap Stocks List, Charts, Trends & More |
| Midcap: Technical Analysis, Trends & YTD Performance | |
| MidCap segment as represented by
MDY, an exchange-traded fund [ETF], holds basket of about four hundred midcap stocks from across all major sectors of the US stock market. The midcap index (contains stocks like Green Mountain Coffee Roasters and Tractor Supply Company) is up by 2.15% and is currently underperforming the overall market by -1.23% year-to-date. Below is a quick view of technical charts and trends: | |
 MDY Weekly Chart |
|
| Long Term Trend: Good | |
| Medium Term Trend: Not Good | |
 MDY Daily Chart |
|
| Short Term Trend: Deteriorating | |
| Overall Trend Score: 44 | |
| YTD Performance: 2.15% | |
| **Trend Scores & Views Are Only For Educational Purposes And Not For Investing | |
| 12Stocks.com: Investing in Midcap Index using Exchange Traded Funds | |
|
The following table shows list of key exchange traded funds (ETF) that
help investors track Midcap index. The following list also includes leveraged ETF funds that track twice or thrice the daily returns of Midcap indices. Short or inverse ETF funds move in the opposite direction to the index they track and are useful during market pullbacks or during bear markets. Quick View: Move mouse or cursor over ETF symbol (ticker) to view short-term technical chart and over ETF name to view long term chart. Click on ticker or stock name for detailed view. Click on to add stock symbol to your watchlist and to view watchlist. |
12Stocks.com List of ETFs that track Midcap Index
| Ticker | ETF Name | Watchlist | Recent Price | Smart Investing & Trading Score | Change % | Week % | Year-to-date % |
| IJH | iShares Core S&P Mid-Cap | | 56.58 | 44 | 0.27 | -2.26 | 2.07% |
| IWR | iShares Russell Mid-Cap | | 78.66 | 44 | -0.06 | -2.43 | 1.2% |
| IWP | iShares Russell Mid-Cap Growth | | 105.70 | 36 | -0.75 | -3.77 | 1.19% |
| MDY | SPDR S&P MidCap 400 ETF | | 518.28 | 44 | 0.33 | -2.2 | 2.15% |
| IWS | iShares Russell Mid-Cap Value | | 117.65 | 49 | 0.29 | -1.87 | 1.17% |
| IJK | iShares S&P Mid-Cap 400 Growth | | 84.85 | 36 | -0.21 | -3.01 | 7.11% |
| IJJ | iShares S&P Mid-Cap 400 Value | | 110.55 | 38 | 1.00 | -1.29 | -3.06% |
| XMLV | PowerShares S&P MidCap Low Volatil ETF | | 54.16 | 68 | 1.06 | -0.17 | 1.84% |
| MVV | ProShares Ultra MidCap400 | | 59.00 | 36 | 0.99 | -4.42 | 1.92% |
| SMDD | ProShares UltraPro Short MidCap400 | | 12.56 | 54 | -1.00 | 6.92 | -6.69% |
| MZZ | ProShares UltraShort MidCap400 | | 12.17 | 34 | -0.49 | 4.92 | -3.18% |
| UMDD | ProShares UltraPro MidCap400 | | 22.56 | 36 | 1.14 | -6.66 | 1.09% |
| MYY | ProShares Short MidCap400 | | 21.19 | 69 | -0.33 | 2.35 | -1.24% |
| 12Stocks.com: Charts, Trends, Fundamental Data and Performances of MidCap Stocks | |
|
We now take in-depth look at all MidCap stocks including charts, multi-period performances and overall trends (as measured by Smart Investing & Trading Score). One can sort MidCap stocks (click link to choose) by Daily, Weekly and by Year-to-Date performances. Also, one can sort by size of the company or by market capitalization. |
| Select Your Default Chart Type: | |||||
| |||||
| Click on stock symbol or name for detailed view. Click on to add stock symbol to your watchlist and to view watchlist. Quick View: Move mouse or cursor over "Daily" to quickly view daily technical stock chart and over "Weekly" to view weekly technical stock chart. | |||||

 | PHM PulteGroup, Inc. |
| Sector: Industrials | |
| SubSector: Residential Construction | |
| MarketCap: 6186.46 Millions | |
| Recent Price: 105.43 Smart Investing & Trading Score: 36 | |
| Day Percent Change: -0.50% Day Change: -0.53 | |
| Week Change: -4.92% Year-to-date Change: 2.1% | |
| PHM Links: Profile News Message Board | |
| Charts:- Daily , Weekly | |
| Add PHM to Watchlist: View: Get Complete PHM Trend Analysis ➞ | |
 | PTC PTC Inc. |
| Sector: Technology | |
| SubSector: Technical & System Software | |
| MarketCap: 6166.7 Millions | |
| Recent Price: 176.37 Smart Investing & Trading Score: 10 | |
| Day Percent Change: 0.38% Day Change: 0.67 | |
| Week Change: -2.05% Year-to-date Change: 0.8% | |
| PTC Links: Profile News Message Board | |
| Charts:- Daily , Weekly | |
| Add PTC to Watchlist: View: Get Complete PTC Trend Analysis ➞ | |
 | JNPR Juniper Networks, Inc. |
| Sector: Technology | |
| SubSector: Communication Equipment | |
| MarketCap: 6161.49 Millions | |
| Recent Price: 36.06 Smart Investing & Trading Score: 5 | |
| Day Percent Change: -0.28% Day Change: -0.10 | |
| Week Change: -1.61% Year-to-date Change: 22.3% | |
| JNPR Links: Profile News Message Board | |
| Charts:- Daily , Weekly | |
| Add JNPR to Watchlist: View: Get Complete JNPR Trend Analysis ➞ | |
 | RNR RenaissanceRe Holdings Ltd. |
| Sector: Financials | |
| SubSector: Property & Casualty Insurance | |
| MarketCap: 6153.32 Millions | |
| Recent Price: 224.74 Smart Investing & Trading Score: 39 | |
| Day Percent Change: 0.85% Day Change: 1.90 | |
| Week Change: 4.15% Year-to-date Change: 14.7% | |
| RNR Links: Profile News Message Board | |
| Charts:- Daily , Weekly | |
| Add RNR to Watchlist: View: Get Complete RNR Trend Analysis ➞ | |
 | CHE Chemed Corporation |
| Sector: Health Care | |
| SubSector: Home Health Care | |
| MarketCap: 6148.95 Millions | |
| Recent Price: 600.41 Smart Investing & Trading Score: 36 | |
| Day Percent Change: 0.50% Day Change: 2.99 | |
| Week Change: -2.93% Year-to-date Change: 2.7% | |
| CHE Links: Profile News Message Board | |
| Charts:- Daily , Weekly | |
| Add CHE to Watchlist: View: Get Complete CHE Trend Analysis ➞ | |
 | ALB Albemarle Corporation |
| Sector: Materials | |
| SubSector: Specialty Chemicals | |
| MarketCap: 6139.27 Millions | |
| Recent Price: 112.15 Smart Investing & Trading Score: 20 | |
| Day Percent Change: 0.31% Day Change: 0.35 | |
| Week Change: -8.51% Year-to-date Change: -22.4% | |
| ALB Links: Profile News Message Board | |
| Charts:- Daily , Weekly | |
| Add ALB to Watchlist: View: Get Complete ALB Trend Analysis ➞ | |
 | AMH American Homes 4 Rent |
| Sector: Financials | |
| SubSector: REIT - Residential | |
| MarketCap: 6135.31 Millions | |
| Recent Price: 35.27 Smart Investing & Trading Score: 45 | |
| Day Percent Change: 0.69% Day Change: 0.24 | |
| Week Change: -0.82% Year-to-date Change: -1.9% | |
| AMH Links: Profile News Message Board | |
| Charts:- Daily , Weekly | |
| Add AMH to Watchlist: View: Get Complete AMH Trend Analysis ➞ | |
 | TXT Textron Inc. |
| Sector: Industrials | |
| SubSector: Aerospace/Defense - Major Diversified | |
| MarketCap: 6123.09 Millions | |
| Recent Price: 93.30 Smart Investing & Trading Score: 56 | |
| Day Percent Change: 0.78% Day Change: 0.72 | |
| Week Change: -0.7% Year-to-date Change: 16.0% | |
| TXT Links: Profile News Message Board | |
| Charts:- Daily , Weekly | |
| Add TXT to Watchlist: View: Get Complete TXT Trend Analysis ➞ | |
 | AIZ Assurant, Inc. |
| Sector: Financials | |
| SubSector: Accident & Health Insurance | |
| MarketCap: 6110.3 Millions | |
| Recent Price: 173.83 Smart Investing & Trading Score: 58 | |
| Day Percent Change: 1.72% Day Change: 2.94 | |
| Week Change: -0.21% Year-to-date Change: 3.2% | |
| AIZ Links: Profile News Message Board | |
| Charts:- Daily , Weekly | |
| Add AIZ to Watchlist: View: Get Complete AIZ Trend Analysis ➞ | |
 | IPGP IPG Photonics Corporation |
| Sector: Technology | |
| SubSector: Semiconductor Equipment & Materials | |
| MarketCap: 6059.38 Millions | |
| Recent Price: 84.27 Smart Investing & Trading Score: 18 | |
| Day Percent Change: -0.38% Day Change: -0.32 | |
| Week Change: -1.73% Year-to-date Change: -22.4% | |
| IPGP Links: Profile News Message Board | |
| Charts:- Daily , Weekly | |
| Add IPGP to Watchlist: View: Get Complete IPGP Trend Analysis ➞ | |
 | AMED Amedisys, Inc. |
| Sector: Health Care | |
| SubSector: Home Health Care | |
| MarketCap: 6058.95 Millions | |
| Recent Price: 90.40 Smart Investing & Trading Score: 0 | |
| Day Percent Change: -0.42% Day Change: -0.38 | |
| Week Change: -1.63% Year-to-date Change: -4.9% | |
| AMED Links: Profile News Message Board | |
| Charts:- Daily , Weekly | |
| Add AMED to Watchlist: View: Get Complete AMED Trend Analysis ➞ | |
 | HUBB Hubbell Incorporated |
| Sector: Technology | |
| SubSector: Diversified Electronics | |
| MarketCap: 6002.46 Millions | |
| Recent Price: 388.03 Smart Investing & Trading Score: 41 | |
| Day Percent Change: -1.08% Day Change: -4.25 | |
| Week Change: -3.41% Year-to-date Change: 18.0% | |
| HUBB Links: Profile News Message Board | |
| Charts:- Daily , Weekly | |
| Add HUBB to Watchlist: View: Get Complete HUBB Trend Analysis ➞ | |
 | WSO Watsco, Inc. |
| Sector: Services & Goods | |
| SubSector: Electronics Wholesale | |
| MarketCap: 6000.33 Millions | |
| Recent Price: 396.92 Smart Investing & Trading Score: 26 | |
| Day Percent Change: -1.25% Day Change: -5.01 | |
| Week Change: -4.98% Year-to-date Change: -7.4% | |
| WSO Links: Profile News Message Board | |
| Charts:- Daily , Weekly | |
| Add WSO to Watchlist: View: Get Complete WSO Trend Analysis ➞ | |
 | AAP Advance Auto Parts, Inc. |
| Sector: Services & Goods | |
| SubSector: Auto Parts Stores | |
| MarketCap: 5977.7 Millions | |
| Recent Price: 78.69 Smart Investing & Trading Score: 68 | |
| Day Percent Change: 1.93% Day Change: 1.49 | |
| Week Change: 11.62% Year-to-date Change: 28.9% | |
| AAP Links: Profile News Message Board | |
| Charts:- Daily , Weekly | |
| Add AAP to Watchlist: View: Get Complete AAP Trend Analysis ➞ | |
 | SNA Snap-on Incorporated |
| Sector: Industrials | |
| SubSector: Small Tools & Accessories | |
| MarketCap: 5947.26 Millions | |
| Recent Price: 268.80 Smart Investing & Trading Score: 0 | |
| Day Percent Change: 2.69% Day Change: 7.04 | |
| Week Change: -7.18% Year-to-date Change: -6.9% | |
| SNA Links: Profile News Message Board | |
| Charts:- Daily , Weekly | |
| Add SNA to Watchlist: View: Get Complete SNA Trend Analysis ➞ | |
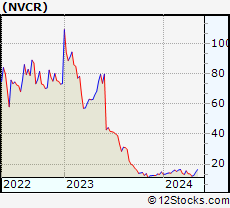 | NVCR NovoCure Limited |
| Sector: Health Care | |
| SubSector: Medical Appliances & Equipment | |
| MarketCap: 5939.5 Millions | |
| Recent Price: 12.09 Smart Investing & Trading Score: 20 | |
| Day Percent Change: 0.33% Day Change: 0.04 | |
| Week Change: -10.91% Year-to-date Change: -19.0% | |
| NVCR Links: Profile News Message Board | |
| Charts:- Daily , Weekly | |
| Add NVCR to Watchlist: View: Get Complete NVCR Trend Analysis ➞ | |
 | BRKR Bruker Corporation |
| Sector: Health Care | |
| SubSector: Medical Laboratories & Research | |
| MarketCap: 5932 Millions | |
| Recent Price: 77.76 Smart Investing & Trading Score: 26 | |
| Day Percent Change: -1.02% Day Change: -0.80 | |
| Week Change: -11.21% Year-to-date Change: 5.8% | |
| BRKR Links: Profile News Message Board | |
| Charts:- Daily , Weekly | |
| Add BRKR to Watchlist: View: Get Complete BRKR Trend Analysis ➞ | |
 | PEGA Pegasystems Inc. |
| Sector: Technology | |
| SubSector: Business Software & Services | |
| MarketCap: 5924.88 Millions | |
| Recent Price: 57.61 Smart Investing & Trading Score: 36 | |
| Day Percent Change: -1.35% Day Change: -0.79 | |
| Week Change: -4.6% Year-to-date Change: 17.9% | |
| PEGA Links: Profile News Message Board | |
| Charts:- Daily , Weekly | |
| Add PEGA to Watchlist: View: Get Complete PEGA Trend Analysis ➞ | |
 | ENTG Entegris, Inc. |
| Sector: Technology | |
| SubSector: Semiconductor Equipment & Materials | |
| MarketCap: 5890.38 Millions | |
| Recent Price: 122.20 Smart Investing & Trading Score: 26 | |
| Day Percent Change: -3.85% Day Change: -4.89 | |
| Week Change: -8.03% Year-to-date Change: 2.0% | |
| ENTG Links: Profile News Message Board | |
| Charts:- Daily , Weekly | |
| Add ENTG to Watchlist: View: Get Complete ENTG Trend Analysis ➞ | |
 | FRT Federal Realty Investment Trust |
| Sector: Financials | |
| SubSector: REIT - Retail | |
| MarketCap: 5878.64 Millions | |
| Recent Price: 99.77 Smart Investing & Trading Score: 42 | |
| Day Percent Change: 1.26% Day Change: 1.24 | |
| Week Change: 0.03% Year-to-date Change: -3.2% | |
| FRT Links: Profile News Message Board | |
| Charts:- Daily , Weekly | |
| Add FRT to Watchlist: View: Get Complete FRT Trend Analysis ➞ | |
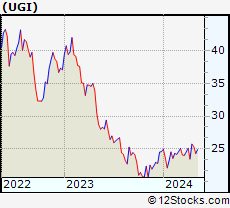 | UGI UGI Corporation |
| Sector: Utilities | |
| SubSector: Diversified Utilities | |
| MarketCap: 5872.8 Millions | |
| Recent Price: 25.74 Smart Investing & Trading Score: 100 | |
| Day Percent Change: 8.20% Day Change: 1.95 | |
| Week Change: 9.72% Year-to-date Change: 4.6% | |
| UGI Links: Profile News Message Board | |
| Charts:- Daily , Weekly | |
| Add UGI to Watchlist: View: Get Complete UGI Trend Analysis ➞ | |
 | NWSA News Corporation |
| Sector: Services & Goods | |
| SubSector: Broadcasting - TV | |
| MarketCap: 5857.53 Millions | |
| Recent Price: 24.02 Smart Investing & Trading Score: 18 | |
| Day Percent Change: -0.04% Day Change: -0.01 | |
| Week Change: -1.4% Year-to-date Change: -2.2% | |
| NWSA Links: Profile News Message Board | |
| Charts:- Daily , Weekly | |
| Add NWSA to Watchlist: View: Get Complete NWSA Trend Analysis ➞ | |
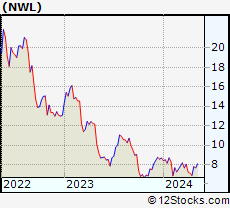 | NWL Newell Brands Inc. |
| Sector: Consumer Staples | |
| SubSector: Housewares & Accessories | |
| MarketCap: 5833.53 Millions | |
| Recent Price: 6.88 Smart Investing & Trading Score: 20 | |
| Day Percent Change: -0.43% Day Change: -0.03 | |
| Week Change: -3.37% Year-to-date Change: -20.7% | |
| NWL Links: Profile News Message Board | |
| Charts:- Daily , Weekly | |
| Add NWL to Watchlist: View: Get Complete NWL Trend Analysis ➞ | |
 | HTZ Hertz Global Holdings, Inc. |
| Sector: Industrials | |
| SubSector: Rental & Leasing Services | |
| MarketCap: 5830 Millions | |
| Recent Price: 5.97 Smart Investing & Trading Score: 5 | |
| Day Percent Change: -0.33% Day Change: -0.02 | |
| Week Change: -12.85% Year-to-date Change: -42.5% | |
| HTZ Links: Profile News Message Board | |
| Charts:- Daily , Weekly | |
| Add HTZ to Watchlist: View: Get Complete HTZ Trend Analysis ➞ | |
 | ARES Ares Management Corporation |
| Sector: Financials | |
| SubSector: Asset Management | |
| MarketCap: 5826.23 Millions | |
| Recent Price: 129.53 Smart Investing & Trading Score: 26 | |
| Day Percent Change: -0.90% Day Change: -1.17 | |
| Week Change: -1.39% Year-to-date Change: 8.9% | |
| ARES Links: Profile News Message Board | |
| Charts:- Daily , Weekly | |
| Add ARES to Watchlist: View: Get Complete ARES Trend Analysis ➞ | |
| For tabular summary view of above stock list: Summary View ➞ 0 - 25 , 25 - 50 , 50 - 75 , 75 - 100 , 100 - 125 , 125 - 150 , 150 - 175 , 175 - 200 , 200 - 225 , 225 - 250 , 250 - 275 , 275 - 300 , 300 - 325 , 325 - 350 , 350 - 375 , 375 - 400 , 400 - 425 , 425 - 450 , 450 - 475 , 475 - 500 , 500 - 525 , 525 - 550 , 550 - 575 , 575 - 600 , 600 - 625 , 625 - 650 , 650 - 675 , 675 - 700 , 700 - 725 , 725 - 750 , 750 - 775 | ||
| Click To Change The Sort Order: By Market Cap or Company Size Performance: Year-to-date, Week and Day | |
| Select Chart Type: | ||
|
Best Stocks Today 12Stocks.com |
© 2024 12Stocks.com Terms & Conditions Privacy Contact Us
All Information Provided Only For Education And Not To Be Used For Investing or Trading. See Terms & Conditions


One More Thing ... Get Best Stocks Delivered Daily!
Never Ever Miss A Move With Our Top Ten Stocks Lists
Find Best Stocks In Any Market - Bull or Bear Market
Take A Peek At Our Top Ten Stocks Lists: Daily, Weekly, Year-to-Date & Top Trends
Find Best Stocks In Any Market - Bull or Bear Market
Take A Peek At Our Top Ten Stocks Lists: Daily, Weekly, Year-to-Date & Top Trends
Midcap Stocks With Best Up Trends [0-bearish to 100-bullish]: UGI [100], Entergy [100], Bunge [100], Flowers Foods[100], Tyson Foods[100], Genuine Parts[100], Wendy s[100], Alaska Air[100], Consolidated Edison[100], Conagra [100], United Airlines[100]
Best Midcap Stocks Year-to-Date:
ShockWave Medical[72.66%], Vistra Energy[70.46%], AppLovin [67.86%], Constellation Energy[54.47%], EMCOR [52.55%], Spotify [46.79%], Pure Storage[38.7%], Williams-Sonoma [38.37%], CAVA [37.24%], Natera [36.14%], Coupang [35.86%] Best Midcap Stocks This Week:
United Airlines[22.92%], AMC Entertainment[19.25%], Globe Life[12.95%], Genuine Parts[11.7%], Advance Auto[11.62%], Iridium [11.07%], Medical Properties[10.78%], agilon health[10.3%], UGI [9.72%], Alaska Air[8.98%], Flowers Foods[8.66%] Best Midcap Stocks Daily:
AMC Entertainment[8.22%], UGI [8.20%], Hawaiian Electric[6.86%], Fifth Third[5.93%], Iridium [5.14%], agilon health[4.10%], SSR Mining[3.99%], Walgreens Boots[3.70%], Darling Ingredients[3.47%], Citizens Financial[3.31%], J. M.[3.29%]