
 Login Sign Up


| |||||
 |  | ||||

| 12Stocks.com Market Intelligence |
Best MidCap Stocks
|
| In a hurry? Mid Cap Stocks Lists: Performance Trends Table, Stock Charts
Sort midcap stocks: Daily, Weekly, Year-to-Date, Market Cap & Trends. Filter midcap stocks list by sector: Show all, Tech, Finance, Energy, Staples, Retail, Industrial, Materials, Utilities and HealthCare Filter midcap stocks list by size:All MidCap Large Mid-Range Small |
| 12Stocks.com Mid Cap Stocks Performances & Trends Daily | |||||||||
|
|  The overall Smart Investing & Trading Score is 63 (0-bearish to 100-bullish) which puts Mid Cap index in short term neutral to bullish trend. The Smart Investing & Trading Score from previous trading session is 44 and an improvement of trend continues.
| ||||||||
Here are the Smart Investing & Trading Scores of the most requested mid cap stocks at 12Stocks.com (click stock name for detailed review):
|


| 12Stocks.com: Top Performing Mid Cap Index Stocks | ||||||||||||||||||||||||||||||||||||||||||||||||
 The top performing Mid Cap Index stocks year to date are
Now, more recently, over last week, the top performing Mid Cap Index stocks on the move are


|
||||||||||||||||||||||||||||||||||||||||||||||||
| 12Stocks.com: Investing in Midcap Index with Stocks | |
|
The following table helps investors and traders sort through current performance and trends (as measured by Smart Investing & Trading Score) of various
stocks in the Midcap Index. Quick View: Move mouse or cursor over stock symbol (ticker) to view short-term technical chart and over stock name to view long term chart. Click on  to add stock symbol to your watchlist and to add stock symbol to your watchlist and  to view watchlist. Click on any ticker or stock name for detailed market intelligence report for that stock. to view watchlist. Click on any ticker or stock name for detailed market intelligence report for that stock. |
12Stocks.com Performance of Stocks in Midcap Index
| Ticker | Stock Name | Watchlist | Category | Recent Price | Smart Investing & Trading Score | Change % | YTD Change% |
| AVB | AvalonBay Communities |   | Financials | 190.49 | 93 | 0.97% | 1.75% |
| AFL | Aflac | | Financials | 83.93 | 48 | 0.21% | 1.73% |
| LSCC | Lattice Semiconductor | | Technology | 70.18 | 43 | 3.25% | 1.72% |
| ATO | Atmos Energy | | Utilities | 117.86 | 68 | 0.16% | 1.69% |
| PCOR | Procore Technologies | | Technology | 71.00 | 45 | -1.02% | 1.60% |
| ACM | AECOM | | Services & Goods | 93.77 | 61 | -0.12% | 1.45% |
| CCCS | CCC Intelligent | | Technology | 11.51 | 51 | 0.09% | 1.45% |
| SRCL | Stericycle | | Industrials | 50.26 | 65 | -0.15% | 1.40% |
| BYD | Boyd Gaming | | Services & Goods | 63.42 | 55 | -0.28% | 1.29% |
| DRVN | Driven | | Services & Goods | 14.52 | 88 | -3.49% | 1.15% |
| RF | Regions Financial | | Financials | 19.60 | 68 | 1.29% | 1.14% |
| EQT | EQT | | Energy | 39.10 | 100 | 2.95% | 1.14% |
| SPR | Spirit Aero | | Industrials | 32.14 | 53 | 0.03% | 1.13% |
| JKHY | Jack Henry | | Technology | 165.22 | 48 | -0.76% | 1.11% |
| ZBRA | Zebra Technologies | | Technology | 276.26 | 68 | -0.11% | 1.07% |
| CRL | Charles River | | Health Care | 238.88 | 63 | -0.52% | 1.05% |
| FFIV | F5 Networks | | Technology | 180.81 | 32 | 0.32% | 1.02% |
| LUV | Southwest Airlines | | Transports | 29.17 | 55 | -0.98% | 1.00% |
| TPG | TPG | | Financials | 43.69 | 88 | -1.02% | 0.98% |
| SSNC | SS&C Technologies | | Technology | 61.59 | 45 | 1.00% | 0.79% |
| CNP | CenterPoint Energy | | Utilities | 28.78 | 86 | 0.17% | 0.74% |
| SPB | Spectrum | | Consumer Staples | 80.18 | 65 | -0.41% | 0.51% |
| MPWR | Monolithic Power | | Technology | 633.97 | 43 | 3.70% | 0.50% |
| SITE | SiteOne Landscape | | Industrials | 163.23 | 58 | 0.36% | 0.45% |
| HAYW | Hayward | | Industrials | 13.66 | 58 | -0.26% | 0.40% |
| For chart view version of above stock list: Chart View ➞ 0 - 25 , 25 - 50 , 50 - 75 , 75 - 100 , 100 - 125 , 125 - 150 , 150 - 175 , 175 - 200 , 200 - 225 , 225 - 250 , 250 - 275 , 275 - 300 , 300 - 325 , 325 - 350 , 350 - 375 , 375 - 400 , 400 - 425 , 425 - 450 , 450 - 475 , 475 - 500 , 500 - 525 , 525 - 550 , 550 - 575 , 575 - 600 , 600 - 625 , 625 - 650 , 650 - 675 , 675 - 700 | ||
 | Click To Change The Sort Order: By Market Cap or Company Size Performance: Year-to-date, Week and Day |  |
|
Get the most comprehensive stock market coverage daily at 12Stocks.com ➞ Best Stocks Today ➞ Best Stocks Weekly ➞ Best Stocks Year-to-Date ➞ Best Stocks Trends ➞  Best Stocks Today 12Stocks.com Best Nasdaq Stocks ➞ Best S&P 500 Stocks ➞ Best Tech Stocks ➞ Best Biotech Stocks ➞ |
| Detailed Overview of Midcap Stocks |
| Midcap Technical Overview, Leaders & Laggards, Top Midcap ETF Funds & Detailed Midcap Stocks List, Charts, Trends & More |
| Midcap: Technical Analysis, Trends & YTD Performance | |
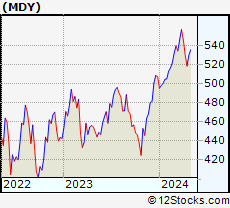
| MidCap segment as represented by
MDY, an exchange-traded fund [ETF], holds basket of about four hundred midcap stocks from across all major sectors of the US stock market. The midcap index (contains stocks like Green Mountain Coffee Roasters and Tractor Supply Company) is up by 4.06% and is currently underperforming the overall market by -1.28% year-to-date. Below is a quick view of technical charts and trends: | |
 MDY Weekly Chart |
|
| Long Term Trend: Very Good | |
| Medium Term Trend: Not Good | |
 MDY Daily Chart |
|
| Short Term Trend: Very Good | |
| Overall Trend Score: 63 | |
| YTD Performance: 4.06% | |
| **Trend Scores & Views Are Only For Educational Purposes And Not For Investing | |
| 12Stocks.com: Investing in Midcap Index using Exchange Traded Funds | |
|
The following table shows list of key exchange traded funds (ETF) that
help investors track Midcap index. The following list also includes leveraged ETF funds that track twice or thrice the daily returns of Midcap indices. Short or inverse ETF funds move in the opposite direction to the index they track and are useful during market pullbacks or during bear markets. Quick View: Move mouse or cursor over ETF symbol (ticker) to view short-term technical chart and over ETF name to view long term chart. Click on ticker or stock name for detailed view. Click on to add stock symbol to your watchlist and to view watchlist. |
12Stocks.com List of ETFs that track Midcap Index
| Ticker | ETF Name | Watchlist | Recent Price | Smart Investing & Trading Score | Change % | Week % | Year-to-date % |
| IJH | iShares Core S&P Mid-Cap | | 57.97 | 68 | 0.21 | 2.46 | 4.58% |
| MDY | SPDR S&P MidCap 400 ETF | | 527.96 | 63 | -0.35 | 1.87 | 4.06% |
| IWS | iShares Russell Mid-Cap Value | | 120.25 | 68 | 0.33 | 2.21 | 3.41% |
| UMDD | ProShares UltraPro MidCap400 | | 24.20 | 58 | 0.35 | 7.24 | 8.4% |
| SMDD | ProShares UltraPro Short MidCap400 | | 11.65 | 32 | -0.01 | -7.27 | -13.47% |
| MYY | ProShares Short MidCap400 | | 20.71 | 32 | -0.15 | -2.27 | -3.48% |
| MZZ | ProShares UltraShort MidCap400 | | 11.64 | 27 | -0.19 | -4.38 | -7.43% |
| 12Stocks.com: Charts, Trends, Fundamental Data and Performances of MidCap Stocks | |
|
We now take in-depth look at all MidCap stocks including charts, multi-period performances and overall trends (as measured by Smart Investing & Trading Score). One can sort MidCap stocks (click link to choose) by Daily, Weekly and by Year-to-Date performances. Also, one can sort by size of the company or by market capitalization. |
| Select Your Default Chart Type: | |||||
| |||||
| Click on stock symbol or name for detailed view. Click on to add stock symbol to your watchlist and to view watchlist. Quick View: Move mouse or cursor over "Daily" to quickly view daily technical stock chart and over "Weekly" to view weekly technical stock chart. | |||||

 | AVB AvalonBay Communities, Inc. |
| Sector: Financials | |
| SubSector: REIT - Residential | |
| MarketCap: 19921.9 Millions | |
| Recent Price: 190.49 Smart Investing & Trading Score: 93 | |
| Day Percent Change: 0.97% Day Change: 1.83 | |
| Week Change: 3.45% Year-to-date Change: 1.8% | |
| AVB Links: Profile News Message Board | |
| Charts:- Daily , Weekly | |
| Add AVB to Watchlist: View: Get Complete AVB Trend Analysis ➞ | |
 | AFL Aflac Incorporated |
| Sector: Financials | |
| SubSector: Accident & Health Insurance | |
| MarketCap: 22706 Millions | |
| Recent Price: 83.93 Smart Investing & Trading Score: 48 | |
| Day Percent Change: 0.21% Day Change: 0.18 | |
| Week Change: 0.84% Year-to-date Change: 1.7% | |
| AFL Links: Profile News Message Board | |
| Charts:- Daily , Weekly | |
| Add AFL to Watchlist: View: Get Complete AFL Trend Analysis ➞ | |
 | LSCC Lattice Semiconductor Corporation |
| Sector: Technology | |
| SubSector: Semiconductor - Specialized | |
| MarketCap: 2104 Millions | |
| Recent Price: 70.18 Smart Investing & Trading Score: 43 | |
| Day Percent Change: 3.25% Day Change: 2.21 | |
| Week Change: 5.52% Year-to-date Change: 1.7% | |
| LSCC Links: Profile News Message Board | |
| Charts:- Daily , Weekly | |
| Add LSCC to Watchlist: View: Get Complete LSCC Trend Analysis ➞ | |
 | ATO Atmos Energy Corporation |
| Sector: Utilities | |
| SubSector: Gas Utilities | |
| MarketCap: 11449 Millions | |
| Recent Price: 117.86 Smart Investing & Trading Score: 68 | |
| Day Percent Change: 0.16% Day Change: 0.19 | |
| Week Change: 0.56% Year-to-date Change: 1.7% | |
| ATO Links: Profile News Message Board | |
| Charts:- Daily , Weekly | |
| Add ATO to Watchlist: View: Get Complete ATO Trend Analysis ➞ | |
 | PCOR Procore Technologies, Inc. |
| Sector: Technology | |
| SubSector: Software - Application | |
| MarketCap: 9180 Millions | |
| Recent Price: 71.00 Smart Investing & Trading Score: 45 | |
| Day Percent Change: -1.02% Day Change: -0.73 | |
| Week Change: 1.01% Year-to-date Change: 1.6% | |
| PCOR Links: Profile News Message Board | |
| Charts:- Daily , Weekly | |
| Add PCOR to Watchlist: View: Get Complete PCOR Trend Analysis ➞ | |
 | ACM AECOM |
| Sector: Services & Goods | |
| SubSector: Technical Services | |
| MarketCap: 4781.9 Millions | |
| Recent Price: 93.77 Smart Investing & Trading Score: 61 | |
| Day Percent Change: -0.12% Day Change: -0.11 | |
| Week Change: 0.45% Year-to-date Change: 1.5% | |
| ACM Links: Profile News Message Board | |
| Charts:- Daily , Weekly | |
| Add ACM to Watchlist: View: Get Complete ACM Trend Analysis ➞ | |
 | CCCS CCC Intelligent Solutions Holdings Inc. |
| Sector: Technology | |
| SubSector: Software - Infrastructure | |
| MarketCap: 6990 Millions | |
| Recent Price: 11.51 Smart Investing & Trading Score: 51 | |
| Day Percent Change: 0.09% Day Change: 0.01 | |
| Week Change: 0.61% Year-to-date Change: 1.5% | |
| CCCS Links: Profile News Message Board | |
| Charts:- Daily , Weekly | |
| Add CCCS to Watchlist: View: Get Complete CCCS Trend Analysis ➞ | |
 | SRCL Stericycle, Inc. |
| Sector: Industrials | |
| SubSector: Waste Management | |
| MarketCap: 4285.78 Millions | |
| Recent Price: 50.26 Smart Investing & Trading Score: 65 | |
| Day Percent Change: -0.15% Day Change: -0.07 | |
| Week Change: 0.69% Year-to-date Change: 1.4% | |
| SRCL Links: Profile News Message Board | |
| Charts:- Daily , Weekly | |
| Add SRCL to Watchlist: View: Get Complete SRCL Trend Analysis ➞ | |
 | BYD Boyd Gaming Corporation |
| Sector: Services & Goods | |
| SubSector: Resorts & Casinos | |
| MarketCap: 1652.54 Millions | |
| Recent Price: 63.42 Smart Investing & Trading Score: 55 | |
| Day Percent Change: -0.28% Day Change: -0.18 | |
| Week Change: 1.21% Year-to-date Change: 1.3% | |
| BYD Links: Profile News Message Board | |
| Charts:- Daily , Weekly | |
| Add BYD to Watchlist: View: Get Complete BYD Trend Analysis ➞ | |
 | DRVN Driven Brands Holdings Inc. |
| Sector: Services & Goods | |
| SubSector: Auto & Truck Dealerships | |
| MarketCap: 4490 Millions | |
| Recent Price: 14.52 Smart Investing & Trading Score: 88 | |
| Day Percent Change: -3.49% Day Change: -0.53 | |
| Week Change: 2.91% Year-to-date Change: 1.2% | |
| DRVN Links: Profile News Message Board | |
| Charts:- Daily , Weekly | |
| Add DRVN to Watchlist: View: Get Complete DRVN Trend Analysis ➞ | |
 | RF Regions Financial Corporation |
| Sector: Financials | |
| SubSector: Regional - Southeast Banks | |
| MarketCap: 8936.25 Millions | |
| Recent Price: 19.60 Smart Investing & Trading Score: 68 | |
| Day Percent Change: 1.29% Day Change: 0.25 | |
| Week Change: 3.7% Year-to-date Change: 1.1% | |
| RF Links: Profile News Message Board | |
| Charts:- Daily , Weekly | |
| Add RF to Watchlist: View: Get Complete RF Trend Analysis ➞ | |
 | EQT EQT Corporation |
| Sector: Energy | |
| SubSector: Independent Oil & Gas | |
| MarketCap: 1886.63 Millions | |
| Recent Price: 39.10 Smart Investing & Trading Score: 100 | |
| Day Percent Change: 2.95% Day Change: 1.12 | |
| Week Change: 6.68% Year-to-date Change: 1.1% | |
| EQT Links: Profile News Message Board | |
| Charts:- Daily , Weekly | |
| Add EQT to Watchlist: View: Get Complete EQT Trend Analysis ➞ | |
 | SPR Spirit AeroSystems Holdings, Inc. |
| Sector: Industrials | |
| SubSector: Aerospace/Defense Products & Services | |
| MarketCap: 2283.01 Millions | |
| Recent Price: 32.14 Smart Investing & Trading Score: 53 | |
| Day Percent Change: 0.03% Day Change: 0.01 | |
| Week Change: -2.4% Year-to-date Change: 1.1% | |
| SPR Links: Profile News Message Board | |
| Charts:- Daily , Weekly | |
| Add SPR to Watchlist: View: Get Complete SPR Trend Analysis ➞ | |
 | JKHY Jack Henry & Associates, Inc. |
| Sector: Technology | |
| SubSector: Information Technology Services | |
| MarketCap: 10695.4 Millions | |
| Recent Price: 165.22 Smart Investing & Trading Score: 48 | |
| Day Percent Change: -0.76% Day Change: -1.26 | |
| Week Change: -0.23% Year-to-date Change: 1.1% | |
| JKHY Links: Profile News Message Board | |
| Charts:- Daily , Weekly | |
| Add JKHY to Watchlist: View: Get Complete JKHY Trend Analysis ➞ | |
 | ZBRA Zebra Technologies Corporation |
| Sector: Technology | |
| SubSector: Communication Equipment | |
| MarketCap: 11474.9 Millions | |
| Recent Price: 276.26 Smart Investing & Trading Score: 68 | |
| Day Percent Change: -0.11% Day Change: -0.31 | |
| Week Change: 3.05% Year-to-date Change: 1.1% | |
| ZBRA Links: Profile News Message Board | |
| Charts:- Daily , Weekly | |
| Add ZBRA to Watchlist: View: Get Complete ZBRA Trend Analysis ➞ | |
 | CRL Charles River Laboratories International, Inc. |
| Sector: Health Care | |
| SubSector: Medical Laboratories & Research | |
| MarketCap: 5700.5 Millions | |
| Recent Price: 238.88 Smart Investing & Trading Score: 63 | |
| Day Percent Change: -0.52% Day Change: -1.25 | |
| Week Change: 5.34% Year-to-date Change: 1.1% | |
| CRL Links: Profile News Message Board | |
| Charts:- Daily , Weekly | |
| Add CRL to Watchlist: View: Get Complete CRL Trend Analysis ➞ | |
 | FFIV F5 Networks, Inc. |
| Sector: Technology | |
| SubSector: Business Software & Services | |
| MarketCap: 6675.38 Millions | |
| Recent Price: 180.81 Smart Investing & Trading Score: 32 | |
| Day Percent Change: 0.32% Day Change: 0.58 | |
| Week Change: 1.96% Year-to-date Change: 1.0% | |
| FFIV Links: Profile News Message Board | |
| Charts:- Daily , Weekly | |
| Add FFIV to Watchlist: View: Get Complete FFIV Trend Analysis ➞ | |
 | LUV Southwest Airlines Co. |
| Sector: Transports | |
| SubSector: Regional Airlines | |
| MarketCap: 19463.3 Millions | |
| Recent Price: 29.17 Smart Investing & Trading Score: 55 | |
| Day Percent Change: -0.98% Day Change: -0.29 | |
| Week Change: -0.71% Year-to-date Change: 1.0% | |
| LUV Links: Profile News Message Board | |
| Charts:- Daily , Weekly | |
| Add LUV to Watchlist: View: Get Complete LUV Trend Analysis ➞ | |
 | TPG TPG Inc. |
| Sector: Financials | |
| SubSector: Asset Management | |
| MarketCap: 8700 Millions | |
| Recent Price: 43.69 Smart Investing & Trading Score: 88 | |
| Day Percent Change: -1.02% Day Change: -0.45 | |
| Week Change: 2.85% Year-to-date Change: 1.0% | |
| TPG Links: Profile News Message Board | |
| Charts:- Daily , Weekly | |
| Add TPG to Watchlist: View: Get Complete TPG Trend Analysis ➞ | |
 | SSNC SS&C Technologies Holdings, Inc. |
| Sector: Technology | |
| SubSector: Business Software & Services | |
| MarketCap: 9884.08 Millions | |
| Recent Price: 61.59 Smart Investing & Trading Score: 45 | |
| Day Percent Change: 1.00% Day Change: 0.61 | |
| Week Change: 1.27% Year-to-date Change: 0.8% | |
| SSNC Links: Profile News Message Board | |
| Charts:- Daily , Weekly | |
| Add SSNC to Watchlist: View: Get Complete SSNC Trend Analysis ➞ | |
 | CNP CenterPoint Energy, Inc. |
| Sector: Utilities | |
| SubSector: Gas Utilities | |
| MarketCap: 7444.07 Millions | |
| Recent Price: 28.78 Smart Investing & Trading Score: 86 | |
| Day Percent Change: 0.17% Day Change: 0.05 | |
| Week Change: 0.88% Year-to-date Change: 0.7% | |
| CNP Links: Profile News Message Board | |
| Charts:- Daily , Weekly | |
| Add CNP to Watchlist: View: Get Complete CNP Trend Analysis ➞ | |
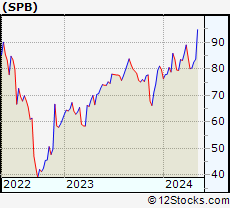 | SPB Spectrum Brands Holdings, Inc. |
| Sector: Consumer Staples | |
| SubSector: Personal Products | |
| MarketCap: 1460.85 Millions | |
| Recent Price: 80.18 Smart Investing & Trading Score: 65 | |
| Day Percent Change: -0.41% Day Change: -0.33 | |
| Week Change: -0.24% Year-to-date Change: 0.5% | |
| SPB Links: Profile News Message Board | |
| Charts:- Daily , Weekly | |
| Add SPB to Watchlist: View: Get Complete SPB Trend Analysis ➞ | |
 | MPWR Monolithic Power Systems, Inc. |
| Sector: Technology | |
| SubSector: Semiconductor - Specialized | |
| MarketCap: 6436.4 Millions | |
| Recent Price: 633.97 Smart Investing & Trading Score: 43 | |
| Day Percent Change: 3.70% Day Change: 22.60 | |
| Week Change: 7.18% Year-to-date Change: 0.5% | |
| MPWR Links: Profile News Message Board | |
| Charts:- Daily , Weekly | |
| Add MPWR to Watchlist: View: Get Complete MPWR Trend Analysis ➞ | |
 | SITE SiteOne Landscape Supply, Inc. |
| Sector: Industrials | |
| SubSector: Small Tools & Accessories | |
| MarketCap: 2733.56 Millions | |
| Recent Price: 163.23 Smart Investing & Trading Score: 58 | |
| Day Percent Change: 0.36% Day Change: 0.58 | |
| Week Change: 4.67% Year-to-date Change: 0.5% | |
| SITE Links: Profile News Message Board | |
| Charts:- Daily , Weekly | |
| Add SITE to Watchlist: View: Get Complete SITE Trend Analysis ➞ | |
 | HAYW Hayward Holdings, Inc. |
| Sector: Industrials | |
| SubSector: Electrical Equipment & Parts | |
| MarketCap: 2670 Millions | |
| Recent Price: 13.66 Smart Investing & Trading Score: 58 | |
| Day Percent Change: -0.26% Day Change: -0.04 | |
| Week Change: 3.44% Year-to-date Change: 0.4% | |
| HAYW Links: Profile News Message Board | |
| Charts:- Daily , Weekly | |
| Add HAYW to Watchlist: View: Get Complete HAYW Trend Analysis ➞ | |
| For tabular summary view of above stock list: Summary View ➞ 0 - 25 , 25 - 50 , 50 - 75 , 75 - 100 , 100 - 125 , 125 - 150 , 150 - 175 , 175 - 200 , 200 - 225 , 225 - 250 , 250 - 275 , 275 - 300 , 300 - 325 , 325 - 350 , 350 - 375 , 375 - 400 , 400 - 425 , 425 - 450 , 450 - 475 , 475 - 500 , 500 - 525 , 525 - 550 , 550 - 575 , 575 - 600 , 600 - 625 , 625 - 650 , 650 - 675 , 675 - 700 | ||
| Click To Change The Sort Order: By Market Cap or Company Size Performance: Year-to-date, Week and Day | |
| Select Chart Type: | ||
|
Best Stocks Today 12Stocks.com |
© 2024 12Stocks.com Terms & Conditions Privacy Contact Us
All Information Provided Only For Education And Not To Be Used For Investing or Trading. See Terms & Conditions


One More Thing ... Get Best Stocks Delivered Daily!
Never Ever Miss A Move With Our Top Ten Stocks Lists
Find Best Stocks In Any Market - Bull or Bear Market
Take A Peek At Our Top Ten Stocks Lists: Daily, Weekly, Year-to-Date & Top Trends
Find Best Stocks In Any Market - Bull or Bear Market
Take A Peek At Our Top Ten Stocks Lists: Daily, Weekly, Year-to-Date & Top Trends
Midcap Stocks With Best Up Trends [0-bearish to 100-bullish]: Hasbro [100], Wabtec [100], Allegro Micro[100], Microchip [100], Mattel [100], Crane Co[100], EQT [100], Synchrony Financial[100], East West[100], Arrow Electronics[100], Equity Residential[100]
Best Midcap Stocks Year-to-Date:
AppLovin [74.52%], Constellation Energy[59.4%], EMCOR [58.22%], Natera [48%], Pure Storage[43.77%], Wingstop [41.26%], Williams-Sonoma [41.06%], NRG Energy[40.19%], DICK S[39.95%], CAVA [39.66%], Interactive Brokers[39.05%] Best Midcap Stocks This Week:
HashiCorp [23.7%], Hasbro [18.51%], Tandem Diabetes[13.34%], Wabtec [12.21%], Ryder System[11.45%], Watsco [10.38%], Microchip [10%], Crane Co[9.97%], Coinbase Global[9.74%], Natera [8.71%], GitLab [8.6%] Best Midcap Stocks Daily:
Hasbro [12.66%], Wabtec [8.95%], CoStar [7.62%], Allegro Micro[6.66%], Watsco [5.94%], ON Semiconductor[5.52%], Hilton Worldwide[5.33%], Virtu Financial[5.29%], Kemper [5.19%], Biogen [4.77%], Olaplex [4.38%]