
 Login Sign Up


| |||||
 |  | ||||

| 12Stocks.com Market Intelligence |
Best MidCap Stocks
|
| In a hurry? Mid Cap Stocks Lists: Performance Trends Table, Stock Charts
Sort midcap stocks: Daily, Weekly, Year-to-Date, Market Cap & Trends. Filter midcap stocks list by sector: Show all, Tech, Finance, Energy, Staples, Retail, Industrial, Materials, Utilities and HealthCare Filter midcap stocks list by size:All MidCap Large Mid-Range Small |
| 12Stocks.com Mid Cap Stocks Performances & Trends Daily | |||||||||
|
|  The overall Smart Investing & Trading Score is 63 (0-bearish to 100-bullish) which puts Mid Cap index in short term neutral to bullish trend. The Smart Investing & Trading Score from previous trading session is 44 and hence an improvement of trend.
| ||||||||
Here are the Smart Investing & Trading Scores of the most requested mid cap stocks at 12Stocks.com (click stock name for detailed review):
|


| 12Stocks.com: Top Performing Mid Cap Index Stocks | ||||||||||||||||||||||||||||||||||||||||||||||||
 The top performing Mid Cap Index stocks year to date are
Now, more recently, over last week, the top performing Mid Cap Index stocks on the move are


|
||||||||||||||||||||||||||||||||||||||||||||||||
| 12Stocks.com: Investing in Midcap Index with Stocks | |
|
The following table helps investors and traders sort through current performance and trends (as measured by Smart Investing & Trading Score) of various
stocks in the Midcap Index. Quick View: Move mouse or cursor over stock symbol (ticker) to view short-term technical chart and over stock name to view long term chart. Click on  to add stock symbol to your watchlist and to add stock symbol to your watchlist and  to view watchlist. Click on any ticker or stock name for detailed market intelligence report for that stock. to view watchlist. Click on any ticker or stock name for detailed market intelligence report for that stock. |
12Stocks.com Performance of Stocks in Midcap Index
| Ticker | Stock Name | Watchlist | Category | Recent Price | Smart Investing & Trading Score | Change % | YTD Change% |
| AXON | Axovant Sciences |   | Health Care | 293.80 | 36 | 0.07% | 13.73% |
| GWW | W.W. Grainger | | Services & Goods | 942.07 | 43 | -0.06% | 13.68% |
| ATR | Aptar | | Consumer Staples | 140.32 | 65 | 0.70% | 13.51% |
| ASH | Ashland Global | | Materials | 95.67 | 90 | -0.33% | 13.47% |
| CRWD | CrowdStrike | | Technology | 289.15 | 10 | 2.30% | 13.25% |
| SWN | Southwestern Energy | | Energy | 7.40 | 68 | 1.51% | 12.98% |
| APH | Amphenol | | Technology | 111.86 | 56 | 1.53% | 12.84% |
| XYL | Xylem | | Industrials | 128.98 | 83 | 0.89% | 12.78% |
| TSN | Tyson Foods | | Consumer Staples | 60.61 | 95 | 1.10% | 12.76% |
| DFS | Discover Financial | | Financials | 126.68 | 83 | 1.06% | 12.70% |
| RCM | R1 RCM | | Technology | 11.91 | 53 | -0.58% | 12.68% |
| CW | Curtiss-Wright | | Industrials | 250.95 | 56 | 0.28% | 12.64% |
| RJF | Raymond James | | Financials | 125.48 | 75 | 1.52% | 12.54% |
| MRVI | Maravai LifeSciences | | Health Care | 7.37 | 43 | 0.14% | 12.52% |
| H | Hyatt Hotels | | Services & Goods | 146.58 | 36 | 0.14% | 12.40% |
| BFAM | Bright Horizons | | Services & Goods | 105.87 | 58 | 1.36% | 12.34% |
| RL | Ralph Lauren | | Consumer Staples | 161.97 | 58 | 2.22% | 12.32% |
| AXS | AXIS Capital | | Financials | 62.18 | 70 | -0.46% | 12.30% |
| EVR | Evercore | | Financials | 192.08 | 71 | 3.07% | 12.29% |
| VMC | Vulcan Materials | | Industrials | 254.48 | 36 | 0.96% | 12.10% |
| CHD | Church & Dwight Co | | Consumer Staples | 105.95 | 100 | 1.53% | 12.05% |
| CLH | Clean Harbors | | Industrials | 195.45 | 63 | 0.90% | 12.00% |
| TW | Tradeweb Markets | | Services & Goods | 101.62 | 58 | 0.58% | 11.82% |
| BAH | Booz Allen | | Services & Goods | 143.01 | 58 | 0.61% | 11.81% |
| AM | Antero Midstream | | Energy | 14.00 | 75 | 0.57% | 11.73% |
| For chart view version of above stock list: Chart View ➞ 0 - 25 , 25 - 50 , 50 - 75 , 75 - 100 , 100 - 125 , 125 - 150 , 150 - 175 , 175 - 200 , 200 - 225 , 225 - 250 , 250 - 275 , 275 - 300 , 300 - 325 , 325 - 350 , 350 - 375 , 375 - 400 , 400 - 425 , 425 - 450 , 450 - 475 , 475 - 500 , 500 - 525 , 525 - 550 , 550 - 575 , 575 - 600 , 600 - 625 , 625 - 650 , 650 - 675 , 675 - 700 , 700 - 725 , 725 - 750 , 750 - 775 | ||
 | Click To Change The Sort Order: By Market Cap or Company Size Performance: Year-to-date, Week and Day |  |
|
Get the most comprehensive stock market coverage daily at 12Stocks.com ➞ Best Stocks Today ➞ Best Stocks Weekly ➞ Best Stocks Year-to-Date ➞ Best Stocks Trends ➞  Best Stocks Today 12Stocks.com Best Nasdaq Stocks ➞ Best S&P 500 Stocks ➞ Best Tech Stocks ➞ Best Biotech Stocks ➞ |
| Detailed Overview of Midcap Stocks |
| Midcap Technical Overview, Leaders & Laggards, Top Midcap ETF Funds & Detailed Midcap Stocks List, Charts, Trends & More |
| Midcap: Technical Analysis, Trends & YTD Performance | |
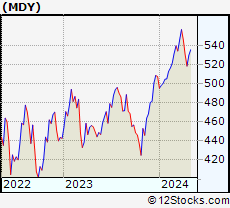
| MidCap segment as represented by
MDY, an exchange-traded fund [ETF], holds basket of about four hundred midcap stocks from across all major sectors of the US stock market. The midcap index (contains stocks like Green Mountain Coffee Roasters and Tractor Supply Company) is up by 3.18% and is currently underperforming the overall market by -1.21% year-to-date. Below is a quick view of technical charts and trends: | |
 MDY Weekly Chart |
|
| Long Term Trend: Good | |
| Medium Term Trend: Not Good | |
 MDY Daily Chart |
|
| Short Term Trend: Very Good | |
| Overall Trend Score: 63 | |
| YTD Performance: 3.18% | |
| **Trend Scores & Views Are Only For Educational Purposes And Not For Investing | |
| 12Stocks.com: Investing in Midcap Index using Exchange Traded Funds | |
|
The following table shows list of key exchange traded funds (ETF) that
help investors track Midcap index. The following list also includes leveraged ETF funds that track twice or thrice the daily returns of Midcap indices. Short or inverse ETF funds move in the opposite direction to the index they track and are useful during market pullbacks or during bear markets. Quick View: Move mouse or cursor over ETF symbol (ticker) to view short-term technical chart and over ETF name to view long term chart. Click on ticker or stock name for detailed view. Click on to add stock symbol to your watchlist and to view watchlist. |
12Stocks.com List of ETFs that track Midcap Index
| Ticker | ETF Name | Watchlist | Recent Price | Smart Investing & Trading Score | Change % | Week % | Year-to-date % |
| IWS | iShares Russell Mid-Cap Value | | 118.80 | 68 | 0.98 | 0.98 | 2.16% |
| IWP | iShares Russell Mid-Cap Growth | | 106.71 | 51 | 0.96 | 0.96 | 2.15% |
| IWR | iShares Russell Mid-Cap | | 79.38 | 56 | 0.92 | 0.92 | 2.12% |
| IJH | iShares Core S&P Mid-Cap | | 56.81 | 56 | 0.42 | 0.42 | 2.5% |
| MDY | SPDR S&P MidCap 400 ETF | | 523.50 | 63 | 1.01 | 1.01 | 3.18% |
| IJK | iShares S&P Mid-Cap 400 Growth | | 85.58 | 56 | 0.86 | 0.86 | 8.03% |
| IJJ | iShares S&P Mid-Cap 400 Value | | 111.54 | 63 | 0.90 | 0.9 | -2.19% |
| MYY | ProShares Short MidCap400 | | 20.97 | 32 | -1.04 | -1.04 | -2.26% |
| XMLV | PowerShares S&P MidCap Low Volatil ETF | | 54.54 | 75 | 0.70 | 0.7 | 2.56% |
| MZZ | ProShares UltraShort MidCap400 | | 11.96 | 27 | -1.73 | -1.73 | -4.86% |
| SMDD | ProShares UltraPro Short MidCap400 | | 12.11 | 32 | -3.60 | -3.6 | -10.05% |
| UMDD | ProShares UltraPro MidCap400 | | 23.17 | 63 | 2.69 | 2.69 | 3.81% |
| MVV | ProShares Ultra MidCap400 | | 60.29 | 63 | 2.19 | 2.19 | 4.15% |
| 12Stocks.com: Charts, Trends, Fundamental Data and Performances of MidCap Stocks | |
|
We now take in-depth look at all MidCap stocks including charts, multi-period performances and overall trends (as measured by Smart Investing & Trading Score). One can sort MidCap stocks (click link to choose) by Daily, Weekly and by Year-to-Date performances. Also, one can sort by size of the company or by market capitalization. |
| Select Your Default Chart Type: | |||||
| |||||
| Click on stock symbol or name for detailed view. Click on to add stock symbol to your watchlist and to view watchlist. Quick View: Move mouse or cursor over "Daily" to quickly view daily technical stock chart and over "Weekly" to view weekly technical stock chart. | |||||

 | AXON Axovant Sciences Ltd. |
| Sector: Health Care | |
| SubSector: Biotechnology | |
| MarketCap: 1492.04 Millions | |
| Recent Price: 293.80 Smart Investing & Trading Score: 36 | |
| Day Percent Change: 0.07% Day Change: 0.19 | |
| Week Change: 0.07% Year-to-date Change: 13.7% | |
| AXON Links: Profile News Message Board | |
| Charts:- Daily , Weekly | |
| Add AXON to Watchlist: View: Get Complete AXON Trend Analysis ➞ | |
 | GWW W.W. Grainger, Inc. |
| Sector: Services & Goods | |
| SubSector: Industrial Equipment Wholesale | |
| MarketCap: 12794.8 Millions | |
| Recent Price: 942.07 Smart Investing & Trading Score: 43 | |
| Day Percent Change: -0.06% Day Change: -0.58 | |
| Week Change: -0.06% Year-to-date Change: 13.7% | |
| GWW Links: Profile News Message Board | |
| Charts:- Daily , Weekly | |
| Add GWW to Watchlist: View: Get Complete GWW Trend Analysis ➞ | |
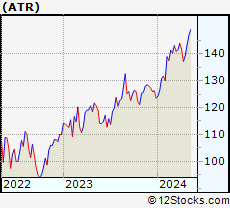 | ATR AptarGroup, Inc. |
| Sector: Consumer Staples | |
| SubSector: Packaging & Containers | |
| MarketCap: 6219.43 Millions | |
| Recent Price: 140.32 Smart Investing & Trading Score: 65 | |
| Day Percent Change: 0.70% Day Change: 0.98 | |
| Week Change: 0.7% Year-to-date Change: 13.5% | |
| ATR Links: Profile News Message Board | |
| Charts:- Daily , Weekly | |
| Add ATR to Watchlist: View: Get Complete ATR Trend Analysis ➞ | |
 | ASH Ashland Global Holdings Inc. |
| Sector: Materials | |
| SubSector: Chemicals - Major Diversified | |
| MarketCap: 2764.16 Millions | |
| Recent Price: 95.67 Smart Investing & Trading Score: 90 | |
| Day Percent Change: -0.33% Day Change: -0.32 | |
| Week Change: -0.33% Year-to-date Change: 13.5% | |
| ASH Links: Profile News Message Board | |
| Charts:- Daily , Weekly | |
| Add ASH to Watchlist: View: Get Complete ASH Trend Analysis ➞ | |
 | CRWD CrowdStrike Holdings, Inc. |
| Sector: Technology | |
| SubSector: Security Software & Services | |
| MarketCap: 11803.6 Millions | |
| Recent Price: 289.15 Smart Investing & Trading Score: 10 | |
| Day Percent Change: 2.30% Day Change: 6.50 | |
| Week Change: 2.3% Year-to-date Change: 13.3% | |
| CRWD Links: Profile News Message Board | |
| Charts:- Daily , Weekly | |
| Add CRWD to Watchlist: View: Get Complete CRWD Trend Analysis ➞ | |
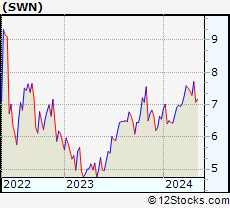 | SWN Southwestern Energy Company |
| Sector: Energy | |
| SubSector: Independent Oil & Gas | |
| MarketCap: 1122.03 Millions | |
| Recent Price: 7.40 Smart Investing & Trading Score: 68 | |
| Day Percent Change: 1.51% Day Change: 0.11 | |
| Week Change: 1.51% Year-to-date Change: 13.0% | |
| SWN Links: Profile News Message Board | |
| Charts:- Daily , Weekly | |
| Add SWN to Watchlist: View: Get Complete SWN Trend Analysis ➞ | |
 | APH Amphenol Corporation |
| Sector: Technology | |
| SubSector: Diversified Electronics | |
| MarketCap: 23422 Millions | |
| Recent Price: 111.86 Smart Investing & Trading Score: 56 | |
| Day Percent Change: 1.53% Day Change: 1.69 | |
| Week Change: 1.53% Year-to-date Change: 12.8% | |
| APH Links: Profile News Message Board | |
| Charts:- Daily , Weekly | |
| Add APH to Watchlist: View: Get Complete APH Trend Analysis ➞ | |
 | XYL Xylem Inc. |
| Sector: Industrials | |
| SubSector: Diversified Machinery | |
| MarketCap: 12195.1 Millions | |
| Recent Price: 128.98 Smart Investing & Trading Score: 83 | |
| Day Percent Change: 0.89% Day Change: 1.14 | |
| Week Change: 0.89% Year-to-date Change: 12.8% | |
| XYL Links: Profile News Message Board | |
| Charts:- Daily , Weekly | |
| Add XYL to Watchlist: View: Get Complete XYL Trend Analysis ➞ | |
 | TSN Tyson Foods, Inc. |
| Sector: Consumer Staples | |
| SubSector: Meat Products | |
| MarketCap: 22124.1 Millions | |
| Recent Price: 60.61 Smart Investing & Trading Score: 95 | |
| Day Percent Change: 1.10% Day Change: 0.66 | |
| Week Change: 1.1% Year-to-date Change: 12.8% | |
| TSN Links: Profile News Message Board | |
| Charts:- Daily , Weekly | |
| Add TSN to Watchlist: View: Get Complete TSN Trend Analysis ➞ | |
 | DFS Discover Financial Services |
| Sector: Financials | |
| SubSector: Credit Services | |
| MarketCap: 9228.88 Millions | |
| Recent Price: 126.68 Smart Investing & Trading Score: 83 | |
| Day Percent Change: 1.06% Day Change: 1.33 | |
| Week Change: 1.06% Year-to-date Change: 12.7% | |
| DFS Links: Profile News Message Board | |
| Charts:- Daily , Weekly | |
| Add DFS to Watchlist: View: Get Complete DFS Trend Analysis ➞ | |
 | RCM R1 RCM Inc. |
| Sector: Technology | |
| SubSector: Healthcare Information Services | |
| MarketCap: 1082.15 Millions | |
| Recent Price: 11.91 Smart Investing & Trading Score: 53 | |
| Day Percent Change: -0.58% Day Change: -0.07 | |
| Week Change: -0.58% Year-to-date Change: 12.7% | |
| RCM Links: Profile News Message Board | |
| Charts:- Daily , Weekly | |
| Add RCM to Watchlist: View: Get Complete RCM Trend Analysis ➞ | |
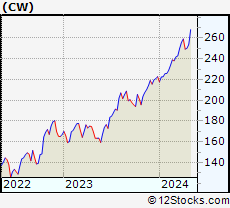 | CW Curtiss-Wright Corporation |
| Sector: Industrials | |
| SubSector: Diversified Machinery | |
| MarketCap: 4057.56 Millions | |
| Recent Price: 250.95 Smart Investing & Trading Score: 56 | |
| Day Percent Change: 0.28% Day Change: 0.71 | |
| Week Change: 0.28% Year-to-date Change: 12.6% | |
| CW Links: Profile News Message Board | |
| Charts:- Daily , Weekly | |
| Add CW to Watchlist: View: Get Complete CW Trend Analysis ➞ | |
 | RJF Raymond James Financial, Inc. |
| Sector: Financials | |
| SubSector: Investment Brokerage - Regional | |
| MarketCap: 9490.65 Millions | |
| Recent Price: 125.48 Smart Investing & Trading Score: 75 | |
| Day Percent Change: 1.52% Day Change: 1.88 | |
| Week Change: 1.52% Year-to-date Change: 12.5% | |
| RJF Links: Profile News Message Board | |
| Charts:- Daily , Weekly | |
| Add RJF to Watchlist: View: Get Complete RJF Trend Analysis ➞ | |
 | MRVI Maravai LifeSciences Holdings, Inc. |
| Sector: Health Care | |
| SubSector: Biotechnology | |
| MarketCap: 67887 Millions | |
| Recent Price: 7.37 Smart Investing & Trading Score: 43 | |
| Day Percent Change: 0.14% Day Change: 0.01 | |
| Week Change: 0.14% Year-to-date Change: 12.5% | |
| MRVI Links: Profile News Message Board | |
| Charts:- Daily , Weekly | |
| Add MRVI to Watchlist: View: Get Complete MRVI Trend Analysis ➞ | |
 | H Hyatt Hotels Corporation |
| Sector: Services & Goods | |
| SubSector: Lodging | |
| MarketCap: 5525.56 Millions | |
| Recent Price: 146.58 Smart Investing & Trading Score: 36 | |
| Day Percent Change: 0.14% Day Change: 0.21 | |
| Week Change: 0.14% Year-to-date Change: 12.4% | |
| H Links: Profile News Message Board | |
| Charts:- Daily , Weekly | |
| Add H to Watchlist: View: Get Complete H Trend Analysis ➞ | |
 | BFAM Bright Horizons Family Solutions Inc. |
| Sector: Services & Goods | |
| SubSector: Personal Services | |
| MarketCap: 5487.65 Millions | |
| Recent Price: 105.87 Smart Investing & Trading Score: 58 | |
| Day Percent Change: 1.36% Day Change: 1.42 | |
| Week Change: 1.36% Year-to-date Change: 12.3% | |
| BFAM Links: Profile News Message Board | |
| Charts:- Daily , Weekly | |
| Add BFAM to Watchlist: View: Get Complete BFAM Trend Analysis ➞ | |
 | RL Ralph Lauren Corporation |
| Sector: Consumer Staples | |
| SubSector: Textile - Apparel Clothing | |
| MarketCap: 5589.95 Millions | |
| Recent Price: 161.97 Smart Investing & Trading Score: 58 | |
| Day Percent Change: 2.22% Day Change: 3.51 | |
| Week Change: 2.22% Year-to-date Change: 12.3% | |
| RL Links: Profile News Message Board | |
| Charts:- Daily , Weekly | |
| Add RL to Watchlist: View: Get Complete RL Trend Analysis ➞ | |
 | AXS AXIS Capital Holdings Limited |
| Sector: Financials | |
| SubSector: Property & Casualty Insurance | |
| MarketCap: 3709.12 Millions | |
| Recent Price: 62.18 Smart Investing & Trading Score: 70 | |
| Day Percent Change: -0.46% Day Change: -0.29 | |
| Week Change: -0.46% Year-to-date Change: 12.3% | |
| AXS Links: Profile News Message Board | |
| Charts:- Daily , Weekly | |
| Add AXS to Watchlist: View: Get Complete AXS Trend Analysis ➞ | |
 | EVR Evercore Inc. |
| Sector: Financials | |
| SubSector: Asset Management | |
| MarketCap: 1989.83 Millions | |
| Recent Price: 192.08 Smart Investing & Trading Score: 71 | |
| Day Percent Change: 3.07% Day Change: 5.72 | |
| Week Change: 3.07% Year-to-date Change: 12.3% | |
| EVR Links: Profile News Message Board | |
| Charts:- Daily , Weekly | |
| Add EVR to Watchlist: View: Get Complete EVR Trend Analysis ➞ | |
 | VMC Vulcan Materials Company |
| Sector: Industrials | |
| SubSector: General Building Materials | |
| MarketCap: 12304.7 Millions | |
| Recent Price: 254.48 Smart Investing & Trading Score: 36 | |
| Day Percent Change: 0.96% Day Change: 2.42 | |
| Week Change: 0.96% Year-to-date Change: 12.1% | |
| VMC Links: Profile News Message Board | |
| Charts:- Daily , Weekly | |
| Add VMC to Watchlist: View: Get Complete VMC Trend Analysis ➞ | |
 | CHD Church & Dwight Co., Inc. |
| Sector: Consumer Staples | |
| SubSector: Cleaning Products | |
| MarketCap: 17425.7 Millions | |
| Recent Price: 105.95 Smart Investing & Trading Score: 100 | |
| Day Percent Change: 1.53% Day Change: 1.60 | |
| Week Change: 1.53% Year-to-date Change: 12.1% | |
| CHD Links: Profile News Message Board | |
| Charts:- Daily , Weekly | |
| Add CHD to Watchlist: View: Get Complete CHD Trend Analysis ➞ | |
 | CLH Clean Harbors, Inc. |
| Sector: Industrials | |
| SubSector: Waste Management | |
| MarketCap: 2391.28 Millions | |
| Recent Price: 195.45 Smart Investing & Trading Score: 63 | |
| Day Percent Change: 0.90% Day Change: 1.74 | |
| Week Change: 0.9% Year-to-date Change: 12.0% | |
| CLH Links: Profile News Message Board | |
| Charts:- Daily , Weekly | |
| Add CLH to Watchlist: View: Get Complete CLH Trend Analysis ➞ | |
 | TW Tradeweb Markets Inc. |
| Sector: Services & Goods | |
| SubSector: Management Services | |
| MarketCap: 9913.35 Millions | |
| Recent Price: 101.62 Smart Investing & Trading Score: 58 | |
| Day Percent Change: 0.58% Day Change: 0.59 | |
| Week Change: 0.58% Year-to-date Change: 11.8% | |
| TW Links: Profile News Message Board | |
| Charts:- Daily , Weekly | |
| Add TW to Watchlist: View: Get Complete TW Trend Analysis ➞ | |
 | BAH Booz Allen Hamilton Holding Corporation |
| Sector: Services & Goods | |
| SubSector: Management Services | |
| MarketCap: 9037.35 Millions | |
| Recent Price: 143.01 Smart Investing & Trading Score: 58 | |
| Day Percent Change: 0.61% Day Change: 0.87 | |
| Week Change: 0.61% Year-to-date Change: 11.8% | |
| BAH Links: Profile News Message Board | |
| Charts:- Daily , Weekly | |
| Add BAH to Watchlist: View: Get Complete BAH Trend Analysis ➞ | |
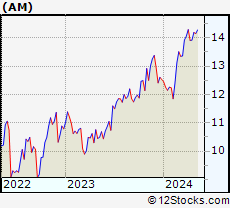 | AM Antero Midstream Corporation |
| Sector: Energy | |
| SubSector: Oil & Gas Pipelines | |
| MarketCap: 1195.35 Millions | |
| Recent Price: 14.00 Smart Investing & Trading Score: 75 | |
| Day Percent Change: 0.57% Day Change: 0.08 | |
| Week Change: 0.57% Year-to-date Change: 11.7% | |
| AM Links: Profile News Message Board | |
| Charts:- Daily , Weekly | |
| Add AM to Watchlist: View: Get Complete AM Trend Analysis ➞ | |
| For tabular summary view of above stock list: Summary View ➞ 0 - 25 , 25 - 50 , 50 - 75 , 75 - 100 , 100 - 125 , 125 - 150 , 150 - 175 , 175 - 200 , 200 - 225 , 225 - 250 , 250 - 275 , 275 - 300 , 300 - 325 , 325 - 350 , 350 - 375 , 375 - 400 , 400 - 425 , 425 - 450 , 450 - 475 , 475 - 500 , 500 - 525 , 525 - 550 , 550 - 575 , 575 - 600 , 600 - 625 , 625 - 650 , 650 - 675 , 675 - 700 , 700 - 725 , 725 - 750 , 750 - 775 | ||
| Click To Change The Sort Order: By Market Cap or Company Size Performance: Year-to-date, Week and Day | |
| Select Chart Type: | ||
|
Best Stocks Today 12Stocks.com |
© 2024 12Stocks.com Terms & Conditions Privacy Contact Us
All Information Provided Only For Education And Not To Be Used For Investing or Trading. See Terms & Conditions


One More Thing ... Get Best Stocks Delivered Daily!
Never Ever Miss A Move With Our Top Ten Stocks Lists
Find Best Stocks In Any Market - Bull or Bear Market
Take A Peek At Our Top Ten Stocks Lists: Daily, Weekly, Year-to-Date & Top Trends
Find Best Stocks In Any Market - Bull or Bear Market
Take A Peek At Our Top Ten Stocks Lists: Daily, Weekly, Year-to-Date & Top Trends
Midcap Stocks With Best Up Trends [0-bearish to 100-bullish]: United Airlines[100], EQT [100], Wendy s[100], Bentley [100], Campbell Soup[100], Commerce Bancshares[100], Grocery Outlet[100], Ally Financial[100], Hanover Insurance[100], UDR [100], M&T Bank[100]
Best Midcap Stocks Year-to-Date:
Vistra Energy[73.21%], ShockWave Medical[72.44%], AppLovin [70.55%], Constellation Energy[56.45%], EMCOR [54.38%], Spotify [44.88%], Pure Storage[41.64%], Natera [41.46%], Williams-Sonoma [38.87%], Coupang [38.64%], Kinsale Capital[38.31%] Best Midcap Stocks This Week:
AMC Entertainment[8.23%], Coinbase Global[7.07%], Kohl s[6.51%], New York[5.76%], United Airlines[4.98%], Tandem Diabetes[4.37%], Crocs [4.02%], Ardagh Metal[4.01%], MongoDB [3.92%], Natera [3.9%], Enphase Energy[3.78%] Best Midcap Stocks Daily:
AMC Entertainment[8.23%], Coinbase Global[7.07%], Kohl s[6.51%], New York[5.76%], United Airlines[4.98%], Tandem Diabetes[4.37%], Crocs [4.02%], Ardagh Metal[4.01%], MongoDB [3.92%], Natera [3.90%], Enphase Energy[3.78%]