
 Login Sign Up


| |||||
 |  | ||||

| 12Stocks.com Market Intelligence |
Best MidCap Stocks
|
| In a hurry? Mid Cap Stocks Lists: Performance Trends Table, Stock Charts
Sort midcap stocks: Daily, Weekly, Year-to-Date, Market Cap & Trends. Filter midcap stocks list by sector: Show all, Tech, Finance, Energy, Staples, Retail, Industrial, Materials, Utilities and HealthCare Filter midcap stocks list by size:All MidCap Large Mid-Range Small |
| 12Stocks.com Mid Cap Stocks Performances & Trends Daily | |||||||||
|
|  The overall Smart Investing & Trading Score is 63 (0-bearish to 100-bullish) which puts Mid Cap index in short term neutral to bullish trend. The Smart Investing & Trading Score from previous trading session is 44 and an improvement of trend continues.
| ||||||||
Here are the Smart Investing & Trading Scores of the most requested mid cap stocks at 12Stocks.com (click stock name for detailed review):
|


| 12Stocks.com: Top Performing Mid Cap Index Stocks | ||||||||||||||||||||||||||||||||||||||||||||||||
 The top performing Mid Cap Index stocks year to date are
Now, more recently, over last week, the top performing Mid Cap Index stocks on the move are


|
||||||||||||||||||||||||||||||||||||||||||||||||
| 12Stocks.com: Investing in Midcap Index with Stocks | |
|
The following table helps investors and traders sort through current performance and trends (as measured by Smart Investing & Trading Score) of various
stocks in the Midcap Index. Quick View: Move mouse or cursor over stock symbol (ticker) to view short-term technical chart and over stock name to view long term chart. Click on  to add stock symbol to your watchlist and to add stock symbol to your watchlist and  to view watchlist. Click on any ticker or stock name for detailed market intelligence report for that stock. to view watchlist. Click on any ticker or stock name for detailed market intelligence report for that stock. |
12Stocks.com Performance of Stocks in Midcap Index
| Ticker | Stock Name | Watchlist | Category | Recent Price | Smart Investing & Trading Score | Change % | Weekly Change% |
| OC | Owens Corning |   | Industrials | 167.62 | 70 | 1.93% | 4.69% |
| EXPE | Expedia | | Services & Goods | 135.02 | 64 | 2.61% | 4.67% |
| BSY | Bentley | | Technology | 54.42 | 100 | 2.29% | 4.64% |
| CELH | Celsius | | Consumer Staples | 72.03 | 68 | 3.21% | 4.63% |
| RIVN | Rivian Automotive | | Services & Goods | 9.03 | 35 | 2.79% | 4.63% |
| IQV | IQVIA | | Health Care | 238.62 | 75 | 3.15% | 4.62% |
| TDG | TransDigm | | Industrials | 1242.40 | 71 | 3.45% | 4.61% |
| ZION | Zions Ban | | Financials | 41.75 | 72 | 1.04% | 4.58% |
| FHB | First Hawaiian | | Financials | 21.96 | 100 | 1.34% | 4.57% |
| LAZ | Lazard | | Financials | 39.63 | 75 | 2.94% | 4.54% |
| ZS | Zscaler | | Technology | 176.92 | 42 | 3.48% | 4.54% |
| ROIV | Roivant Sciences | | Health Care | 10.94 | 68 | 3.06% | 4.54% |
| BXP | Boston Properties | | Financials | 62.93 | 74 | 2.59% | 4.53% |
| NET | Cloudflare | | Technology | 87.88 | 58 | 3.77% | 4.49% |
| HOG | Harley-Davidson | | Consumer Staples | 39.74 | 68 | 1.92% | 4.47% |
| AES | AES | | Utilities | 17.13 | 85 | 2.57% | 4.45% |
| MTD | Mettler-Toledo | | Health Care | 1241.32 | 68 | 3.49% | 4.44% |
| KD | Kyndryl | | Technology | 20.52 | 32 | 2.70% | 4.37% |
| Z | Zillow | | Technology | 43.63 | 42 | 3.29% | 4.33% |
| ALGN | Align | | Health Care | 311.88 | 68 | 3.68% | 4.31% |
| TRIP | TripAdvisor | | Technology | 26.12 | 63 | 2.19% | 4.31% |
| SITE | SiteOne Landscape | | Industrials | 162.65 | 58 | 3.60% | 4.30% |
| VNO | Vornado Realty | | Financials | 27.21 | 68 | 2.33% | 4.29% |
| LII | Lennox | | Industrials | 476.66 | 68 | 3.78% | 4.27% |
| PATH | UiPath | | Technology | 19.55 | 42 | 3.49% | 4.27% |
| For chart view version of above stock list: Chart View ➞ 0 - 25 , 25 - 50 , 50 - 75 , 75 - 100 , 100 - 125 , 125 - 150 , 150 - 175 , 175 - 200 , 200 - 225 , 225 - 250 , 250 - 275 , 275 - 300 , 300 - 325 , 325 - 350 , 350 - 375 , 375 - 400 , 400 - 425 , 425 - 450 , 450 - 475 , 475 - 500 , 500 - 525 , 525 - 550 , 550 - 575 , 575 - 600 , 600 - 625 , 625 - 650 , 650 - 675 , 675 - 700 , 700 - 725 , 725 - 750 , 750 - 775 | ||
 | Click To Change The Sort Order: By Market Cap or Company Size Performance: Year-to-date, Week and Day |  |
|
Get the most comprehensive stock market coverage daily at 12Stocks.com ➞ Best Stocks Today ➞ Best Stocks Weekly ➞ Best Stocks Year-to-Date ➞ Best Stocks Trends ➞  Best Stocks Today 12Stocks.com Best Nasdaq Stocks ➞ Best S&P 500 Stocks ➞ Best Tech Stocks ➞ Best Biotech Stocks ➞ |
| Detailed Overview of Midcap Stocks |
| Midcap Technical Overview, Leaders & Laggards, Top Midcap ETF Funds & Detailed Midcap Stocks List, Charts, Trends & More |
| Midcap: Technical Analysis, Trends & YTD Performance | |
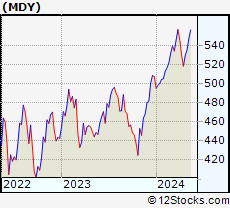
| MidCap segment as represented by
MDY, an exchange-traded fund [ETF], holds basket of about four hundred midcap stocks from across all major sectors of the US stock market. The midcap index (contains stocks like Green Mountain Coffee Roasters and Tractor Supply Company) is up by 4.42% and is currently underperforming the overall market by -1.22% year-to-date. Below is a quick view of technical charts and trends: | |
 MDY Weekly Chart |
|
| Long Term Trend: Very Good | |
| Medium Term Trend: Not Good | |
 MDY Daily Chart |
|
| Short Term Trend: Very Good | |
| Overall Trend Score: 63 | |
| YTD Performance: 4.42% | |
| **Trend Scores & Views Are Only For Educational Purposes And Not For Investing | |
| 12Stocks.com: Investing in Midcap Index using Exchange Traded Funds | |
|
The following table shows list of key exchange traded funds (ETF) that
help investors track Midcap index. The following list also includes leveraged ETF funds that track twice or thrice the daily returns of Midcap indices. Short or inverse ETF funds move in the opposite direction to the index they track and are useful during market pullbacks or during bear markets. Quick View: Move mouse or cursor over ETF symbol (ticker) to view short-term technical chart and over ETF name to view long term chart. Click on ticker or stock name for detailed view. Click on to add stock symbol to your watchlist and to view watchlist. |
12Stocks.com List of ETFs that track Midcap Index
| Ticker | ETF Name | Watchlist | Recent Price | Smart Investing & Trading Score | Change % | Week % | Year-to-date % |
| IJH | iShares Core S&P Mid-Cap | | 57.85 | 68 | 1.82 | 2.24 | 4.37% |
| IWS | iShares Russell Mid-Cap Value | | 119.86 | 68 | 0.89 | 1.88 | 3.07% |
| IWP | iShares Russell Mid-Cap Growth | | 108.63 | 58 | 1.80 | 2.77 | 3.99% |
| IWR | iShares Russell Mid-Cap | | 80.37 | 63 | 1.25 | 2.17 | 3.4% |
| MDY | SPDR S&P MidCap 400 ETF | | 529.80 | 63 | 1.20 | 2.22 | 4.42% |
| IJK | iShares S&P Mid-Cap 400 Growth | | 86.93 | 63 | 1.58 | 2.45 | 9.73% |
| IJJ | iShares S&P Mid-Cap 400 Value | | 112.47 | 63 | 0.83 | 1.74 | -1.38% |
| XMLV | PowerShares S&P MidCap Low Volatil ETF | | 54.91 | 75 | 0.68 | 1.38 | 3.25% |
| UMDD | ProShares UltraPro MidCap400 | | 24.11 | 63 | 4.06 | 6.86 | 8.02% |
| SMDD | ProShares UltraPro Short MidCap400 | | 11.65 | 32 | -3.79 | -7.26 | -13.46% |
| MVV | ProShares Ultra MidCap400 | | 61.54 | 63 | 2.07 | 4.31 | 6.31% |
| MZZ | ProShares UltraShort MidCap400 | | 11.66 | 27 | -2.51 | -4.2 | -7.24% |
| MYY | ProShares Short MidCap400 | | 20.74 | 32 | -1.09 | -2.12 | -3.33% |
| 12Stocks.com: Charts, Trends, Fundamental Data and Performances of MidCap Stocks | |
|
We now take in-depth look at all MidCap stocks including charts, multi-period performances and overall trends (as measured by Smart Investing & Trading Score). One can sort MidCap stocks (click link to choose) by Daily, Weekly and by Year-to-Date performances. Also, one can sort by size of the company or by market capitalization. |
| Select Your Default Chart Type: | |||||
| |||||
| Click on stock symbol or name for detailed view. Click on to add stock symbol to your watchlist and to view watchlist. Quick View: Move mouse or cursor over "Daily" to quickly view daily technical stock chart and over "Weekly" to view weekly technical stock chart. | |||||

 | OC Owens Corning |
| Sector: Industrials | |
| SubSector: General Building Materials | |
| MarketCap: 3686.73 Millions | |
| Recent Price: 167.62 Smart Investing & Trading Score: 70 | |
| Day Percent Change: 1.93% Day Change: 3.18 | |
| Week Change: 4.69% Year-to-date Change: 13.1% | |
| OC Links: Profile News Message Board | |
| Charts:- Daily , Weekly | |
| Add OC to Watchlist: View: Get Complete OC Trend Analysis ➞ | |
 | EXPE Expedia Group, Inc. |
| Sector: Services & Goods | |
| SubSector: Lodging | |
| MarketCap: 8052.96 Millions | |
| Recent Price: 135.02 Smart Investing & Trading Score: 64 | |
| Day Percent Change: 2.61% Day Change: 3.43 | |
| Week Change: 4.67% Year-to-date Change: -11.1% | |
| EXPE Links: Profile News Message Board | |
| Charts:- Daily , Weekly | |
| Add EXPE to Watchlist: View: Get Complete EXPE Trend Analysis ➞ | |
 | BSY Bentley Systems, Incorporated |
| Sector: Technology | |
| SubSector: Software Application | |
| MarketCap: 98687 Millions | |
| Recent Price: 54.42 Smart Investing & Trading Score: 100 | |
| Day Percent Change: 2.29% Day Change: 1.22 | |
| Week Change: 4.64% Year-to-date Change: 4.3% | |
| BSY Links: Profile News Message Board | |
| Charts:- Daily , Weekly | |
| Add BSY to Watchlist: View: Get Complete BSY Trend Analysis ➞ | |
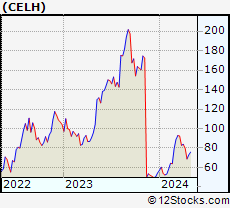 | CELH Celsius Holdings, Inc. |
| Sector: Consumer Staples | |
| SubSector: Beverages - Soft Drinks | |
| MarketCap: 280.32 Millions | |
| Recent Price: 72.03 Smart Investing & Trading Score: 68 | |
| Day Percent Change: 3.21% Day Change: 2.24 | |
| Week Change: 4.63% Year-to-date Change: 32.1% | |
| CELH Links: Profile News Message Board | |
| Charts:- Daily , Weekly | |
| Add CELH to Watchlist: View: Get Complete CELH Trend Analysis ➞ | |
 | RIVN Rivian Automotive, Inc. |
| Sector: Services & Goods | |
| SubSector: Auto Manufacturers | |
| MarketCap: 14310 Millions | |
| Recent Price: 9.03 Smart Investing & Trading Score: 35 | |
| Day Percent Change: 2.79% Day Change: 0.24 | |
| Week Change: 4.63% Year-to-date Change: -61.5% | |
| RIVN Links: Profile News Message Board | |
| Charts:- Daily , Weekly | |
| Add RIVN to Watchlist: View: Get Complete RIVN Trend Analysis ➞ | |
 | IQV IQVIA Holdings Inc. |
| Sector: Health Care | |
| SubSector: Medical Laboratories & Research | |
| MarketCap: 19616.5 Millions | |
| Recent Price: 238.62 Smart Investing & Trading Score: 75 | |
| Day Percent Change: 3.15% Day Change: 7.28 | |
| Week Change: 4.62% Year-to-date Change: 3.1% | |
| IQV Links: Profile News Message Board | |
| Charts:- Daily , Weekly | |
| Add IQV to Watchlist: View: Get Complete IQV Trend Analysis ➞ | |
 | TDG TransDigm Group Incorporated |
| Sector: Industrials | |
| SubSector: Aerospace/Defense Products & Services | |
| MarketCap: 18441 Millions | |
| Recent Price: 1242.40 Smart Investing & Trading Score: 71 | |
| Day Percent Change: 3.45% Day Change: 41.47 | |
| Week Change: 4.61% Year-to-date Change: 22.8% | |
| TDG Links: Profile News Message Board | |
| Charts:- Daily , Weekly | |
| Add TDG to Watchlist: View: Get Complete TDG Trend Analysis ➞ | |
 | ZION Zions Bancorporation, National Association |
| Sector: Financials | |
| SubSector: Regional - Pacific Banks | |
| MarketCap: 4577.89 Millions | |
| Recent Price: 41.75 Smart Investing & Trading Score: 72 | |
| Day Percent Change: 1.04% Day Change: 0.43 | |
| Week Change: 4.58% Year-to-date Change: -4.8% | |
| ZION Links: Profile News Message Board | |
| Charts:- Daily , Weekly | |
| Add ZION to Watchlist: View: Get Complete ZION Trend Analysis ➞ | |
 | FHB First Hawaiian, Inc. |
| Sector: Financials | |
| SubSector: Regional - Pacific Banks | |
| MarketCap: 2398.99 Millions | |
| Recent Price: 21.96 Smart Investing & Trading Score: 100 | |
| Day Percent Change: 1.34% Day Change: 0.29 | |
| Week Change: 4.57% Year-to-date Change: -3.9% | |
| FHB Links: Profile News Message Board | |
| Charts:- Daily , Weekly | |
| Add FHB to Watchlist: View: Get Complete FHB Trend Analysis ➞ | |
 | LAZ Lazard Ltd |
| Sector: Financials | |
| SubSector: Asset Management | |
| MarketCap: 3061.13 Millions | |
| Recent Price: 39.63 Smart Investing & Trading Score: 75 | |
| Day Percent Change: 2.94% Day Change: 1.13 | |
| Week Change: 4.54% Year-to-date Change: 13.9% | |
| LAZ Links: Profile News Message Board | |
| Charts:- Daily , Weekly | |
| Add LAZ to Watchlist: View: Get Complete LAZ Trend Analysis ➞ | |
 | ZS Zscaler, Inc. |
| Sector: Technology | |
| SubSector: Security Software & Services | |
| MarketCap: 7532.17 Millions | |
| Recent Price: 176.92 Smart Investing & Trading Score: 42 | |
| Day Percent Change: 3.48% Day Change: 5.95 | |
| Week Change: 4.54% Year-to-date Change: -20.2% | |
| ZS Links: Profile News Message Board | |
| Charts:- Daily , Weekly | |
| Add ZS to Watchlist: View: Get Complete ZS Trend Analysis ➞ | |
 | ROIV Roivant Sciences Ltd. |
| Sector: Health Care | |
| SubSector: Biotechnology | |
| MarketCap: 7780 Millions | |
| Recent Price: 10.94 Smart Investing & Trading Score: 68 | |
| Day Percent Change: 3.06% Day Change: 0.33 | |
| Week Change: 4.54% Year-to-date Change: -1.5% | |
| ROIV Links: Profile News Message Board | |
| Charts:- Daily , Weekly | |
| Add ROIV to Watchlist: View: Get Complete ROIV Trend Analysis ➞ | |
 | BXP Boston Properties, Inc. |
| Sector: Financials | |
| SubSector: REIT - Office | |
| MarketCap: 13788.6 Millions | |
| Recent Price: 62.93 Smart Investing & Trading Score: 74 | |
| Day Percent Change: 2.59% Day Change: 1.59 | |
| Week Change: 4.53% Year-to-date Change: -10.3% | |
| BXP Links: Profile News Message Board | |
| Charts:- Daily , Weekly | |
| Add BXP to Watchlist: View: Get Complete BXP Trend Analysis ➞ | |
 | NET Cloudflare, Inc. |
| Sector: Technology | |
| SubSector: Application Software | |
| MarketCap: 7063.72 Millions | |
| Recent Price: 87.88 Smart Investing & Trading Score: 58 | |
| Day Percent Change: 3.77% Day Change: 3.19 | |
| Week Change: 4.49% Year-to-date Change: 5.6% | |
| NET Links: Profile News Message Board | |
| Charts:- Daily , Weekly | |
| Add NET to Watchlist: View: Get Complete NET Trend Analysis ➞ | |
 | HOG Harley-Davidson, Inc. |
| Sector: Consumer Staples | |
| SubSector: Recreational Vehicles | |
| MarketCap: 2808.49 Millions | |
| Recent Price: 39.74 Smart Investing & Trading Score: 68 | |
| Day Percent Change: 1.92% Day Change: 0.75 | |
| Week Change: 4.47% Year-to-date Change: 7.9% | |
| HOG Links: Profile News Message Board | |
| Charts:- Daily , Weekly | |
| Add HOG to Watchlist: View: Get Complete HOG Trend Analysis ➞ | |
 | AES The AES Corporation |
| Sector: Utilities | |
| SubSector: Electric Utilities | |
| MarketCap: 9173.44 Millions | |
| Recent Price: 17.13 Smart Investing & Trading Score: 85 | |
| Day Percent Change: 2.57% Day Change: 0.43 | |
| Week Change: 4.45% Year-to-date Change: -11.0% | |
| AES Links: Profile News Message Board | |
| Charts:- Daily , Weekly | |
| Add AES to Watchlist: View: Get Complete AES Trend Analysis ➞ | |
 | MTD Mettler-Toledo International Inc. |
| Sector: Health Care | |
| SubSector: Medical Instruments & Supplies | |
| MarketCap: 15973.1 Millions | |
| Recent Price: 1241.32 Smart Investing & Trading Score: 68 | |
| Day Percent Change: 3.49% Day Change: 41.86 | |
| Week Change: 4.44% Year-to-date Change: 2.3% | |
| MTD Links: Profile News Message Board | |
| Charts:- Daily , Weekly | |
| Add MTD to Watchlist: View: Get Complete MTD Trend Analysis ➞ | |
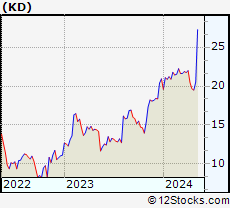 | KD Kyndryl Holdings, Inc. |
| Sector: Technology | |
| SubSector: Information Technology Services | |
| MarketCap: 2990 Millions | |
| Recent Price: 20.52 Smart Investing & Trading Score: 32 | |
| Day Percent Change: 2.70% Day Change: 0.54 | |
| Week Change: 4.37% Year-to-date Change: -2.0% | |
| KD Links: Profile News Message Board | |
| Charts:- Daily , Weekly | |
| Add KD to Watchlist: View: Get Complete KD Trend Analysis ➞ | |
 | Z Zillow Group, Inc. |
| Sector: Technology | |
| SubSector: Internet Information Providers | |
| MarketCap: 3880.4 Millions | |
| Recent Price: 43.63 Smart Investing & Trading Score: 42 | |
| Day Percent Change: 3.29% Day Change: 1.39 | |
| Week Change: 4.33% Year-to-date Change: -24.6% | |
| Z Links: Profile News Message Board | |
| Charts:- Daily , Weekly | |
| Add Z to Watchlist: View: Get Complete Z Trend Analysis ➞ | |
 | ALGN Align Technology, Inc. |
| Sector: Health Care | |
| SubSector: Medical Appliances & Equipment | |
| MarketCap: 12802 Millions | |
| Recent Price: 311.88 Smart Investing & Trading Score: 68 | |
| Day Percent Change: 3.68% Day Change: 11.06 | |
| Week Change: 4.31% Year-to-date Change: 13.8% | |
| ALGN Links: Profile News Message Board | |
| Charts:- Daily , Weekly | |
| Add ALGN to Watchlist: View: Get Complete ALGN Trend Analysis ➞ | |
 | TRIP TripAdvisor, Inc. |
| Sector: Technology | |
| SubSector: Internet Information Providers | |
| MarketCap: 2633.9 Millions | |
| Recent Price: 26.12 Smart Investing & Trading Score: 63 | |
| Day Percent Change: 2.19% Day Change: 0.56 | |
| Week Change: 4.31% Year-to-date Change: 21.3% | |
| TRIP Links: Profile News Message Board | |
| Charts:- Daily , Weekly | |
| Add TRIP to Watchlist: View: Get Complete TRIP Trend Analysis ➞ | |
 | SITE SiteOne Landscape Supply, Inc. |
| Sector: Industrials | |
| SubSector: Small Tools & Accessories | |
| MarketCap: 2733.56 Millions | |
| Recent Price: 162.65 Smart Investing & Trading Score: 58 | |
| Day Percent Change: 3.60% Day Change: 5.65 | |
| Week Change: 4.3% Year-to-date Change: 0.1% | |
| SITE Links: Profile News Message Board | |
| Charts:- Daily , Weekly | |
| Add SITE to Watchlist: View: Get Complete SITE Trend Analysis ➞ | |
 | VNO Vornado Realty Trust |
| Sector: Financials | |
| SubSector: REIT - Diversified | |
| MarketCap: 6300.63 Millions | |
| Recent Price: 27.21 Smart Investing & Trading Score: 68 | |
| Day Percent Change: 2.33% Day Change: 0.62 | |
| Week Change: 4.29% Year-to-date Change: -3.7% | |
| VNO Links: Profile News Message Board | |
| Charts:- Daily , Weekly | |
| Add VNO to Watchlist: View: Get Complete VNO Trend Analysis ➞ | |
 | LII Lennox International Inc. |
| Sector: Industrials | |
| SubSector: Diversified Machinery | |
| MarketCap: 7720.66 Millions | |
| Recent Price: 476.66 Smart Investing & Trading Score: 68 | |
| Day Percent Change: 3.78% Day Change: 17.37 | |
| Week Change: 4.27% Year-to-date Change: 6.5% | |
| LII Links: Profile News Message Board | |
| Charts:- Daily , Weekly | |
| Add LII to Watchlist: View: Get Complete LII Trend Analysis ➞ | |
 | PATH UiPath Inc. |
| Sector: Technology | |
| SubSector: Software - Infrastructure | |
| MarketCap: 9580 Millions | |
| Recent Price: 19.55 Smart Investing & Trading Score: 42 | |
| Day Percent Change: 3.49% Day Change: 0.66 | |
| Week Change: 4.27% Year-to-date Change: -21.3% | |
| PATH Links: Profile News Message Board | |
| Charts:- Daily , Weekly | |
| Add PATH to Watchlist: View: Get Complete PATH Trend Analysis ➞ | |
| For tabular summary view of above stock list: Summary View ➞ 0 - 25 , 25 - 50 , 50 - 75 , 75 - 100 , 100 - 125 , 125 - 150 , 150 - 175 , 175 - 200 , 200 - 225 , 225 - 250 , 250 - 275 , 275 - 300 , 300 - 325 , 325 - 350 , 350 - 375 , 375 - 400 , 400 - 425 , 425 - 450 , 450 - 475 , 475 - 500 , 500 - 525 , 525 - 550 , 550 - 575 , 575 - 600 , 600 - 625 , 625 - 650 , 650 - 675 , 675 - 700 , 700 - 725 , 725 - 750 , 750 - 775 | ||
| Click To Change The Sort Order: By Market Cap or Company Size Performance: Year-to-date, Week and Day | |
| Select Chart Type: | ||
|
Best Stocks Today 12Stocks.com |
© 2024 12Stocks.com Terms & Conditions Privacy Contact Us
All Information Provided Only For Education And Not To Be Used For Investing or Trading. See Terms & Conditions


One More Thing ... Get Best Stocks Delivered Daily!
Never Ever Miss A Move With Our Top Ten Stocks Lists
Find Best Stocks In Any Market - Bull or Bear Market
Take A Peek At Our Top Ten Stocks Lists: Daily, Weekly, Year-to-Date & Top Trends
Find Best Stocks In Any Market - Bull or Bear Market
Take A Peek At Our Top Ten Stocks Lists: Daily, Weekly, Year-to-Date & Top Trends
Midcap Stocks With Best Up Trends [0-bearish to 100-bullish]: HashiCorp [100], Ryder System[100], Quest Diagnostics[100], Hasbro [100], RLI [100], Popular [100], BioMarin Pharmaceutical[100], SLM [100], Kirby [100], Highwoods Properties[100], HEICO [100]
Best Midcap Stocks Year-to-Date:
AppLovin [78.89%], Vistra Energy[77.7%], ShockWave Medical[72.41%], Spotify [61.41%], Constellation Energy[60.75%], EMCOR [56.93%], Natera [45.34%], Pure Storage[45.26%], Wingstop [42.15%], Williams-Sonoma [41.28%], CAVA [40.73%] Best Midcap Stocks This Week:
HashiCorp [22.53%], Tandem Diabetes[14.92%], Globe Life[13.52%], Ryder System[12.23%], Coinbase Global[12.04%], MongoDB [11.91%], Spotify [9.96%], Kohl s[9.53%], Medpace [9.49%], Repligen [9%], GitLab [8.91%] Best Midcap Stocks Daily:
HashiCorp [19.54%], Globe Life[14.11%], Ryder System[11.94%], Spotify [11.41%], Tandem Diabetes[10.11%], Repligen [8.76%], Medpace [8.21%], Viasat [7.99%], MongoDB [7.69%], GitLab [6.80%], Lucid [6.11%]