
 Login Sign Up


| |||||
 |  | ||||

| 12Stocks.com Market Intelligence |
Best MidCap Stocks
|
| In a hurry? Mid Cap Stocks Lists: Performance Trends Table, Stock Charts
Sort midcap stocks: Daily, Weekly, Year-to-Date, Market Cap & Trends. Filter midcap stocks list by sector: Show all, Tech, Finance, Energy, Staples, Retail, Industrial, Materials, Utilities and HealthCare Filter midcap stocks list by size:All MidCap Large Mid-Range Small |
| 12Stocks.com Mid Cap Stocks Performances & Trends Daily | |||||||||
|
|  The overall Smart Investing & Trading Score is 63 (0-bearish to 100-bullish) which puts Mid Cap index in short term neutral to bullish trend. The Smart Investing & Trading Score from previous trading session is 44 and an improvement of trend continues.
| ||||||||
Here are the Smart Investing & Trading Scores of the most requested mid cap stocks at 12Stocks.com (click stock name for detailed review):
|


| 12Stocks.com: Top Performing Mid Cap Index Stocks | ||||||||||||||||||||||||||||||||||||||||||||||||
 The top performing Mid Cap Index stocks year to date are
Now, more recently, over last week, the top performing Mid Cap Index stocks on the move are


|
||||||||||||||||||||||||||||||||||||||||||||||||
| 12Stocks.com: Investing in Midcap Index with Stocks | |
|
The following table helps investors and traders sort through current performance and trends (as measured by Smart Investing & Trading Score) of various
stocks in the Midcap Index. Quick View: Move mouse or cursor over stock symbol (ticker) to view short-term technical chart and over stock name to view long term chart. Click on  to add stock symbol to your watchlist and to add stock symbol to your watchlist and  to view watchlist. Click on any ticker or stock name for detailed market intelligence report for that stock. to view watchlist. Click on any ticker or stock name for detailed market intelligence report for that stock. |
12Stocks.com Performance of Stocks in Midcap Index
| Ticker | Stock Name | Watchlist | Category | Recent Price | Smart Investing & Trading Score | Change % | YTD Change% |
| DVN | Devon Energy |   | Energy | 51.95 | 61 | -1.17% | 14.69% |
| ICUI | ICU Medical | | Health Care | 96.97 | 61 | -0.81% | -2.78% |
| CINF | Cinnati Financial | | Financials | 120.08 | 61 | -0.62% | 16.06% |
| ACGL | Arch Capital | | Financials | 93.21 | 61 | -0.61% | 25.50% |
| AFG | American Financial | | Financials | 129.23 | 61 | -0.37% | 8.70% |
| HIG | Hartford Financial | | Financials | 99.80 | 61 | -0.23% | 24.16% |
| SWAV | ShockWave Medical | | Health Care | 328.27 | 61 | -0.08% | 72.27% |
| BWA | BorgWarner | | Consumer Staples | 33.59 | 60 | 0.75% | -6.30% |
| WPC | W. P. | | Financials | 56.42 | 60 | 0.20% | -12.95% |
| PODD | Insulet | | Health Care | 167.21 | 60 | -0.04% | -22.94% |
| LCID | Lucid | | Services & Goods | 2.54 | 59 | 0.60% | -39.28% |
| LFUS | Littelfuse | | Services & Goods | 232.44 | 59 | 0.54% | -13.13% |
| VSAT | Viasat | | Technology | 16.22 | 59 | -3.19% | -41.99% |
| WAL | Western Alliance | | Financials | 59.06 | 59 | -1.27% | -10.23% |
| BEPC | Brookfield Renewable | | Utilities | 23.42 | 59 | -0.43% | -18.65% |
| MPWR | Monolithic Power | | Technology | 637.16 | 58 | 4.22% | 1.01% |
| UHS | Universal Health | | Health Care | 166.54 | 58 | 0.99% | 9.25% |
| CPRT | Copart | | Services & Goods | 54.82 | 58 | 0.94% | 11.88% |
| AXON | Axovant Sciences | | Health Care | 304.38 | 58 | 0.93% | 17.82% |
| CHE | Chemed | | Health Care | 621.25 | 58 | 0.77% | 6.24% |
| BWXT | BWX Technologies | | Industrials | 94.42 | 58 | 0.77% | 23.05% |
| SSNC | SS&C Technologies | | Technology | 61.38 | 58 | 0.66% | 0.44% |
| SITE | SiteOne Landscape | | Industrials | 163.46 | 58 | 0.50% | 0.59% |
| HST | Host Hotels | | Financials | 19.38 | 58 | 0.44% | -0.49% |
| EHC | Encompass Health | | Health Care | 82.77 | 58 | 0.38% | 24.06% |
| For chart view version of above stock list: Chart View ➞ 0 - 25 , 25 - 50 , 50 - 75 , 75 - 100 , 100 - 125 , 125 - 150 , 150 - 175 , 175 - 200 , 200 - 225 , 225 - 250 , 250 - 275 , 275 - 300 , 300 - 325 , 325 - 350 , 350 - 375 , 375 - 400 , 400 - 425 , 425 - 450 , 450 - 475 , 475 - 500 , 500 - 525 , 525 - 550 , 550 - 575 , 575 - 600 , 600 - 625 , 625 - 650 , 650 - 675 , 675 - 700 , 700 - 725 , 725 - 750 , 750 - 775 | ||
 | Click To Change The Sort Order: By Market Cap or Company Size Performance: Year-to-date, Week and Day |  |
|
Get the most comprehensive stock market coverage daily at 12Stocks.com ➞ Best Stocks Today ➞ Best Stocks Weekly ➞ Best Stocks Year-to-Date ➞ Best Stocks Trends ➞  Best Stocks Today 12Stocks.com Best Nasdaq Stocks ➞ Best S&P 500 Stocks ➞ Best Tech Stocks ➞ Best Biotech Stocks ➞ |
| Detailed Overview of Midcap Stocks |
| Midcap Technical Overview, Leaders & Laggards, Top Midcap ETF Funds & Detailed Midcap Stocks List, Charts, Trends & More |
| Midcap: Technical Analysis, Trends & YTD Performance | |
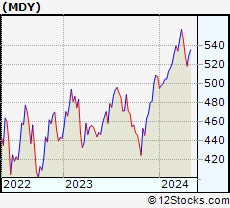
| MidCap segment as represented by
MDY, an exchange-traded fund [ETF], holds basket of about four hundred midcap stocks from across all major sectors of the US stock market. The midcap index (contains stocks like Green Mountain Coffee Roasters and Tractor Supply Company) is up by 4.26% and is currently underperforming the overall market by -1.23% year-to-date. Below is a quick view of technical charts and trends: | |
 MDY Weekly Chart |
|
| Long Term Trend: Very Good | |
| Medium Term Trend: Not Good | |
 MDY Daily Chart |
|
| Short Term Trend: Very Good | |
| Overall Trend Score: 63 | |
| YTD Performance: 4.26% | |
| **Trend Scores & Views Are Only For Educational Purposes And Not For Investing | |
| 12Stocks.com: Investing in Midcap Index using Exchange Traded Funds | |
|
The following table shows list of key exchange traded funds (ETF) that
help investors track Midcap index. The following list also includes leveraged ETF funds that track twice or thrice the daily returns of Midcap indices. Short or inverse ETF funds move in the opposite direction to the index they track and are useful during market pullbacks or during bear markets. Quick View: Move mouse or cursor over ETF symbol (ticker) to view short-term technical chart and over ETF name to view long term chart. Click on ticker or stock name for detailed view. Click on to add stock symbol to your watchlist and to view watchlist. |
12Stocks.com List of ETFs that track Midcap Index
| Ticker | ETF Name | Watchlist | Recent Price | Smart Investing & Trading Score | Change % | Week % | Year-to-date % |
| IJH | iShares Core S&P Mid-Cap | | 57.81 | 68 | -0.07 | 2.17 | 4.29% |
| IWR | iShares Russell Mid-Cap | | 80.31 | 41 | -0.08 | 2.09 | 3.31% |
| MDY | SPDR S&P MidCap 400 ETF | | 528.99 | 63 | -0.15 | 2.07 | 4.26% |
| IWP | iShares Russell Mid-Cap Growth | | 108.49 | 36 | -0.13 | 2.64 | 3.86% |
| IJK | iShares S&P Mid-Cap 400 Growth | | 86.82 | 41 | -0.13 | 2.32 | 9.59% |
| IWS | iShares Russell Mid-Cap Value | | 119.72 | 68 | -0.12 | 1.76 | 2.95% |
| IJJ | iShares S&P Mid-Cap 400 Value | | 112.33 | 41 | -0.12 | 1.61 | -1.5% |
| XMLV | PowerShares S&P MidCap Low Volatil ETF | | 54.96 | 53 | 0.09 | 1.47 | 3.34% |
| UMDD | ProShares UltraPro MidCap400 | | 23.82 | 58 | -1.20 | 5.57 | 6.72% |
| MVV | ProShares Ultra MidCap400 | | 61.39 | 41 | -0.24 | 4.05 | 6.05% |
| SMDD | ProShares UltraPro Short MidCap400 | | 11.84 | 32 | 1.58 | -5.79 | -12.1% |
| MYY | ProShares Short MidCap400 | | 20.74 | 32 | 0.00 | -2.12 | -3.34% |
| MZZ | ProShares UltraShort MidCap400 | | 11.69 | 27 | 0.26 | -3.95 | -7.01% |
| 12Stocks.com: Charts, Trends, Fundamental Data and Performances of MidCap Stocks | |
|
We now take in-depth look at all MidCap stocks including charts, multi-period performances and overall trends (as measured by Smart Investing & Trading Score). One can sort MidCap stocks (click link to choose) by Daily, Weekly and by Year-to-Date performances. Also, one can sort by size of the company or by market capitalization. |
| Select Your Default Chart Type: | |||||
| |||||
| Click on stock symbol or name for detailed view. Click on to add stock symbol to your watchlist and to view watchlist. Quick View: Move mouse or cursor over "Daily" to quickly view daily technical stock chart and over "Weekly" to view weekly technical stock chart. | |||||

 | DVN Devon Energy Corporation |
| Sector: Energy | |
| SubSector: Independent Oil & Gas | |
| MarketCap: 2693.03 Millions | |
| Recent Price: 51.95 Smart Investing & Trading Score: 61 | |
| Day Percent Change: -1.17% Day Change: -0.62 | |
| Week Change: 0.24% Year-to-date Change: 14.7% | |
| DVN Links: Profile News Message Board | |
| Charts:- Daily , Weekly | |
| Add DVN to Watchlist: View: Get Complete DVN Trend Analysis ➞ | |
 | ICUI ICU Medical, Inc. |
| Sector: Health Care | |
| SubSector: Medical Instruments & Supplies | |
| MarketCap: 3640.7 Millions | |
| Recent Price: 96.97 Smart Investing & Trading Score: 61 | |
| Day Percent Change: -0.81% Day Change: -0.80 | |
| Week Change: 1.25% Year-to-date Change: -2.8% | |
| ICUI Links: Profile News Message Board | |
| Charts:- Daily , Weekly | |
| Add ICUI to Watchlist: View: Get Complete ICUI Trend Analysis ➞ | |
 | CINF Cincinnati Financial Corporation |
| Sector: Financials | |
| SubSector: Property & Casualty Insurance | |
| MarketCap: 13637 Millions | |
| Recent Price: 120.08 Smart Investing & Trading Score: 61 | |
| Day Percent Change: -0.62% Day Change: -0.75 | |
| Week Change: 0.1% Year-to-date Change: 16.1% | |
| CINF Links: Profile News Message Board | |
| Charts:- Daily , Weekly | |
| Add CINF to Watchlist: View: Get Complete CINF Trend Analysis ➞ | |
 | ACGL Arch Capital Group Ltd. |
| Sector: Financials | |
| SubSector: Property & Casualty Insurance | |
| MarketCap: 12350.9 Millions | |
| Recent Price: 93.21 Smart Investing & Trading Score: 61 | |
| Day Percent Change: -0.61% Day Change: -0.57 | |
| Week Change: 0.3% Year-to-date Change: 25.5% | |
| ACGL Links: Profile News Message Board | |
| Charts:- Daily , Weekly | |
| Add ACGL to Watchlist: View: Get Complete ACGL Trend Analysis ➞ | |
 | AFG American Financial Group, Inc. |
| Sector: Financials | |
| SubSector: Property & Casualty Insurance | |
| MarketCap: 5353.82 Millions | |
| Recent Price: 129.23 Smart Investing & Trading Score: 61 | |
| Day Percent Change: -0.37% Day Change: -0.48 | |
| Week Change: 1.07% Year-to-date Change: 8.7% | |
| AFG Links: Profile News Message Board | |
| Charts:- Daily , Weekly | |
| Add AFG to Watchlist: View: Get Complete AFG Trend Analysis ➞ | |
 | HIG The Hartford Financial Services Group, Inc. |
| Sector: Financials | |
| SubSector: Property & Casualty Insurance | |
| MarketCap: 12582.8 Millions | |
| Recent Price: 99.80 Smart Investing & Trading Score: 61 | |
| Day Percent Change: -0.23% Day Change: -0.23 | |
| Week Change: 0.86% Year-to-date Change: 24.2% | |
| HIG Links: Profile News Message Board | |
| Charts:- Daily , Weekly | |
| Add HIG to Watchlist: View: Get Complete HIG Trend Analysis ➞ | |
 | SWAV ShockWave Medical, Inc. |
| Sector: Health Care | |
| SubSector: Medical Appliances & Equipment | |
| MarketCap: 855.58 Millions | |
| Recent Price: 328.27 Smart Investing & Trading Score: 61 | |
| Day Percent Change: -0.08% Day Change: -0.27 | |
| Week Change: -0.23% Year-to-date Change: 72.3% | |
| SWAV Links: Profile News Message Board | |
| Charts:- Daily , Weekly | |
| Add SWAV to Watchlist: View: Get Complete SWAV Trend Analysis ➞ | |
 | BWA BorgWarner Inc. |
| Sector: Consumer Staples | |
| SubSector: Auto Parts | |
| MarketCap: 4604.09 Millions | |
| Recent Price: 33.59 Smart Investing & Trading Score: 60 | |
| Day Percent Change: 0.75% Day Change: 0.25 | |
| Week Change: 2.41% Year-to-date Change: -6.3% | |
| BWA Links: Profile News Message Board | |
| Charts:- Daily , Weekly | |
| Add BWA to Watchlist: View: Get Complete BWA Trend Analysis ➞ | |
 | WPC W. P. Carey Inc. |
| Sector: Financials | |
| SubSector: REIT - Diversified | |
| MarketCap: 9560.03 Millions | |
| Recent Price: 56.42 Smart Investing & Trading Score: 60 | |
| Day Percent Change: 0.20% Day Change: 0.11 | |
| Week Change: 0.37% Year-to-date Change: -13.0% | |
| WPC Links: Profile News Message Board | |
| Charts:- Daily , Weekly | |
| Add WPC to Watchlist: View: Get Complete WPC Trend Analysis ➞ | |
 | PODD Insulet Corporation |
| Sector: Health Care | |
| SubSector: Medical Instruments & Supplies | |
| MarketCap: 9313.2 Millions | |
| Recent Price: 167.21 Smart Investing & Trading Score: 60 | |
| Day Percent Change: -0.04% Day Change: -0.06 | |
| Week Change: 0.58% Year-to-date Change: -22.9% | |
| PODD Links: Profile News Message Board | |
| Charts:- Daily , Weekly | |
| Add PODD to Watchlist: View: Get Complete PODD Trend Analysis ➞ | |
 | LCID Lucid Group, Inc. |
| Sector: Services & Goods | |
| SubSector: Auto Manufacturers | |
| MarketCap: 12910 Millions | |
| Recent Price: 2.54 Smart Investing & Trading Score: 59 | |
| Day Percent Change: 0.60% Day Change: 0.02 | |
| Week Change: 3.47% Year-to-date Change: -39.3% | |
| LCID Links: Profile News Message Board | |
| Charts:- Daily , Weekly | |
| Add LCID to Watchlist: View: Get Complete LCID Trend Analysis ➞ | |
 | LFUS Littelfuse, Inc. |
| Sector: Services & Goods | |
| SubSector: Electronics Wholesale | |
| MarketCap: 2965.23 Millions | |
| Recent Price: 232.44 Smart Investing & Trading Score: 59 | |
| Day Percent Change: 0.54% Day Change: 1.25 | |
| Week Change: 2.51% Year-to-date Change: -13.1% | |
| LFUS Links: Profile News Message Board | |
| Charts:- Daily , Weekly | |
| Add LFUS to Watchlist: View: Get Complete LFUS Trend Analysis ➞ | |
 | VSAT Viasat, Inc. |
| Sector: Technology | |
| SubSector: Communication Equipment | |
| MarketCap: 1939.59 Millions | |
| Recent Price: 16.22 Smart Investing & Trading Score: 59 | |
| Day Percent Change: -3.19% Day Change: -0.54 | |
| Week Change: 2.43% Year-to-date Change: -42.0% | |
| VSAT Links: Profile News Message Board | |
| Charts:- Daily , Weekly | |
| Add VSAT to Watchlist: View: Get Complete VSAT Trend Analysis ➞ | |
 | WAL Western Alliance Bancorporation |
| Sector: Financials | |
| SubSector: Regional - Pacific Banks | |
| MarketCap: 2980.09 Millions | |
| Recent Price: 59.06 Smart Investing & Trading Score: 59 | |
| Day Percent Change: -1.27% Day Change: -0.76 | |
| Week Change: 2.82% Year-to-date Change: -10.2% | |
| WAL Links: Profile News Message Board | |
| Charts:- Daily , Weekly | |
| Add WAL to Watchlist: View: Get Complete WAL Trend Analysis ➞ | |
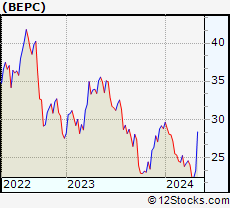 | BEPC Brookfield Renewable Corporation |
| Sector: Utilities | |
| SubSector: Utilities Renewable | |
| MarketCap: 16897 Millions | |
| Recent Price: 23.42 Smart Investing & Trading Score: 59 | |
| Day Percent Change: -0.43% Day Change: -0.10 | |
| Week Change: 4.69% Year-to-date Change: -18.7% | |
| BEPC Links: Profile News Message Board | |
| Charts:- Daily , Weekly | |
| Add BEPC to Watchlist: View: Get Complete BEPC Trend Analysis ➞ | |
 | MPWR Monolithic Power Systems, Inc. |
| Sector: Technology | |
| SubSector: Semiconductor - Specialized | |
| MarketCap: 6436.4 Millions | |
| Recent Price: 637.16 Smart Investing & Trading Score: 58 | |
| Day Percent Change: 4.22% Day Change: 25.79 | |
| Week Change: 7.72% Year-to-date Change: 1.0% | |
| MPWR Links: Profile News Message Board | |
| Charts:- Daily , Weekly | |
| Add MPWR to Watchlist: View: Get Complete MPWR Trend Analysis ➞ | |
 | UHS Universal Health Services, Inc. |
| Sector: Health Care | |
| SubSector: Hospitals | |
| MarketCap: 7217.66 Millions | |
| Recent Price: 166.54 Smart Investing & Trading Score: 58 | |
| Day Percent Change: 0.99% Day Change: 1.63 | |
| Week Change: 5.76% Year-to-date Change: 9.3% | |
| UHS Links: Profile News Message Board | |
| Charts:- Daily , Weekly | |
| Add UHS to Watchlist: View: Get Complete UHS Trend Analysis ➞ | |
 | CPRT Copart, Inc. |
| Sector: Services & Goods | |
| SubSector: Auto Dealerships | |
| MarketCap: 15462.1 Millions | |
| Recent Price: 54.82 Smart Investing & Trading Score: 58 | |
| Day Percent Change: 0.94% Day Change: 0.51 | |
| Week Change: 3.67% Year-to-date Change: 11.9% | |
| CPRT Links: Profile News Message Board | |
| Charts:- Daily , Weekly | |
| Add CPRT to Watchlist: View: Get Complete CPRT Trend Analysis ➞ | |
 | AXON Axovant Sciences Ltd. |
| Sector: Health Care | |
| SubSector: Biotechnology | |
| MarketCap: 1492.04 Millions | |
| Recent Price: 304.38 Smart Investing & Trading Score: 58 | |
| Day Percent Change: 0.93% Day Change: 2.81 | |
| Week Change: 3.67% Year-to-date Change: 17.8% | |
| AXON Links: Profile News Message Board | |
| Charts:- Daily , Weekly | |
| Add AXON to Watchlist: View: Get Complete AXON Trend Analysis ➞ | |
 | CHE Chemed Corporation |
| Sector: Health Care | |
| SubSector: Home Health Care | |
| MarketCap: 6148.95 Millions | |
| Recent Price: 621.25 Smart Investing & Trading Score: 58 | |
| Day Percent Change: 0.77% Day Change: 4.74 | |
| Week Change: 3.47% Year-to-date Change: 6.2% | |
| CHE Links: Profile News Message Board | |
| Charts:- Daily , Weekly | |
| Add CHE to Watchlist: View: Get Complete CHE Trend Analysis ➞ | |
 | BWXT BWX Technologies, Inc. |
| Sector: Industrials | |
| SubSector: Aerospace/Defense Products & Services | |
| MarketCap: 4085.41 Millions | |
| Recent Price: 94.42 Smart Investing & Trading Score: 58 | |
| Day Percent Change: 0.77% Day Change: 0.72 | |
| Week Change: 3.08% Year-to-date Change: 23.1% | |
| BWXT Links: Profile News Message Board | |
| Charts:- Daily , Weekly | |
| Add BWXT to Watchlist: View: Get Complete BWXT Trend Analysis ➞ | |
 | SSNC SS&C Technologies Holdings, Inc. |
| Sector: Technology | |
| SubSector: Business Software & Services | |
| MarketCap: 9884.08 Millions | |
| Recent Price: 61.38 Smart Investing & Trading Score: 58 | |
| Day Percent Change: 0.66% Day Change: 0.40 | |
| Week Change: 0.92% Year-to-date Change: 0.4% | |
| SSNC Links: Profile News Message Board | |
| Charts:- Daily , Weekly | |
| Add SSNC to Watchlist: View: Get Complete SSNC Trend Analysis ➞ | |
 | SITE SiteOne Landscape Supply, Inc. |
| Sector: Industrials | |
| SubSector: Small Tools & Accessories | |
| MarketCap: 2733.56 Millions | |
| Recent Price: 163.46 Smart Investing & Trading Score: 58 | |
| Day Percent Change: 0.50% Day Change: 0.81 | |
| Week Change: 4.82% Year-to-date Change: 0.6% | |
| SITE Links: Profile News Message Board | |
| Charts:- Daily , Weekly | |
| Add SITE to Watchlist: View: Get Complete SITE Trend Analysis ➞ | |
 | HST Host Hotels & Resorts, Inc. |
| Sector: Financials | |
| SubSector: REIT - Hotel/Motel | |
| MarketCap: 8253.74 Millions | |
| Recent Price: 19.38 Smart Investing & Trading Score: 58 | |
| Day Percent Change: 0.44% Day Change: 0.09 | |
| Week Change: 3.55% Year-to-date Change: -0.5% | |
| HST Links: Profile News Message Board | |
| Charts:- Daily , Weekly | |
| Add HST to Watchlist: View: Get Complete HST Trend Analysis ➞ | |
 | EHC Encompass Health Corporation |
| Sector: Health Care | |
| SubSector: Hospitals | |
| MarketCap: 5384.06 Millions | |
| Recent Price: 82.77 Smart Investing & Trading Score: 58 | |
| Day Percent Change: 0.38% Day Change: 0.31 | |
| Week Change: 4.48% Year-to-date Change: 24.1% | |
| EHC Links: Profile News Message Board | |
| Charts:- Daily , Weekly | |
| Add EHC to Watchlist: View: Get Complete EHC Trend Analysis ➞ | |
| For tabular summary view of above stock list: Summary View ➞ 0 - 25 , 25 - 50 , 50 - 75 , 75 - 100 , 100 - 125 , 125 - 150 , 150 - 175 , 175 - 200 , 200 - 225 , 225 - 250 , 250 - 275 , 275 - 300 , 300 - 325 , 325 - 350 , 350 - 375 , 375 - 400 , 400 - 425 , 425 - 450 , 450 - 475 , 475 - 500 , 500 - 525 , 525 - 550 , 550 - 575 , 575 - 600 , 600 - 625 , 625 - 650 , 650 - 675 , 675 - 700 , 700 - 725 , 725 - 750 , 750 - 775 | ||
| Click To Change The Sort Order: By Market Cap or Company Size Performance: Year-to-date, Week and Day | |
| Select Chart Type: | ||
|
Best Stocks Today 12Stocks.com |
© 2024 12Stocks.com Terms & Conditions Privacy Contact Us
All Information Provided Only For Education And Not To Be Used For Investing or Trading. See Terms & Conditions


One More Thing ... Get Best Stocks Delivered Daily!
Never Ever Miss A Move With Our Top Ten Stocks Lists
Find Best Stocks In Any Market - Bull or Bear Market
Take A Peek At Our Top Ten Stocks Lists: Daily, Weekly, Year-to-Date & Top Trends
Find Best Stocks In Any Market - Bull or Bear Market
Take A Peek At Our Top Ten Stocks Lists: Daily, Weekly, Year-to-Date & Top Trends
Midcap Stocks With Best Up Trends [0-bearish to 100-bullish]: Hasbro [100], Wabtec [100], Allegro Micro[100], Synchrony Financial[100], Virtu Financial[100], Kemper [100], EQT [100], Microchip [100], Mattel [100], Range Resources[100], Equity Residential[100]
Best Midcap Stocks Year-to-Date:
Vistra Energy[82.42%], AppLovin [74.52%], ShockWave Medical[72.27%], Constellation Energy[59.4%], EMCOR [56.6%], Spotify [49.86%], Natera [47.47%], Pure Storage[42.5%], Wingstop [42.21%], Williams-Sonoma [41.32%], NRG Energy[40.98%] Best Midcap Stocks This Week:
HashiCorp [23.7%], Globe Life[23.01%], Hasbro [17.18%], Tandem Diabetes[15.51%], Wabtec [13.26%], MongoDB [12.71%], Ryder System[10.52%], Watsco [10.33%], Microchip [9.78%], Coinbase Global[9.74%], Crane Co[9.5%] Best Midcap Stocks Daily:
Hasbro [11.39%], Wabtec [9.97%], CoStar [8.44%], Globe Life[8.37%], Allegro Micro[6.66%], Sarepta [6.36%], Watsco [5.89%], ON Semiconductor[5.38%], Synchrony Financial[5.11%], MSCI [5.03%], Virtu Financial[4.88%]