
 Login Sign Up


| |||||
 |  | ||||

| 12Stocks.com Market Intelligence |
Best MidCap Stocks
|
| In a hurry? Mid Cap Stocks Lists: Performance Trends Table, Stock Charts
Sort midcap stocks: Daily, Weekly, Year-to-Date, Market Cap & Trends. Filter midcap stocks list by sector: Show all, Tech, Finance, Energy, Staples, Retail, Industrial, Materials, Utilities and HealthCare Filter midcap stocks list by size:All MidCap Large Mid-Range Small |
| 12Stocks.com Mid Cap Stocks Performances & Trends Daily | |||||||||
|
|  The overall Smart Investing & Trading Score is 63 (0-bearish to 100-bullish) which puts Mid Cap index in short term neutral to bullish trend. The Smart Investing & Trading Score from previous trading session is 44 and an improvement of trend continues.
| ||||||||
Here are the Smart Investing & Trading Scores of the most requested mid cap stocks at 12Stocks.com (click stock name for detailed review):
|


| 12Stocks.com: Top Performing Mid Cap Index Stocks | ||||||||||||||||||||||||||||||||||||||||||||||||
 The top performing Mid Cap Index stocks year to date are
Now, more recently, over last week, the top performing Mid Cap Index stocks on the move are


|
||||||||||||||||||||||||||||||||||||||||||||||||
| 12Stocks.com: Investing in Midcap Index with Stocks | |
|
The following table helps investors and traders sort through current performance and trends (as measured by Smart Investing & Trading Score) of various
stocks in the Midcap Index. Quick View: Move mouse or cursor over stock symbol (ticker) to view short-term technical chart and over stock name to view long term chart. Click on  to add stock symbol to your watchlist and to add stock symbol to your watchlist and  to view watchlist. Click on any ticker or stock name for detailed market intelligence report for that stock. to view watchlist. Click on any ticker or stock name for detailed market intelligence report for that stock. |
12Stocks.com Performance of Stocks in Midcap Index
| Ticker | Stock Name | Watchlist | Category | Recent Price | Smart Investing & Trading Score | Change % | YTD Change% |
| RLI | RLI |   | Financials | 147.71 | 100 | 1.34% | 10.96% |
| DTE | DTE Energy | | Utilities | 111.55 | 100 | 1.30% | 1.17% |
| CPB | Campbell Soup | | Consumer Staples | 45.54 | 100 | 1.29% | 5.34% |
| YUM | Yum! | | Services & Goods | 141.81 | 100 | 1.22% | 8.53% |
| CNP | CenterPoint Energy | | Utilities | 29.07 | 100 | 1.18% | 1.75% |
| FHB | First Hawaiian | | Financials | 22.20 | 100 | 1.12% | -2.87% |
| HBAN | Huntington Bancshares | | Financials | 13.78 | 100 | 1.06% | 8.29% |
| K | Kellogg | | Consumer Staples | 58.75 | 100 | 1.05% | 5.08% |
| CAG | Conagra | | Consumer Staples | 31.57 | 100 | 0.96% | 10.15% |
| HCP | HashiCorp | | Technology | 29.65 | 100 | 0.95% | 22.93% |
| NI | NiSource | | Utilities | 28.18 | 100 | 0.90% | 6.14% |
| BK | Bank of New York | | Financials | 57.95 | 100 | 0.89% | 11.34% |
| MAN | Manpower | | Services & Goods | 77.10 | 100 | 0.86% | -2.98% |
| WEC | WEC Energy | | Utilities | 82.63 | 100 | 0.82% | -1.83% |
| LNT | Alliant Energy | | Utilities | 50.37 | 100 | 0.80% | -1.81% |
| GNRC | Generac | | Industrials | 137.18 | 100 | 0.79% | 6.14% |
| SLM | SLM | | Financials | 22.10 | 100 | 0.78% | 15.59% |
| MTB | M&T Bank | | Financials | 147.96 | 100 | 0.75% | 7.94% |
| FRT | Federal Realty | | Financials | 103.60 | 100 | 0.71% | 0.53% |
| ED | Consolidated Edison | | Utilities | 93.43 | 100 | 0.64% | 2.70% |
| DGX | Quest Diagnostics | | Health Care | 137.55 | 100 | 0.62% | -0.24% |
| BPOP | Popular | | Financials | 88.41 | 100 | 0.60% | 7.73% |
| TSN | Tyson Foods | | Consumer Staples | 61.32 | 100 | 0.56% | 14.08% |
| FITB | Fifth Third | | Financials | 37.24 | 100 | 0.49% | 7.97% |
| R | Ryder System | | Transports | 122.19 | 100 | 0.15% | 6.20% |
| For chart view version of above stock list: Chart View ➞ 0 - 25 , 25 - 50 , 50 - 75 , 75 - 100 , 100 - 125 , 125 - 150 , 150 - 175 , 175 - 200 , 200 - 225 , 225 - 250 , 250 - 275 , 275 - 300 , 300 - 325 , 325 - 350 , 350 - 375 , 375 - 400 , 400 - 425 , 425 - 450 , 450 - 475 , 475 - 500 , 500 - 525 , 525 - 550 , 550 - 575 , 575 - 600 , 600 - 625 , 625 - 650 , 650 - 675 , 675 - 700 , 700 - 725 , 725 - 750 , 750 - 775 | ||
 | Click To Change The Sort Order: By Market Cap or Company Size Performance: Year-to-date, Week and Day |  |
|
Get the most comprehensive stock market coverage daily at 12Stocks.com ➞ Best Stocks Today ➞ Best Stocks Weekly ➞ Best Stocks Year-to-Date ➞ Best Stocks Trends ➞  Best Stocks Today 12Stocks.com Best Nasdaq Stocks ➞ Best S&P 500 Stocks ➞ Best Tech Stocks ➞ Best Biotech Stocks ➞ |
| Detailed Overview of Midcap Stocks |
| Midcap Technical Overview, Leaders & Laggards, Top Midcap ETF Funds & Detailed Midcap Stocks List, Charts, Trends & More |
| Midcap: Technical Analysis, Trends & YTD Performance | |
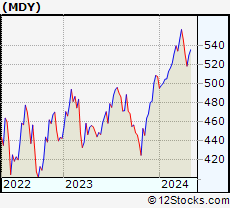
| MidCap segment as represented by
MDY, an exchange-traded fund [ETF], holds basket of about four hundred midcap stocks from across all major sectors of the US stock market. The midcap index (contains stocks like Green Mountain Coffee Roasters and Tractor Supply Company) is up by 4.42% and is currently underperforming the overall market by -1.24% year-to-date. Below is a quick view of technical charts and trends: | |
 MDY Weekly Chart |
|
| Long Term Trend: Very Good | |
| Medium Term Trend: Not Good | |
 MDY Daily Chart |
|
| Short Term Trend: Very Good | |
| Overall Trend Score: 63 | |
| YTD Performance: 4.42% | |
| **Trend Scores & Views Are Only For Educational Purposes And Not For Investing | |
| 12Stocks.com: Investing in Midcap Index using Exchange Traded Funds | |
|
The following table shows list of key exchange traded funds (ETF) that
help investors track Midcap index. The following list also includes leveraged ETF funds that track twice or thrice the daily returns of Midcap indices. Short or inverse ETF funds move in the opposite direction to the index they track and are useful during market pullbacks or during bear markets. Quick View: Move mouse or cursor over ETF symbol (ticker) to view short-term technical chart and over ETF name to view long term chart. Click on ticker or stock name for detailed view. Click on to add stock symbol to your watchlist and to view watchlist. |
12Stocks.com List of ETFs that track Midcap Index
| Ticker | ETF Name | Watchlist | Recent Price | Smart Investing & Trading Score | Change % | Week % | Year-to-date % |
| IJH | iShares Core S&P Mid-Cap | | 57.87 | 68 | 0.03 | 2.28 | 4.4% |
| IWR | iShares Russell Mid-Cap | | 80.41 | 48 | 0.05 | 2.22 | 3.45% |
| MDY | SPDR S&P MidCap 400 ETF | | 529.80 | 63 | 0.00 | 2.22 | 4.42% |
| IWP | iShares Russell Mid-Cap Growth | | 108.49 | 43 | -0.13 | 2.64 | 3.86% |
| IJK | iShares S&P Mid-Cap 400 Growth | | 86.99 | 48 | 0.07 | 2.52 | 9.81% |
| IWS | iShares Russell Mid-Cap Value | | 119.97 | 68 | 0.09 | 1.97 | 3.16% |
| IJJ | iShares S&P Mid-Cap 400 Value | | 112.59 | 41 | 0.11 | 1.85 | -1.27% |
| XMLV | PowerShares S&P MidCap Low Volatil ETF | | 55.00 | 60 | 0.16 | 1.55 | 3.42% |
| MVV | ProShares Ultra MidCap400 | | 61.60 | 41 | 0.10 | 4.41 | 6.41% |
| UMDD | ProShares UltraPro MidCap400 | | 24.09 | 63 | -0.08 | 6.77 | 7.93% |
| SMDD | ProShares UltraPro Short MidCap400 | | 11.65 | 32 | -0.01 | -7.27 | -13.47% |
| MYY | ProShares Short MidCap400 | | 20.74 | 32 | 0.00 | -2.12 | -3.33% |
| MZZ | ProShares UltraShort MidCap400 | | 11.77 | 34 | 0.94 | -3.29 | -6.37% |
| 12Stocks.com: Charts, Trends, Fundamental Data and Performances of MidCap Stocks | |
|
We now take in-depth look at all MidCap stocks including charts, multi-period performances and overall trends (as measured by Smart Investing & Trading Score). One can sort MidCap stocks (click link to choose) by Daily, Weekly and by Year-to-Date performances. Also, one can sort by size of the company or by market capitalization. |
| Select Your Default Chart Type: | |||||
| |||||
| Click on stock symbol or name for detailed view. Click on to add stock symbol to your watchlist and to view watchlist. Quick View: Move mouse or cursor over "Daily" to quickly view daily technical stock chart and over "Weekly" to view weekly technical stock chart. | |||||

 | RLI RLI Corp. |
| Sector: Financials | |
| SubSector: Property & Casualty Insurance | |
| MarketCap: 3534.92 Millions | |
| Recent Price: 147.71 Smart Investing & Trading Score: 100 | |
| Day Percent Change: 1.34% Day Change: 1.95 | |
| Week Change: 5.35% Year-to-date Change: 11.0% | |
| RLI Links: Profile News Message Board | |
| Charts:- Daily , Weekly | |
| Add RLI to Watchlist: View: Get Complete RLI Trend Analysis ➞ | |
 | DTE DTE Energy Company |
| Sector: Utilities | |
| SubSector: Electric Utilities | |
| MarketCap: 18218.1 Millions | |
| Recent Price: 111.55 Smart Investing & Trading Score: 100 | |
| Day Percent Change: 1.30% Day Change: 1.43 | |
| Week Change: 2.74% Year-to-date Change: 1.2% | |
| DTE Links: Profile News Message Board | |
| Charts:- Daily , Weekly | |
| Add DTE to Watchlist: View: Get Complete DTE Trend Analysis ➞ | |
 | CPB Campbell Soup Company |
| Sector: Consumer Staples | |
| SubSector: Processed & Packaged Goods | |
| MarketCap: 14468.8 Millions | |
| Recent Price: 45.54 Smart Investing & Trading Score: 100 | |
| Day Percent Change: 1.29% Day Change: 0.58 | |
| Week Change: 3.03% Year-to-date Change: 5.3% | |
| CPB Links: Profile News Message Board | |
| Charts:- Daily , Weekly | |
| Add CPB to Watchlist: View: Get Complete CPB Trend Analysis ➞ | |
 | YUM Yum! Brands, Inc. |
| Sector: Services & Goods | |
| SubSector: Restaurants | |
| MarketCap: 18033.3 Millions | |
| Recent Price: 141.81 Smart Investing & Trading Score: 100 | |
| Day Percent Change: 1.22% Day Change: 1.71 | |
| Week Change: 2.39% Year-to-date Change: 8.5% | |
| YUM Links: Profile News Message Board | |
| Charts:- Daily , Weekly | |
| Add YUM to Watchlist: View: Get Complete YUM Trend Analysis ➞ | |
 | CNP CenterPoint Energy, Inc. |
| Sector: Utilities | |
| SubSector: Gas Utilities | |
| MarketCap: 7444.07 Millions | |
| Recent Price: 29.07 Smart Investing & Trading Score: 100 | |
| Day Percent Change: 1.18% Day Change: 0.34 | |
| Week Change: 1.89% Year-to-date Change: 1.8% | |
| CNP Links: Profile News Message Board | |
| Charts:- Daily , Weekly | |
| Add CNP to Watchlist: View: Get Complete CNP Trend Analysis ➞ | |
 | FHB First Hawaiian, Inc. |
| Sector: Financials | |
| SubSector: Regional - Pacific Banks | |
| MarketCap: 2398.99 Millions | |
| Recent Price: 22.20 Smart Investing & Trading Score: 100 | |
| Day Percent Change: 1.12% Day Change: 0.24 | |
| Week Change: 5.74% Year-to-date Change: -2.9% | |
| FHB Links: Profile News Message Board | |
| Charts:- Daily , Weekly | |
| Add FHB to Watchlist: View: Get Complete FHB Trend Analysis ➞ | |
 | HBAN Huntington Bancshares Incorporated |
| Sector: Financials | |
| SubSector: Regional - Midwest Banks | |
| MarketCap: 8468.1 Millions | |
| Recent Price: 13.78 Smart Investing & Trading Score: 100 | |
| Day Percent Change: 1.06% Day Change: 0.14 | |
| Week Change: 3.73% Year-to-date Change: 8.3% | |
| HBAN Links: Profile News Message Board | |
| Charts:- Daily , Weekly | |
| Add HBAN to Watchlist: View: Get Complete HBAN Trend Analysis ➞ | |
 | K Kellogg Company |
| Sector: Consumer Staples | |
| SubSector: Processed & Packaged Goods | |
| MarketCap: 20264.6 Millions | |
| Recent Price: 58.75 Smart Investing & Trading Score: 100 | |
| Day Percent Change: 1.05% Day Change: 0.61 | |
| Week Change: 2.39% Year-to-date Change: 5.1% | |
| K Links: Profile News Message Board | |
| Charts:- Daily , Weekly | |
| Add K to Watchlist: View: Get Complete K Trend Analysis ➞ | |
 | CAG Conagra Brands, Inc. |
| Sector: Consumer Staples | |
| SubSector: Processed & Packaged Goods | |
| MarketCap: 14084.1 Millions | |
| Recent Price: 31.57 Smart Investing & Trading Score: 100 | |
| Day Percent Change: 0.96% Day Change: 0.30 | |
| Week Change: 3.1% Year-to-date Change: 10.2% | |
| CAG Links: Profile News Message Board | |
| Charts:- Daily , Weekly | |
| Add CAG to Watchlist: View: Get Complete CAG Trend Analysis ➞ | |
 | HCP HashiCorp, Inc. |
| Sector: Technology | |
| SubSector: Software - Infrastructure | |
| MarketCap: 5070 Millions | |
| Recent Price: 29.65 Smart Investing & Trading Score: 100 | |
| Day Percent Change: 0.95% Day Change: 0.28 | |
| Week Change: 23.7% Year-to-date Change: 22.9% | |
| HCP Links: Profile News Message Board | |
| Charts:- Daily , Weekly | |
| Add HCP to Watchlist: View: Get Complete HCP Trend Analysis ➞ | |
 | NI NiSource Inc. |
| Sector: Utilities | |
| SubSector: Diversified Utilities | |
| MarketCap: 9056.8 Millions | |
| Recent Price: 28.18 Smart Investing & Trading Score: 100 | |
| Day Percent Change: 0.90% Day Change: 0.25 | |
| Week Change: 2.18% Year-to-date Change: 6.1% | |
| NI Links: Profile News Message Board | |
| Charts:- Daily , Weekly | |
| Add NI to Watchlist: View: Get Complete NI Trend Analysis ➞ | |
 | BK The Bank of New York Mellon Corporation |
| Sector: Financials | |
| SubSector: Asset Management | |
| MarketCap: 29807.5 Millions | |
| Recent Price: 57.95 Smart Investing & Trading Score: 100 | |
| Day Percent Change: 0.89% Day Change: 0.51 | |
| Week Change: 2.95% Year-to-date Change: 11.3% | |
| BK Links: Profile News Message Board | |
| Charts:- Daily , Weekly | |
| Add BK to Watchlist: View: Get Complete BK Trend Analysis ➞ | |
 | MAN ManpowerGroup Inc. |
| Sector: Services & Goods | |
| SubSector: Staffing & Outsourcing Services | |
| MarketCap: 3436.28 Millions | |
| Recent Price: 77.10 Smart Investing & Trading Score: 100 | |
| Day Percent Change: 0.86% Day Change: 0.66 | |
| Week Change: 3.02% Year-to-date Change: -3.0% | |
| MAN Links: Profile News Message Board | |
| Charts:- Daily , Weekly | |
| Add MAN to Watchlist: View: Get Complete MAN Trend Analysis ➞ | |
 | WEC WEC Energy Group, Inc. |
| Sector: Utilities | |
| SubSector: Electric Utilities | |
| MarketCap: 24852 Millions | |
| Recent Price: 82.63 Smart Investing & Trading Score: 100 | |
| Day Percent Change: 0.82% Day Change: 0.67 | |
| Week Change: 1.31% Year-to-date Change: -1.8% | |
| WEC Links: Profile News Message Board | |
| Charts:- Daily , Weekly | |
| Add WEC to Watchlist: View: Get Complete WEC Trend Analysis ➞ | |
 | LNT Alliant Energy Corporation |
| Sector: Utilities | |
| SubSector: Electric Utilities | |
| MarketCap: 10678.4 Millions | |
| Recent Price: 50.37 Smart Investing & Trading Score: 100 | |
| Day Percent Change: 0.80% Day Change: 0.40 | |
| Week Change: 1.1% Year-to-date Change: -1.8% | |
| LNT Links: Profile News Message Board | |
| Charts:- Daily , Weekly | |
| Add LNT to Watchlist: View: Get Complete LNT Trend Analysis ➞ | |
 | GNRC Generac Holdings Inc. |
| Sector: Industrials | |
| SubSector: Diversified Machinery | |
| MarketCap: 5736.26 Millions | |
| Recent Price: 137.18 Smart Investing & Trading Score: 100 | |
| Day Percent Change: 0.79% Day Change: 1.08 | |
| Week Change: 1.5% Year-to-date Change: 6.1% | |
| GNRC Links: Profile News Message Board | |
| Charts:- Daily , Weekly | |
| Add GNRC to Watchlist: View: Get Complete GNRC Trend Analysis ➞ | |
 | SLM SLM Corporation |
| Sector: Financials | |
| SubSector: Credit Services | |
| MarketCap: 3099.78 Millions | |
| Recent Price: 22.10 Smart Investing & Trading Score: 100 | |
| Day Percent Change: 0.78% Day Change: 0.17 | |
| Week Change: 4.79% Year-to-date Change: 15.6% | |
| SLM Links: Profile News Message Board | |
| Charts:- Daily , Weekly | |
| Add SLM to Watchlist: View: Get Complete SLM Trend Analysis ➞ | |
 | MTB M&T Bank Corporation |
| Sector: Financials | |
| SubSector: Regional - Northeast Banks | |
| MarketCap: 13950.9 Millions | |
| Recent Price: 147.96 Smart Investing & Trading Score: 100 | |
| Day Percent Change: 0.75% Day Change: 1.10 | |
| Week Change: 3.19% Year-to-date Change: 7.9% | |
| MTB Links: Profile News Message Board | |
| Charts:- Daily , Weekly | |
| Add MTB to Watchlist: View: Get Complete MTB Trend Analysis ➞ | |
 | FRT Federal Realty Investment Trust |
| Sector: Financials | |
| SubSector: REIT - Retail | |
| MarketCap: 5878.64 Millions | |
| Recent Price: 103.60 Smart Investing & Trading Score: 100 | |
| Day Percent Change: 0.71% Day Change: 0.73 | |
| Week Change: 3.84% Year-to-date Change: 0.5% | |
| FRT Links: Profile News Message Board | |
| Charts:- Daily , Weekly | |
| Add FRT to Watchlist: View: Get Complete FRT Trend Analysis ➞ | |
 | ED Consolidated Edison, Inc. |
| Sector: Utilities | |
| SubSector: Electric Utilities | |
| MarketCap: 25012.3 Millions | |
| Recent Price: 93.43 Smart Investing & Trading Score: 100 | |
| Day Percent Change: 0.64% Day Change: 0.59 | |
| Week Change: 1.81% Year-to-date Change: 2.7% | |
| ED Links: Profile News Message Board | |
| Charts:- Daily , Weekly | |
| Add ED to Watchlist: View: Get Complete ED Trend Analysis ➞ | |
 | DGX Quest Diagnostics Incorporated |
| Sector: Health Care | |
| SubSector: Medical Laboratories & Research | |
| MarketCap: 11076.1 Millions | |
| Recent Price: 137.55 Smart Investing & Trading Score: 100 | |
| Day Percent Change: 0.62% Day Change: 0.85 | |
| Week Change: 7.09% Year-to-date Change: -0.2% | |
| DGX Links: Profile News Message Board | |
| Charts:- Daily , Weekly | |
| Add DGX to Watchlist: View: Get Complete DGX Trend Analysis ➞ | |
 | BPOP Popular, Inc. |
| Sector: Financials | |
| SubSector: Foreign Regional Banks | |
| MarketCap: 2671.99 Millions | |
| Recent Price: 88.41 Smart Investing & Trading Score: 100 | |
| Day Percent Change: 0.60% Day Change: 0.53 | |
| Week Change: 6.26% Year-to-date Change: 7.7% | |
| BPOP Links: Profile News Message Board | |
| Charts:- Daily , Weekly | |
| Add BPOP to Watchlist: View: Get Complete BPOP Trend Analysis ➞ | |
 | TSN Tyson Foods, Inc. |
| Sector: Consumer Staples | |
| SubSector: Meat Products | |
| MarketCap: 22124.1 Millions | |
| Recent Price: 61.32 Smart Investing & Trading Score: 100 | |
| Day Percent Change: 0.56% Day Change: 0.34 | |
| Week Change: 2.29% Year-to-date Change: 14.1% | |
| TSN Links: Profile News Message Board | |
| Charts:- Daily , Weekly | |
| Add TSN to Watchlist: View: Get Complete TSN Trend Analysis ➞ | |
 | FITB Fifth Third Bancorp |
| Sector: Financials | |
| SubSector: Regional - Midwest Banks | |
| MarketCap: 10197 Millions | |
| Recent Price: 37.24 Smart Investing & Trading Score: 100 | |
| Day Percent Change: 0.49% Day Change: 0.18 | |
| Week Change: 2.73% Year-to-date Change: 8.0% | |
| FITB Links: Profile News Message Board | |
| Charts:- Daily , Weekly | |
| Add FITB to Watchlist: View: Get Complete FITB Trend Analysis ➞ | |
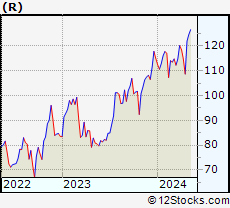 | R Ryder System, Inc. |
| Sector: Transports | |
| SubSector: Rental & Leasing Services | |
| MarketCap: 1550.94 Millions | |
| Recent Price: 122.19 Smart Investing & Trading Score: 100 | |
| Day Percent Change: 0.15% Day Change: 0.18 | |
| Week Change: 12.4% Year-to-date Change: 6.2% | |
| R Links: Profile News Message Board | |
| Charts:- Daily , Weekly | |
| Add R to Watchlist: View: Get Complete R Trend Analysis ➞ | |
| For tabular summary view of above stock list: Summary View ➞ 0 - 25 , 25 - 50 , 50 - 75 , 75 - 100 , 100 - 125 , 125 - 150 , 150 - 175 , 175 - 200 , 200 - 225 , 225 - 250 , 250 - 275 , 275 - 300 , 300 - 325 , 325 - 350 , 350 - 375 , 375 - 400 , 400 - 425 , 425 - 450 , 450 - 475 , 475 - 500 , 500 - 525 , 525 - 550 , 550 - 575 , 575 - 600 , 600 - 625 , 625 - 650 , 650 - 675 , 675 - 700 , 700 - 725 , 725 - 750 , 750 - 775 | ||
| Click To Change The Sort Order: By Market Cap or Company Size Performance: Year-to-date, Week and Day | |
| Select Chart Type: | ||
|
Best Stocks Today 12Stocks.com |
© 2024 12Stocks.com Terms & Conditions Privacy Contact Us
All Information Provided Only For Education And Not To Be Used For Investing or Trading. See Terms & Conditions


One More Thing ... Get Best Stocks Delivered Daily!
Never Ever Miss A Move With Our Top Ten Stocks Lists
Find Best Stocks In Any Market - Bull or Bear Market
Take A Peek At Our Top Ten Stocks Lists: Daily, Weekly, Year-to-Date & Top Trends
Find Best Stocks In Any Market - Bull or Bear Market
Take A Peek At Our Top Ten Stocks Lists: Daily, Weekly, Year-to-Date & Top Trends
Midcap Stocks With Best Up Trends [0-bearish to 100-bullish]: Hasbro [100], Wabtec [100], Allegro Micro[100], Microchip [100], Synchrony Financial[100], EQT [100], Kemper [100], Range Resources[100], Virtu Financial[100], Crane Co[100], National Fuel[100]
Best Midcap Stocks Year-to-Date:
Vistra Energy[82.92%], AppLovin [74.52%], ShockWave Medical[72.42%], Constellation Energy[59.4%], EMCOR [57.31%], Spotify [49.66%], Natera [46.02%], Pure Storage[42.04%], Williams-Sonoma [41.5%], Wingstop [41.37%], NRG Energy[40.44%] Best Midcap Stocks This Week:
HashiCorp [23.7%], Globe Life[17.77%], Hasbro [17.66%], Tandem Diabetes[15.51%], Wabtec [13.32%], MongoDB [12.85%], Ryder System[12.4%], Microchip [11.07%], Watsco [11%], Crane Co[9.77%], Coinbase Global[9.74%] Best Midcap Stocks Daily:
Hasbro [11.85%], Wabtec [10.04%], CoStar [8.74%], Allegro Micro[8.24%], GameStop [7.58%], Watsco [6.54%], Hertz Global[6.41%], ON Semiconductor[6.26%], Sarepta [6.10%], Lattice Semiconductor[5.34%], Microchip [5.26%]