
 Login Sign Up


| |||||
 |  | ||||

| 12Stocks.com Market Intelligence |
Best MidCap Stocks
|
| In a hurry? Mid Cap Stocks Lists: Performance Trends Table, Stock Charts
Sort midcap stocks: Daily, Weekly, Year-to-Date, Market Cap & Trends. Filter midcap stocks list by sector: Show all, Tech, Finance, Energy, Staples, Retail, Industrial, Materials, Utilities and HealthCare Filter midcap stocks list by size:All MidCap Large Mid-Range Small |
| 12Stocks.com Mid Cap Stocks Performances & Trends Daily | |||||||||
|
|  The overall Smart Investing & Trading Score is 44 (0-bearish to 100-bullish) which puts Mid Cap index in short term neutral trend. The Smart Investing & Trading Score from previous trading session is 36 and hence an improvement of trend.
| ||||||||
Here are the Smart Investing & Trading Scores of the most requested mid cap stocks at 12Stocks.com (click stock name for detailed review):
|


| 12Stocks.com: Top Performing Mid Cap Index Stocks | ||||||||||||||||||||||||||||||||||||||||||||||||
 The top performing Mid Cap Index stocks year to date are
Now, more recently, over last week, the top performing Mid Cap Index stocks on the move are


|
||||||||||||||||||||||||||||||||||||||||||||||||
| 12Stocks.com: Investing in Midcap Index with Stocks | |
|
The following table helps investors and traders sort through current performance and trends (as measured by Smart Investing & Trading Score) of various
stocks in the Midcap Index. Quick View: Move mouse or cursor over stock symbol (ticker) to view short-term technical chart and over stock name to view long term chart. Click on  to add stock symbol to your watchlist and to add stock symbol to your watchlist and  to view watchlist. Click on any ticker or stock name for detailed market intelligence report for that stock. to view watchlist. Click on any ticker or stock name for detailed market intelligence report for that stock. |
12Stocks.com Performance of Stocks in Midcap Index
| Ticker | Stock Name | Watchlist | Category | Recent Price | Smart Investing & Trading Score | Change % | YTD Change% |
| PAYX | Paychex |   | Services & Goods | 119.52 | 17 | 1.47 | 0.34% |
| OHI | Omega | | Financials | 30.42 | 58 | 1.47 | -0.78% |
| CLH | Clean Harbors | | Industrials | 193.71 | 56 | 1.47 | 11.00% |
| CACI | CACI | | Technology | 369.38 | 68 | 1.46 | 14.06% |
| FWONA | Formula One | | Services & Goods | 60.53 | 64 | 1.46 | 4.40% |
| FE | FirstEnergy | | Utilities | 38.17 | 73 | 1.44 | 4.12% |
| R | Ryder System | | Transports | 108.71 | 10 | 1.44 | -5.52% |
| MKL | Markel | | Financials | 1456.69 | 32 | 1.43 | 2.59% |
| SAIC | Science Applications | | Technology | 124.94 | 25 | 1.43 | 0.50% |
| RRC | Range Resources | | Energy | 35.27 | 88 | 1.41 | 15.87% |
| CBSH | Commerce Bancshares | | Financials | 53.85 | 93 | 1.41 | 0.82% |
| WEC | WEC Energy | | Utilities | 81.56 | 86 | 1.39 | -3.10% |
| RUN | Sunrun | | Technology | 10.25 | 10 | 1.38 | -47.78% |
| DVA | DaVita | | Health Care | 127.82 | 41 | 1.36 | 22.01% |
| GPC | Genuine Parts | | Services & Goods | 162.39 | 100 | 1.35 | 17.25% |
| NOV | National Oilwell | | Energy | 18.75 | 28 | 1.35 | -7.54% |
| LYB | LyondellBasell Industries | | Materials | 100.74 | 63 | 1.35 | 5.95% |
| RJF | Raymond James | | Financials | 123.60 | 68 | 1.34 | 10.85% |
| COLM | Columbia Sportswear | | Consumer Staples | 76.55 | 42 | 1.34 | -3.76% |
| QGEN | QIAGEN N.V | | Services & Goods | 40.00 | 32 | 1.34 | -7.90% |
| VICI | VICI Properties | | Financials | 27.89 | 32 | 1.34 | -12.52% |
| NLY | Annaly Capital | | Financials | 18.23 | 32 | 1.33 | -5.89% |
| PNFP | Pinnacle Financial | | Financials | 79.50 | 25 | 1.33 | -8.85% |
| WEN | Wendy s | | Services & Goods | 19.25 | 100 | 1.32 | -1.18% |
| ADC | Agree Realty | | Financials | 56.56 | 52 | 1.31 | -10.15% |
| For chart view version of above stock list: Chart View ➞ 0 - 25 , 25 - 50 , 50 - 75 , 75 - 100 , 100 - 125 , 125 - 150 , 150 - 175 , 175 - 200 , 200 - 225 , 225 - 250 , 250 - 275 , 275 - 300 , 300 - 325 , 325 - 350 , 350 - 375 , 375 - 400 , 400 - 425 , 425 - 450 , 450 - 475 , 475 - 500 , 500 - 525 , 525 - 550 , 550 - 575 , 575 - 600 , 600 - 625 , 625 - 650 , 650 - 675 , 675 - 700 , 700 - 725 , 725 - 750 , 750 - 775 | ||
 | Click To Change The Sort Order: By Market Cap or Company Size Performance: Year-to-date, Week and Day |  |
|
Get the most comprehensive stock market coverage daily at 12Stocks.com ➞ Best Stocks Today ➞ Best Stocks Weekly ➞ Best Stocks Year-to-Date ➞ Best Stocks Trends ➞  Best Stocks Today 12Stocks.com Best Nasdaq Stocks ➞ Best S&P 500 Stocks ➞ Best Tech Stocks ➞ Best Biotech Stocks ➞ |
| Detailed Overview of Midcap Stocks |
| Midcap Technical Overview, Leaders & Laggards, Top Midcap ETF Funds & Detailed Midcap Stocks List, Charts, Trends & More |
| Midcap: Technical Analysis, Trends & YTD Performance | |
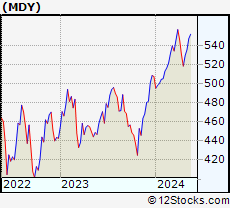
| MidCap segment as represented by
MDY, an exchange-traded fund [ETF], holds basket of about four hundred midcap stocks from across all major sectors of the US stock market. The midcap index (contains stocks like Green Mountain Coffee Roasters and Tractor Supply Company) is up by 2.15% and is currently underperforming the overall market by -1.23% year-to-date. Below is a quick view of technical charts and trends: | |
 MDY Weekly Chart |
|
| Long Term Trend: Good | |
| Medium Term Trend: Not Good | |
 MDY Daily Chart |
|
| Short Term Trend: Deteriorating | |
| Overall Trend Score: 44 | |
| YTD Performance: 2.15% | |
| **Trend Scores & Views Are Only For Educational Purposes And Not For Investing | |
| 12Stocks.com: Investing in Midcap Index using Exchange Traded Funds | |
|
The following table shows list of key exchange traded funds (ETF) that
help investors track Midcap index. The following list also includes leveraged ETF funds that track twice or thrice the daily returns of Midcap indices. Short or inverse ETF funds move in the opposite direction to the index they track and are useful during market pullbacks or during bear markets. Quick View: Move mouse or cursor over ETF symbol (ticker) to view short-term technical chart and over ETF name to view long term chart. Click on ticker or stock name for detailed view. Click on to add stock symbol to your watchlist and to view watchlist. |
12Stocks.com List of ETFs that track Midcap Index
| Ticker | ETF Name | Watchlist | Recent Price | Smart Investing & Trading Score | Change % | Week % | Year-to-date % |
| IJH | iShares Core S&P Mid-Cap | | 56.58 | 44 | 0.27 | -2.26 | 2.07% |
| IWR | iShares Russell Mid-Cap | | 78.66 | 44 | -0.06 | -2.43 | 1.2% |
| IWP | iShares Russell Mid-Cap Growth | | 105.70 | 36 | -0.75 | -3.77 | 1.19% |
| MDY | SPDR S&P MidCap 400 ETF | | 518.28 | 44 | 0.33 | -2.2 | 2.15% |
| IWS | iShares Russell Mid-Cap Value | | 117.65 | 49 | 0.29 | -1.87 | 1.17% |
| IJK | iShares S&P Mid-Cap 400 Growth | | 84.85 | 36 | -0.21 | -3.01 | 7.11% |
| IJJ | iShares S&P Mid-Cap 400 Value | | 110.55 | 38 | 1.00 | -1.29 | -3.06% |
| XMLV | PowerShares S&P MidCap Low Volatil ETF | | 54.16 | 68 | 1.06 | -0.17 | 1.84% |
| MVV | ProShares Ultra MidCap400 | | 59.00 | 36 | 0.99 | -4.42 | 1.92% |
| SMDD | ProShares UltraPro Short MidCap400 | | 12.56 | 54 | -1.00 | 6.92 | -6.69% |
| MZZ | ProShares UltraShort MidCap400 | | 12.17 | 34 | -0.49 | 4.92 | -3.18% |
| UMDD | ProShares UltraPro MidCap400 | | 22.56 | 36 | 1.14 | -6.66 | 1.09% |
| MYY | ProShares Short MidCap400 | | 21.19 | 69 | -0.33 | 2.35 | -1.24% |
| 12Stocks.com: Charts, Trends, Fundamental Data and Performances of MidCap Stocks | |
|
We now take in-depth look at all MidCap stocks including charts, multi-period performances and overall trends (as measured by Smart Investing & Trading Score). One can sort MidCap stocks (click link to choose) by Daily, Weekly and by Year-to-Date performances. Also, one can sort by size of the company or by market capitalization. |
| Select Your Default Chart Type: | |||||
| |||||
| Click on stock symbol or name for detailed view. Click on to add stock symbol to your watchlist and to view watchlist. Quick View: Move mouse or cursor over "Daily" to quickly view daily technical stock chart and over "Weekly" to view weekly technical stock chart. | |||||

 | PAYX Paychex, Inc. |
| Sector: Services & Goods | |
| SubSector: Staffing & Outsourcing Services | |
| MarketCap: 20928.8 Millions | |
| Recent Price: 119.52 Smart Investing & Trading Score: 17 | |
| Day Percent Change: 1.47% Day Change: 1.73 | |
| Week Change: -2.83% Year-to-date Change: 0.3% | |
| PAYX Links: Profile News Message Board | |
| Charts:- Daily , Weekly | |
| Add PAYX to Watchlist: View: Get Complete PAYX Trend Analysis ➞ | |
 | OHI Omega Healthcare Investors, Inc. |
| Sector: Financials | |
| SubSector: REIT - Healthcare Facilities | |
| MarketCap: 6433.84 Millions | |
| Recent Price: 30.42 Smart Investing & Trading Score: 58 | |
| Day Percent Change: 1.47% Day Change: 0.44 | |
| Week Change: -0.26% Year-to-date Change: -0.8% | |
| OHI Links: Profile News Message Board | |
| Charts:- Daily , Weekly | |
| Add OHI to Watchlist: View: Get Complete OHI Trend Analysis ➞ | |
 | CLH Clean Harbors, Inc. |
| Sector: Industrials | |
| SubSector: Waste Management | |
| MarketCap: 2391.28 Millions | |
| Recent Price: 193.71 Smart Investing & Trading Score: 56 | |
| Day Percent Change: 1.47% Day Change: 2.81 | |
| Week Change: -1.56% Year-to-date Change: 11.0% | |
| CLH Links: Profile News Message Board | |
| Charts:- Daily , Weekly | |
| Add CLH to Watchlist: View: Get Complete CLH Trend Analysis ➞ | |
 | CACI CACI International Inc |
| Sector: Technology | |
| SubSector: Information Technology Services | |
| MarketCap: 5211.58 Millions | |
| Recent Price: 369.38 Smart Investing & Trading Score: 68 | |
| Day Percent Change: 1.46% Day Change: 5.32 | |
| Week Change: 0.45% Year-to-date Change: 14.1% | |
| CACI Links: Profile News Message Board | |
| Charts:- Daily , Weekly | |
| Add CACI to Watchlist: View: Get Complete CACI Trend Analysis ➞ | |
 | FWONA Formula One Group |
| Sector: Services & Goods | |
| SubSector: Broadcasting - TV | |
| MarketCap: 17485.6 Millions | |
| Recent Price: 60.53 Smart Investing & Trading Score: 64 | |
| Day Percent Change: 1.46% Day Change: 0.87 | |
| Week Change: -1.14% Year-to-date Change: 4.4% | |
| FWONA Links: Profile News Message Board | |
| Charts:- Daily , Weekly | |
| Add FWONA to Watchlist: View: Get Complete FWONA Trend Analysis ➞ | |
 | FE FirstEnergy Corp. |
| Sector: Utilities | |
| SubSector: Electric Utilities | |
| MarketCap: 20754.1 Millions | |
| Recent Price: 38.17 Smart Investing & Trading Score: 73 | |
| Day Percent Change: 1.44% Day Change: 0.54 | |
| Week Change: 2.03% Year-to-date Change: 4.1% | |
| FE Links: Profile News Message Board | |
| Charts:- Daily , Weekly | |
| Add FE to Watchlist: View: Get Complete FE Trend Analysis ➞ | |
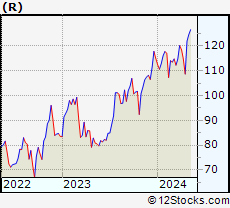 | R Ryder System, Inc. |
| Sector: Transports | |
| SubSector: Rental & Leasing Services | |
| MarketCap: 1550.94 Millions | |
| Recent Price: 108.71 Smart Investing & Trading Score: 10 | |
| Day Percent Change: 1.44% Day Change: 1.54 | |
| Week Change: -5.33% Year-to-date Change: -5.5% | |
| R Links: Profile News Message Board | |
| Charts:- Daily , Weekly | |
| Add R to Watchlist: View: Get Complete R Trend Analysis ➞ | |
 | MKL Markel Corporation |
| Sector: Financials | |
| SubSector: Property & Casualty Insurance | |
| MarketCap: 12405.9 Millions | |
| Recent Price: 1456.69 Smart Investing & Trading Score: 32 | |
| Day Percent Change: 1.43% Day Change: 20.56 | |
| Week Change: 1.69% Year-to-date Change: 2.6% | |
| MKL Links: Profile News Message Board | |
| Charts:- Daily , Weekly | |
| Add MKL to Watchlist: View: Get Complete MKL Trend Analysis ➞ | |
 | SAIC Science Applications International Corporation |
| Sector: Technology | |
| SubSector: Information Technology Services | |
| MarketCap: 3388.78 Millions | |
| Recent Price: 124.94 Smart Investing & Trading Score: 25 | |
| Day Percent Change: 1.43% Day Change: 1.76 | |
| Week Change: 1.1% Year-to-date Change: 0.5% | |
| SAIC Links: Profile News Message Board | |
| Charts:- Daily , Weekly | |
| Add SAIC to Watchlist: View: Get Complete SAIC Trend Analysis ➞ | |
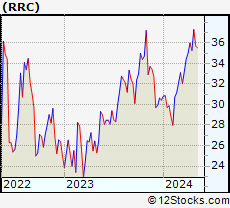 | RRC Range Resources Corporation |
| Sector: Energy | |
| SubSector: Independent Oil & Gas | |
| MarketCap: 728.093 Millions | |
| Recent Price: 35.27 Smart Investing & Trading Score: 88 | |
| Day Percent Change: 1.41% Day Change: 0.49 | |
| Week Change: -2.05% Year-to-date Change: 15.9% | |
| RRC Links: Profile News Message Board | |
| Charts:- Daily , Weekly | |
| Add RRC to Watchlist: View: Get Complete RRC Trend Analysis ➞ | |
 | CBSH Commerce Bancshares, Inc. |
| Sector: Financials | |
| SubSector: Regional - Midwest Banks | |
| MarketCap: 6201.5 Millions | |
| Recent Price: 53.85 Smart Investing & Trading Score: 93 | |
| Day Percent Change: 1.41% Day Change: 0.75 | |
| Week Change: 4.75% Year-to-date Change: 0.8% | |
| CBSH Links: Profile News Message Board | |
| Charts:- Daily , Weekly | |
| Add CBSH to Watchlist: View: Get Complete CBSH Trend Analysis ➞ | |
 | WEC WEC Energy Group, Inc. |
| Sector: Utilities | |
| SubSector: Electric Utilities | |
| MarketCap: 24852 Millions | |
| Recent Price: 81.56 Smart Investing & Trading Score: 86 | |
| Day Percent Change: 1.39% Day Change: 1.12 | |
| Week Change: 3.28% Year-to-date Change: -3.1% | |
| WEC Links: Profile News Message Board | |
| Charts:- Daily , Weekly | |
| Add WEC to Watchlist: View: Get Complete WEC Trend Analysis ➞ | |
 | RUN Sunrun Inc. |
| Sector: Technology | |
| SubSector: Semiconductor - Specialized | |
| MarketCap: 1286.2 Millions | |
| Recent Price: 10.25 Smart Investing & Trading Score: 10 | |
| Day Percent Change: 1.38% Day Change: 0.14 | |
| Week Change: -11.94% Year-to-date Change: -47.8% | |
| RUN Links: Profile News Message Board | |
| Charts:- Daily , Weekly | |
| Add RUN to Watchlist: View: Get Complete RUN Trend Analysis ➞ | |
 | DVA DaVita Inc. |
| Sector: Health Care | |
| SubSector: Specialized Health Services | |
| MarketCap: 8954.36 Millions | |
| Recent Price: 127.82 Smart Investing & Trading Score: 41 | |
| Day Percent Change: 1.36% Day Change: 1.71 | |
| Week Change: -1.99% Year-to-date Change: 22.0% | |
| DVA Links: Profile News Message Board | |
| Charts:- Daily , Weekly | |
| Add DVA to Watchlist: View: Get Complete DVA Trend Analysis ➞ | |
 | GPC Genuine Parts Company |
| Sector: Services & Goods | |
| SubSector: Auto Parts Stores | |
| MarketCap: 8605.9 Millions | |
| Recent Price: 162.39 Smart Investing & Trading Score: 100 | |
| Day Percent Change: 1.35% Day Change: 2.16 | |
| Week Change: 11.7% Year-to-date Change: 17.3% | |
| GPC Links: Profile News Message Board | |
| Charts:- Daily , Weekly | |
| Add GPC to Watchlist: View: Get Complete GPC Trend Analysis ➞ | |
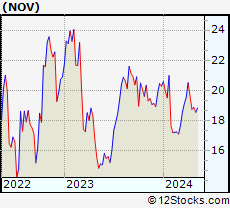 | NOV National Oilwell Varco, Inc. |
| Sector: Energy | |
| SubSector: Oil & Gas Equipment & Services | |
| MarketCap: 4737.41 Millions | |
| Recent Price: 18.75 Smart Investing & Trading Score: 28 | |
| Day Percent Change: 1.35% Day Change: 0.25 | |
| Week Change: -4.48% Year-to-date Change: -7.5% | |
| NOV Links: Profile News Message Board | |
| Charts:- Daily , Weekly | |
| Add NOV to Watchlist: View: Get Complete NOV Trend Analysis ➞ | |
 | LYB LyondellBasell Industries N.V. |
| Sector: Materials | |
| SubSector: Specialty Chemicals | |
| MarketCap: 16420.7 Millions | |
| Recent Price: 100.74 Smart Investing & Trading Score: 63 | |
| Day Percent Change: 1.35% Day Change: 1.34 | |
| Week Change: -0.78% Year-to-date Change: 6.0% | |
| LYB Links: Profile News Message Board | |
| Charts:- Daily , Weekly | |
| Add LYB to Watchlist: View: Get Complete LYB Trend Analysis ➞ | |
 | RJF Raymond James Financial, Inc. |
| Sector: Financials | |
| SubSector: Investment Brokerage - Regional | |
| MarketCap: 9490.65 Millions | |
| Recent Price: 123.60 Smart Investing & Trading Score: 68 | |
| Day Percent Change: 1.34% Day Change: 1.64 | |
| Week Change: 0.86% Year-to-date Change: 10.9% | |
| RJF Links: Profile News Message Board | |
| Charts:- Daily , Weekly | |
| Add RJF to Watchlist: View: Get Complete RJF Trend Analysis ➞ | |
 | COLM Columbia Sportswear Company |
| Sector: Consumer Staples | |
| SubSector: Textile - Apparel Clothing | |
| MarketCap: 4371.75 Millions | |
| Recent Price: 76.55 Smart Investing & Trading Score: 42 | |
| Day Percent Change: 1.34% Day Change: 1.01 | |
| Week Change: 2.34% Year-to-date Change: -3.8% | |
| COLM Links: Profile News Message Board | |
| Charts:- Daily , Weekly | |
| Add COLM to Watchlist: View: Get Complete COLM Trend Analysis ➞ | |
 | QGEN QIAGEN N.V. |
| Sector: Services & Goods | |
| SubSector: Research Services | |
| MarketCap: 8698.94 Millions | |
| Recent Price: 40.00 Smart Investing & Trading Score: 32 | |
| Day Percent Change: 1.34% Day Change: 0.53 | |
| Week Change: -0.45% Year-to-date Change: -7.9% | |
| QGEN Links: Profile News Message Board | |
| Charts:- Daily , Weekly | |
| Add QGEN to Watchlist: View: Get Complete QGEN Trend Analysis ➞ | |
 | VICI VICI Properties Inc. |
| Sector: Financials | |
| SubSector: REIT - Diversified | |
| MarketCap: 7327.03 Millions | |
| Recent Price: 27.89 Smart Investing & Trading Score: 32 | |
| Day Percent Change: 1.34% Day Change: 0.37 | |
| Week Change: -0.18% Year-to-date Change: -12.5% | |
| VICI Links: Profile News Message Board | |
| Charts:- Daily , Weekly | |
| Add VICI to Watchlist: View: Get Complete VICI Trend Analysis ➞ | |
 | NLY Annaly Capital Management, Inc. |
| Sector: Financials | |
| SubSector: Mortgage Investment | |
| MarketCap: 9127.79 Millions | |
| Recent Price: 18.23 Smart Investing & Trading Score: 32 | |
| Day Percent Change: 1.33% Day Change: 0.24 | |
| Week Change: -1.14% Year-to-date Change: -5.9% | |
| NLY Links: Profile News Message Board | |
| Charts:- Daily , Weekly | |
| Add NLY to Watchlist: View: Get Complete NLY Trend Analysis ➞ | |
 | PNFP Pinnacle Financial Partners, Inc. |
| Sector: Financials | |
| SubSector: Regional - Southeast Banks | |
| MarketCap: 2771.75 Millions | |
| Recent Price: 79.50 Smart Investing & Trading Score: 25 | |
| Day Percent Change: 1.33% Day Change: 1.04 | |
| Week Change: -0.56% Year-to-date Change: -8.9% | |
| PNFP Links: Profile News Message Board | |
| Charts:- Daily , Weekly | |
| Add PNFP to Watchlist: View: Get Complete PNFP Trend Analysis ➞ | |
 | WEN The Wendy s Company |
| Sector: Services & Goods | |
| SubSector: Restaurants | |
| MarketCap: 2814.9 Millions | |
| Recent Price: 19.25 Smart Investing & Trading Score: 100 | |
| Day Percent Change: 1.32% Day Change: 0.25 | |
| Week Change: 3.49% Year-to-date Change: -1.2% | |
| WEN Links: Profile News Message Board | |
| Charts:- Daily , Weekly | |
| Add WEN to Watchlist: View: Get Complete WEN Trend Analysis ➞ | |
 | ADC Agree Realty Corporation |
| Sector: Financials | |
| SubSector: Property Management | |
| MarketCap: 2573.82 Millions | |
| Recent Price: 56.56 Smart Investing & Trading Score: 52 | |
| Day Percent Change: 1.31% Day Change: 0.73 | |
| Week Change: 0.6% Year-to-date Change: -10.2% | |
| ADC Links: Profile News Message Board | |
| Charts:- Daily , Weekly | |
| Add ADC to Watchlist: View: Get Complete ADC Trend Analysis ➞ | |
| For tabular summary view of above stock list: Summary View ➞ 0 - 25 , 25 - 50 , 50 - 75 , 75 - 100 , 100 - 125 , 125 - 150 , 150 - 175 , 175 - 200 , 200 - 225 , 225 - 250 , 250 - 275 , 275 - 300 , 300 - 325 , 325 - 350 , 350 - 375 , 375 - 400 , 400 - 425 , 425 - 450 , 450 - 475 , 475 - 500 , 500 - 525 , 525 - 550 , 550 - 575 , 575 - 600 , 600 - 625 , 625 - 650 , 650 - 675 , 675 - 700 , 700 - 725 , 725 - 750 , 750 - 775 | ||
| Click To Change The Sort Order: By Market Cap or Company Size Performance: Year-to-date, Week and Day | |
| Select Chart Type: | ||
|
Best Stocks Today 12Stocks.com |
© 2024 12Stocks.com Terms & Conditions Privacy Contact Us
All Information Provided Only For Education And Not To Be Used For Investing or Trading. See Terms & Conditions


One More Thing ... Get Best Stocks Delivered Daily!
Never Ever Miss A Move With Our Top Ten Stocks Lists
Find Best Stocks In Any Market - Bull or Bear Market
Take A Peek At Our Top Ten Stocks Lists: Daily, Weekly, Year-to-Date & Top Trends
Find Best Stocks In Any Market - Bull or Bear Market
Take A Peek At Our Top Ten Stocks Lists: Daily, Weekly, Year-to-Date & Top Trends
Midcap Stocks With Best Up Trends [0-bearish to 100-bullish]: UGI [100], Entergy [100], Bunge [100], Flowers Foods[100], Tyson Foods[100], Genuine Parts[100], Wendy s[100], Alaska Air[100], Consolidated Edison[100], Conagra [100], United Airlines[100]
Best Midcap Stocks Year-to-Date:
ShockWave Medical[72.66%], Vistra Energy[70.46%], AppLovin [67.86%], Constellation Energy[54.47%], EMCOR [52.55%], Spotify [46.79%], Pure Storage[38.7%], Williams-Sonoma [38.37%], CAVA [37.24%], Natera [36.14%], Coupang [35.86%] Best Midcap Stocks This Week:
United Airlines[22.92%], AMC Entertainment[19.25%], Globe Life[12.95%], Genuine Parts[11.7%], Advance Auto[11.62%], Iridium [11.07%], Medical Properties[10.78%], agilon health[10.3%], UGI [9.72%], Alaska Air[8.98%], Flowers Foods[8.66%] Best Midcap Stocks Daily:
AMC Entertainment[8.22%], UGI [8.20%], Hawaiian Electric[6.86%], Fifth Third[5.93%], Iridium [5.14%], agilon health[4.10%], SSR Mining[3.99%], Walgreens Boots[3.70%], Darling Ingredients[3.47%], Citizens Financial[3.31%], J. M.[3.29%]