
 Login Sign Up


| |||||
 |  | ||||

| 12Stocks.com Market Intelligence |
Best MidCap Stocks
|
| In a hurry? Mid Cap Stocks Lists: Performance Trends Table, Stock Charts
Sort midcap stocks: Daily, Weekly, Year-to-Date, Market Cap & Trends. Filter midcap stocks list by sector: Show all, Tech, Finance, Energy, Staples, Retail, Industrial, Materials, Utilities and HealthCare Filter midcap stocks list by size:All MidCap Large Mid-Range Small |
| 12Stocks.com Mid Cap Stocks Performances & Trends Daily | |||||||||
|
|  The overall Smart Investing & Trading Score is 63 (0-bearish to 100-bullish) which puts Mid Cap index in short term neutral to bullish trend. The Smart Investing & Trading Score from previous trading session is 44 and an improvement of trend continues.
| ||||||||
Here are the Smart Investing & Trading Scores of the most requested mid cap stocks at 12Stocks.com (click stock name for detailed review):
|


| 12Stocks.com: Top Performing Mid Cap Index Stocks | ||||||||||||||||||||||||||||||||||||||||||||||||
 The top performing Mid Cap Index stocks year to date are
Now, more recently, over last week, the top performing Mid Cap Index stocks on the move are


|
||||||||||||||||||||||||||||||||||||||||||||||||
| 12Stocks.com: Investing in Midcap Index with Stocks | |
|
The following table helps investors and traders sort through current performance and trends (as measured by Smart Investing & Trading Score) of various
stocks in the Midcap Index. Quick View: Move mouse or cursor over stock symbol (ticker) to view short-term technical chart and over stock name to view long term chart. Click on  to add stock symbol to your watchlist and to add stock symbol to your watchlist and  to view watchlist. Click on any ticker or stock name for detailed market intelligence report for that stock. to view watchlist. Click on any ticker or stock name for detailed market intelligence report for that stock. |
12Stocks.com Performance of Stocks in Midcap Index
| Ticker | Stock Name | Watchlist | Category | Recent Price | Smart Investing & Trading Score | Change % | YTD Change% |
| FHB | First Hawaiian |   | Financials | 22.21 | 100 | 1.14 | -2.84% |
| ESTC | Elastic N.V | | Technology | 103.71 | 64 | 1.14 | -7.98% |
| SNX | SYNNEX | | Technology | 117.24 | 93 | 1.12 | 8.95% |
| TW | Tradeweb Markets | | Services & Goods | 102.96 | 73 | 1.11 | 13.29% |
| MKC | McCormick & | | Consumer Staples | 75.85 | 88 | 1.11 | 10.86% |
| PEG | Public Service | | Utilities | 67.23 | 95 | 1.11 | 9.94% |
| WSC | WillScot | | Transports | 38.19 | 10 | 1.09 | -14.18% |
| UTHR | United | | Health Care | 237.00 | 88 | 1.08 | 7.78% |
| MKSI | MKS Instruments | | Technology | 113.78 | 63 | 1.08 | 10.61% |
| PLNT | Planet Fitness | | Services & Goods | 61.09 | 52 | 1.08 | -16.32% |
| TWLO | Twilio | | Technology | 60.98 | 62 | 1.08 | -19.63% |
| DT | Dynatrace | | Technology | 46.74 | 57 | 1.06 | -14.54% |
| AGCO | AGCO | | Industrials | 118.69 | 28 | 1.06 | -2.24% |
| MUSA | Murphy USA | | Services & Goods | 421.11 | 78 | 1.06 | 18.10% |
| K | Kellogg | | Consumer Staples | 58.75 | 100 | 1.05 | 5.08% |
| LFUS | Littelfuse | | Services & Goods | 233.60 | 59 | 1.04 | -12.69% |
| QDEL | Quidel | | Health Care | 40.82 | 42 | 1.04 | -44.61% |
| FCNCA | First Citizens | | Financials | 1639.63 | 95 | 1.04 | 15.55% |
| EXR | Extra Space | | Financials | 134.64 | 35 | 1.02 | -16.02% |
| DOCU | DocuSign | | Technology | 57.29 | 22 | 1.02 | -3.63% |
| ZION | Zions Ban | | Financials | 42.17 | 80 | 1.01 | -3.88% |
| COLM | Columbia Sportswear | | Consumer Staples | 79.78 | 87 | 1.00 | 0.30% |
| DV | DoubleVerify | | Technology | 30.79 | 42 | 0.98 | -16.29% |
| ICLR | ICON Public | | Health Care | 309.44 | 65 | 0.98 | 9.32% |
| CAG | Conagra | | Consumer Staples | 31.57 | 100 | 0.96 | 10.15% |
| For chart view version of above stock list: Chart View ➞ 0 - 25 , 25 - 50 , 50 - 75 , 75 - 100 , 100 - 125 , 125 - 150 , 150 - 175 , 175 - 200 , 200 - 225 , 225 - 250 , 250 - 275 , 275 - 300 , 300 - 325 , 325 - 350 , 350 - 375 , 375 - 400 , 400 - 425 , 425 - 450 , 450 - 475 , 475 - 500 , 500 - 525 , 525 - 550 , 550 - 575 , 575 - 600 , 600 - 625 , 625 - 650 , 650 - 675 , 675 - 700 , 700 - 725 , 725 - 750 , 750 - 775 | ||
 | Click To Change The Sort Order: By Market Cap or Company Size Performance: Year-to-date, Week and Day |  |
|
Get the most comprehensive stock market coverage daily at 12Stocks.com ➞ Best Stocks Today ➞ Best Stocks Weekly ➞ Best Stocks Year-to-Date ➞ Best Stocks Trends ➞  Best Stocks Today 12Stocks.com Best Nasdaq Stocks ➞ Best S&P 500 Stocks ➞ Best Tech Stocks ➞ Best Biotech Stocks ➞ |
| Detailed Overview of Midcap Stocks |
| Midcap Technical Overview, Leaders & Laggards, Top Midcap ETF Funds & Detailed Midcap Stocks List, Charts, Trends & More |
| Midcap: Technical Analysis, Trends & YTD Performance | |
| MidCap segment as represented by
MDY, an exchange-traded fund [ETF], holds basket of about four hundred midcap stocks from across all major sectors of the US stock market. The midcap index (contains stocks like Green Mountain Coffee Roasters and Tractor Supply Company) is up by 4.42% and is currently underperforming the overall market by -1.24% year-to-date. Below is a quick view of technical charts and trends: | |
 MDY Weekly Chart |
|
| Long Term Trend: Very Good | |
| Medium Term Trend: Not Good | |
 MDY Daily Chart |
|
| Short Term Trend: Very Good | |
| Overall Trend Score: 63 | |
| YTD Performance: 4.42% | |
| **Trend Scores & Views Are Only For Educational Purposes And Not For Investing | |
| 12Stocks.com: Investing in Midcap Index using Exchange Traded Funds | |
|
The following table shows list of key exchange traded funds (ETF) that
help investors track Midcap index. The following list also includes leveraged ETF funds that track twice or thrice the daily returns of Midcap indices. Short or inverse ETF funds move in the opposite direction to the index they track and are useful during market pullbacks or during bear markets. Quick View: Move mouse or cursor over ETF symbol (ticker) to view short-term technical chart and over ETF name to view long term chart. Click on ticker or stock name for detailed view. Click on to add stock symbol to your watchlist and to view watchlist. |
12Stocks.com List of ETFs that track Midcap Index
| Ticker | ETF Name | Watchlist | Recent Price | Smart Investing & Trading Score | Change % | Week % | Year-to-date % |
| IJH | iShares Core S&P Mid-Cap | | 57.87 | 68 | 0.03 | 2.28 | 4.4% |
| IWR | iShares Russell Mid-Cap | | 80.41 | 63 | 0.05 | 2.22 | 3.45% |
| IWP | iShares Russell Mid-Cap Growth | | 108.49 | 58 | -0.13 | 2.64 | 3.86% |
| MDY | SPDR S&P MidCap 400 ETF | | 529.80 | 63 | 0.00 | 2.22 | 4.42% |
| IJK | iShares S&P Mid-Cap 400 Growth | | 86.99 | 63 | 0.07 | 2.52 | 9.81% |
| IWS | iShares Russell Mid-Cap Value | | 119.97 | 68 | 0.09 | 1.97 | 3.16% |
| IJJ | iShares S&P Mid-Cap 400 Value | | 112.59 | 51 | 0.11 | 1.85 | -1.27% |
| XMLV | PowerShares S&P MidCap Low Volatil ETF | | 55.04 | 75 | 0.24 | 1.62 | 3.5% |
| MVV | ProShares Ultra MidCap400 | | 61.60 | 41 | 0.10 | 4.41 | 6.41% |
| UMDD | ProShares UltraPro MidCap400 | | 24.09 | 63 | -0.08 | 6.77 | 7.93% |
| SMDD | ProShares UltraPro Short MidCap400 | | 11.84 | 32 | 1.58 | -5.79 | -12.1% |
| MYY | ProShares Short MidCap400 | | 20.74 | 32 | 0.00 | -2.12 | -3.33% |
| MZZ | ProShares UltraShort MidCap400 | | 11.69 | 34 | 0.26 | -3.95 | -7.01% |
| 12Stocks.com: Charts, Trends, Fundamental Data and Performances of MidCap Stocks | |
|
We now take in-depth look at all MidCap stocks including charts, multi-period performances and overall trends (as measured by Smart Investing & Trading Score). One can sort MidCap stocks (click link to choose) by Daily, Weekly and by Year-to-Date performances. Also, one can sort by size of the company or by market capitalization. |
| Select Your Default Chart Type: | |||||
| |||||
| Click on stock symbol or name for detailed view. Click on to add stock symbol to your watchlist and to view watchlist. Quick View: Move mouse or cursor over "Daily" to quickly view daily technical stock chart and over "Weekly" to view weekly technical stock chart. | |||||

 | FHB First Hawaiian, Inc. |
| Sector: Financials | |
| SubSector: Regional - Pacific Banks | |
| MarketCap: 2398.99 Millions | |
| Recent Price: 22.21 Smart Investing & Trading Score: 100 | |
| Day Percent Change: 1.14% Day Change: 0.25 | |
| Week Change: 5.76% Year-to-date Change: -2.8% | |
| FHB Links: Profile News Message Board | |
| Charts:- Daily , Weekly | |
| Add FHB to Watchlist: View: Get Complete FHB Trend Analysis ➞ | |
 | ESTC Elastic N.V. |
| Sector: Technology | |
| SubSector: Application Software | |
| MarketCap: 4420.92 Millions | |
| Recent Price: 103.71 Smart Investing & Trading Score: 64 | |
| Day Percent Change: 1.14% Day Change: 1.17 | |
| Week Change: 7.82% Year-to-date Change: -8.0% | |
| ESTC Links: Profile News Message Board | |
| Charts:- Daily , Weekly | |
| Add ESTC to Watchlist: View: Get Complete ESTC Trend Analysis ➞ | |
 | SNX SYNNEX Corporation |
| Sector: Technology | |
| SubSector: Information Technology Services | |
| MarketCap: 4519.48 Millions | |
| Recent Price: 117.24 Smart Investing & Trading Score: 93 | |
| Day Percent Change: 1.12% Day Change: 1.30 | |
| Week Change: 3.46% Year-to-date Change: 9.0% | |
| SNX Links: Profile News Message Board | |
| Charts:- Daily , Weekly | |
| Add SNX to Watchlist: View: Get Complete SNX Trend Analysis ➞ | |
 | TW Tradeweb Markets Inc. |
| Sector: Services & Goods | |
| SubSector: Management Services | |
| MarketCap: 9913.35 Millions | |
| Recent Price: 102.96 Smart Investing & Trading Score: 73 | |
| Day Percent Change: 1.11% Day Change: 1.13 | |
| Week Change: 1.91% Year-to-date Change: 13.3% | |
| TW Links: Profile News Message Board | |
| Charts:- Daily , Weekly | |
| Add TW to Watchlist: View: Get Complete TW Trend Analysis ➞ | |
 | MKC McCormick & Company, Incorporated |
| Sector: Consumer Staples | |
| SubSector: Processed & Packaged Goods | |
| MarketCap: 18522.8 Millions | |
| Recent Price: 75.85 Smart Investing & Trading Score: 88 | |
| Day Percent Change: 1.11% Day Change: 0.83 | |
| Week Change: 2.61% Year-to-date Change: 10.9% | |
| MKC Links: Profile News Message Board | |
| Charts:- Daily , Weekly | |
| Add MKC to Watchlist: View: Get Complete MKC Trend Analysis ➞ | |
 | PEG Public Service Enterprise Group Incorporated |
| Sector: Utilities | |
| SubSector: Diversified Utilities | |
| MarketCap: 20886 Millions | |
| Recent Price: 67.23 Smart Investing & Trading Score: 95 | |
| Day Percent Change: 1.11% Day Change: 0.74 | |
| Week Change: 2.27% Year-to-date Change: 9.9% | |
| PEG Links: Profile News Message Board | |
| Charts:- Daily , Weekly | |
| Add PEG to Watchlist: View: Get Complete PEG Trend Analysis ➞ | |
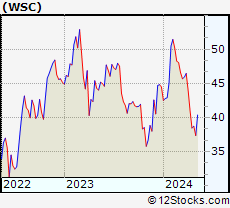 | WSC WillScot Corporation |
| Sector: Transports | |
| SubSector: Rental & Leasing Services | |
| MarketCap: 1050.44 Millions | |
| Recent Price: 38.19 Smart Investing & Trading Score: 10 | |
| Day Percent Change: 1.09% Day Change: 0.41 | |
| Week Change: -0.73% Year-to-date Change: -14.2% | |
| WSC Links: Profile News Message Board | |
| Charts:- Daily , Weekly | |
| Add WSC to Watchlist: View: Get Complete WSC Trend Analysis ➞ | |
 | UTHR United Therapeutics Corporation |
| Sector: Health Care | |
| SubSector: Biotechnology | |
| MarketCap: 3980.75 Millions | |
| Recent Price: 237.00 Smart Investing & Trading Score: 88 | |
| Day Percent Change: 1.08% Day Change: 2.53 | |
| Week Change: -0.39% Year-to-date Change: 7.8% | |
| UTHR Links: Profile News Message Board | |
| Charts:- Daily , Weekly | |
| Add UTHR to Watchlist: View: Get Complete UTHR Trend Analysis ➞ | |
 | MKSI MKS Instruments, Inc. |
| Sector: Technology | |
| SubSector: Scientific & Technical Instruments | |
| MarketCap: 4502.93 Millions | |
| Recent Price: 113.78 Smart Investing & Trading Score: 63 | |
| Day Percent Change: 1.08% Day Change: 1.22 | |
| Week Change: 5.19% Year-to-date Change: 10.6% | |
| MKSI Links: Profile News Message Board | |
| Charts:- Daily , Weekly | |
| Add MKSI to Watchlist: View: Get Complete MKSI Trend Analysis ➞ | |
 | PLNT Planet Fitness, Inc. |
| Sector: Services & Goods | |
| SubSector: Sporting Activities | |
| MarketCap: 3485.94 Millions | |
| Recent Price: 61.09 Smart Investing & Trading Score: 52 | |
| Day Percent Change: 1.08% Day Change: 0.65 | |
| Week Change: 4.11% Year-to-date Change: -16.3% | |
| PLNT Links: Profile News Message Board | |
| Charts:- Daily , Weekly | |
| Add PLNT to Watchlist: View: Get Complete PLNT Trend Analysis ➞ | |
 | TWLO Twilio Inc. |
| Sector: Technology | |
| SubSector: Application Software | |
| MarketCap: 13055.8 Millions | |
| Recent Price: 60.98 Smart Investing & Trading Score: 62 | |
| Day Percent Change: 1.08% Day Change: 0.65 | |
| Week Change: 5.96% Year-to-date Change: -19.6% | |
| TWLO Links: Profile News Message Board | |
| Charts:- Daily , Weekly | |
| Add TWLO to Watchlist: View: Get Complete TWLO Trend Analysis ➞ | |
 | DT Dynatrace, Inc. |
| Sector: Technology | |
| SubSector: Application Software | |
| MarketCap: 7007.12 Millions | |
| Recent Price: 46.74 Smart Investing & Trading Score: 57 | |
| Day Percent Change: 1.06% Day Change: 0.49 | |
| Week Change: 2.95% Year-to-date Change: -14.5% | |
| DT Links: Profile News Message Board | |
| Charts:- Daily , Weekly | |
| Add DT to Watchlist: View: Get Complete DT Trend Analysis ➞ | |
 | AGCO AGCO Corporation |
| Sector: Industrials | |
| SubSector: Farm & Construction Machinery | |
| MarketCap: 3399.57 Millions | |
| Recent Price: 118.69 Smart Investing & Trading Score: 28 | |
| Day Percent Change: 1.06% Day Change: 1.24 | |
| Week Change: -0.05% Year-to-date Change: -2.2% | |
| AGCO Links: Profile News Message Board | |
| Charts:- Daily , Weekly | |
| Add AGCO to Watchlist: View: Get Complete AGCO Trend Analysis ➞ | |
 | MUSA Murphy USA Inc. |
| Sector: Services & Goods | |
| SubSector: Specialty Retail, Other | |
| MarketCap: 3133.14 Millions | |
| Recent Price: 421.11 Smart Investing & Trading Score: 78 | |
| Day Percent Change: 1.06% Day Change: 4.40 | |
| Week Change: 0.93% Year-to-date Change: 18.1% | |
| MUSA Links: Profile News Message Board | |
| Charts:- Daily , Weekly | |
| Add MUSA to Watchlist: View: Get Complete MUSA Trend Analysis ➞ | |
 | K Kellogg Company |
| Sector: Consumer Staples | |
| SubSector: Processed & Packaged Goods | |
| MarketCap: 20264.6 Millions | |
| Recent Price: 58.75 Smart Investing & Trading Score: 100 | |
| Day Percent Change: 1.05% Day Change: 0.61 | |
| Week Change: 2.39% Year-to-date Change: 5.1% | |
| K Links: Profile News Message Board | |
| Charts:- Daily , Weekly | |
| Add K to Watchlist: View: Get Complete K Trend Analysis ➞ | |
 | LFUS Littelfuse, Inc. |
| Sector: Services & Goods | |
| SubSector: Electronics Wholesale | |
| MarketCap: 2965.23 Millions | |
| Recent Price: 233.60 Smart Investing & Trading Score: 59 | |
| Day Percent Change: 1.04% Day Change: 2.41 | |
| Week Change: 3.02% Year-to-date Change: -12.7% | |
| LFUS Links: Profile News Message Board | |
| Charts:- Daily , Weekly | |
| Add LFUS to Watchlist: View: Get Complete LFUS Trend Analysis ➞ | |
 | QDEL Quidel Corporation |
| Sector: Health Care | |
| SubSector: Diagnostic Substances | |
| MarketCap: 4104.91 Millions | |
| Recent Price: 40.82 Smart Investing & Trading Score: 42 | |
| Day Percent Change: 1.04% Day Change: 0.42 | |
| Week Change: 4.35% Year-to-date Change: -44.6% | |
| QDEL Links: Profile News Message Board | |
| Charts:- Daily , Weekly | |
| Add QDEL to Watchlist: View: Get Complete QDEL Trend Analysis ➞ | |
 | FCNCA First Citizens BancShares, Inc. |
| Sector: Financials | |
| SubSector: Regional - Mid-Atlantic Banks | |
| MarketCap: 3157.19 Millions | |
| Recent Price: 1639.63 Smart Investing & Trading Score: 95 | |
| Day Percent Change: 1.04% Day Change: 16.91 | |
| Week Change: 4.61% Year-to-date Change: 15.6% | |
| FCNCA Links: Profile News Message Board | |
| Charts:- Daily , Weekly | |
| Add FCNCA to Watchlist: View: Get Complete FCNCA Trend Analysis ➞ | |
 | EXR Extra Space Storage Inc. |
| Sector: Financials | |
| SubSector: REIT - Industrial | |
| MarketCap: 11203.9 Millions | |
| Recent Price: 134.64 Smart Investing & Trading Score: 35 | |
| Day Percent Change: 1.02% Day Change: 1.36 | |
| Week Change: 1.65% Year-to-date Change: -16.0% | |
| EXR Links: Profile News Message Board | |
| Charts:- Daily , Weekly | |
| Add EXR to Watchlist: View: Get Complete EXR Trend Analysis ➞ | |
 | DOCU DocuSign, Inc. |
| Sector: Technology | |
| SubSector: Business Software & Services | |
| MarketCap: 15618.8 Millions | |
| Recent Price: 57.29 Smart Investing & Trading Score: 22 | |
| Day Percent Change: 1.02% Day Change: 0.58 | |
| Week Change: 2.93% Year-to-date Change: -3.6% | |
| DOCU Links: Profile News Message Board | |
| Charts:- Daily , Weekly | |
| Add DOCU to Watchlist: View: Get Complete DOCU Trend Analysis ➞ | |
 | ZION Zions Bancorporation, National Association |
| Sector: Financials | |
| SubSector: Regional - Pacific Banks | |
| MarketCap: 4577.89 Millions | |
| Recent Price: 42.17 Smart Investing & Trading Score: 80 | |
| Day Percent Change: 1.01% Day Change: 0.42 | |
| Week Change: 5.64% Year-to-date Change: -3.9% | |
| ZION Links: Profile News Message Board | |
| Charts:- Daily , Weekly | |
| Add ZION to Watchlist: View: Get Complete ZION Trend Analysis ➞ | |
 | COLM Columbia Sportswear Company |
| Sector: Consumer Staples | |
| SubSector: Textile - Apparel Clothing | |
| MarketCap: 4371.75 Millions | |
| Recent Price: 79.78 Smart Investing & Trading Score: 87 | |
| Day Percent Change: 1.00% Day Change: 0.79 | |
| Week Change: 4.22% Year-to-date Change: 0.3% | |
| COLM Links: Profile News Message Board | |
| Charts:- Daily , Weekly | |
| Add COLM to Watchlist: View: Get Complete COLM Trend Analysis ➞ | |
 | DV DoubleVerify Holdings, Inc. |
| Sector: Technology | |
| SubSector: Software - Application | |
| MarketCap: 6500 Millions | |
| Recent Price: 30.79 Smart Investing & Trading Score: 42 | |
| Day Percent Change: 0.98% Day Change: 0.30 | |
| Week Change: 4.62% Year-to-date Change: -16.3% | |
| DV Links: Profile News Message Board | |
| Charts:- Daily , Weekly | |
| Add DV to Watchlist: View: Get Complete DV Trend Analysis ➞ | |
 | ICLR ICON Public Limited Company |
| Sector: Health Care | |
| SubSector: Medical Laboratories & Research | |
| MarketCap: 7011 Millions | |
| Recent Price: 309.44 Smart Investing & Trading Score: 65 | |
| Day Percent Change: 0.98% Day Change: 2.99 | |
| Week Change: 7.36% Year-to-date Change: 9.3% | |
| ICLR Links: Profile News Message Board | |
| Charts:- Daily , Weekly | |
| Add ICLR to Watchlist: View: Get Complete ICLR Trend Analysis ➞ | |
 | CAG Conagra Brands, Inc. |
| Sector: Consumer Staples | |
| SubSector: Processed & Packaged Goods | |
| MarketCap: 14084.1 Millions | |
| Recent Price: 31.57 Smart Investing & Trading Score: 100 | |
| Day Percent Change: 0.96% Day Change: 0.30 | |
| Week Change: 3.1% Year-to-date Change: 10.2% | |
| CAG Links: Profile News Message Board | |
| Charts:- Daily , Weekly | |
| Add CAG to Watchlist: View: Get Complete CAG Trend Analysis ➞ | |
| For tabular summary view of above stock list: Summary View ➞ 0 - 25 , 25 - 50 , 50 - 75 , 75 - 100 , 100 - 125 , 125 - 150 , 150 - 175 , 175 - 200 , 200 - 225 , 225 - 250 , 250 - 275 , 275 - 300 , 300 - 325 , 325 - 350 , 350 - 375 , 375 - 400 , 400 - 425 , 425 - 450 , 450 - 475 , 475 - 500 , 500 - 525 , 525 - 550 , 550 - 575 , 575 - 600 , 600 - 625 , 625 - 650 , 650 - 675 , 675 - 700 , 700 - 725 , 725 - 750 , 750 - 775 | ||
| Click To Change The Sort Order: By Market Cap or Company Size Performance: Year-to-date, Week and Day | |
| Select Chart Type: | ||
|
Best Stocks Today 12Stocks.com |
© 2024 12Stocks.com Terms & Conditions Privacy Contact Us
All Information Provided Only For Education And Not To Be Used For Investing or Trading. See Terms & Conditions


One More Thing ... Get Best Stocks Delivered Daily!
Never Ever Miss A Move With Our Top Ten Stocks Lists
Find Best Stocks In Any Market - Bull or Bear Market
Take A Peek At Our Top Ten Stocks Lists: Daily, Weekly, Year-to-Date & Top Trends
Find Best Stocks In Any Market - Bull or Bear Market
Take A Peek At Our Top Ten Stocks Lists: Daily, Weekly, Year-to-Date & Top Trends
Midcap Stocks With Best Up Trends [0-bearish to 100-bullish]: Hasbro [100], Wabtec [100], Allegro Micro[100], Microchip [100], Synchrony Financial[100], EQT [100], Prosperity Bancshares[100], Range Resources[100], Virtu Financial[100], Crane Co[100], National Fuel[100]
Best Midcap Stocks Year-to-Date:
Vistra Energy[82.92%], AppLovin [74.52%], ShockWave Medical[72.58%], Constellation Energy[59.4%], EMCOR [57.31%], Spotify [49.66%], Natera [46.07%], Pure Storage[42.04%], Williams-Sonoma [41.5%], Wingstop [41.38%], NRG Energy[40.44%] Best Midcap Stocks This Week:
HashiCorp [23.7%], Globe Life[17.77%], Hasbro [17.66%], Tandem Diabetes[15.41%], Wabtec [13.32%], MongoDB [12.82%], Ryder System[12.4%], Microchip [11.02%], Watsco [11%], Crane Co[9.77%], Coinbase Global[9.74%] Best Midcap Stocks Daily:
Hasbro [11.85%], Wabtec [10.04%], CoStar [8.66%], Allegro Micro[8.24%], GameStop [7.58%], Watsco [6.54%], ON Semiconductor[6.24%], Hertz Global[6.23%], Sarepta [6.09%], Lattice Semiconductor[5.31%], Microchip [5.21%]