
 Login Sign Up


| |||||
 |  | ||||

| 12Stocks.com Market Intelligence |
Best MidCap Stocks
|
| In a hurry? Mid Cap Stocks Lists: Performance Trends Table, Stock Charts
Sort midcap stocks: Daily, Weekly, Year-to-Date, Market Cap & Trends. Filter midcap stocks list by sector: Show all, Tech, Finance, Energy, Staples, Retail, Industrial, Materials, Utilities and HealthCare Filter midcap stocks list by size:All MidCap Large Mid-Range Small |
| 12Stocks.com Mid Cap Stocks Performances & Trends Daily | |||||||||
|
|  The overall Smart Investing & Trading Score is 36 (0-bearish to 100-bullish) which puts Mid Cap index in short term bearish to neutral trend. The Smart Investing & Trading Score from previous trading session is 26 and hence an improvement of trend.
| ||||||||
Here are the Smart Investing & Trading Scores of the most requested mid cap stocks at 12Stocks.com (click stock name for detailed review):
|


| 12Stocks.com: Top Performing Mid Cap Index Stocks | ||||||||||||||||||||||||||||||||||||||||||||||||
 The top performing Mid Cap Index stocks year to date are
Now, more recently, over last week, the top performing Mid Cap Index stocks on the move are


|
||||||||||||||||||||||||||||||||||||||||||||||||
| 12Stocks.com: Investing in Midcap Index with Stocks | |
|
The following table helps investors and traders sort through current performance and trends (as measured by Smart Investing & Trading Score) of various
stocks in the Midcap Index. Quick View: Move mouse or cursor over stock symbol (ticker) to view short-term technical chart and over stock name to view long term chart. Click on  to add stock symbol to your watchlist and to add stock symbol to your watchlist and  to view watchlist. Click on any ticker or stock name for detailed market intelligence report for that stock. to view watchlist. Click on any ticker or stock name for detailed market intelligence report for that stock. |
12Stocks.com Performance of Stocks in Midcap Index
| Ticker | Stock Name | Watchlist | Category | Recent Price | Smart Investing & Trading Score | Change % | YTD Change% |
| CCCS | CCC Intelligent |   | Technology | 11.48 | 43 | 0.44% | 1.19% |
| TECH | Bio-Techne | | Health Care | 62.21 | 10 | -0.83% | -19.38% |
| AVTR | Avantor | | Materials | 24.30 | 43 | -0.33% | 6.44% |
| DOX | Amdocs | | Technology | 85.11 | 18 | 0.21% | -3.16% |
| RPM | RPM | | Materials | 107.38 | 30 | 0.02% | -3.81% |
| HSIC | Henry Schein | | Services & Goods | 69.97 | 10 | -0.33% | -7.58% |
| IONS | Ionis | | Health Care | 40.81 | 10 | -0.24% | -19.33% |
| FFIV | F5 Networks | | Technology | 179.59 | 0 | -0.94% | 0.34% |
| WYNN | Wynn Resorts | | Services & Goods | 96.10 | 26 | -1.42% | 5.48% |
| AGNC | AGNC | | Financials | 9.06 | 25 | 0.22% | -7.65% |
| COLD | Americold Realty | | Financials | 22.73 | 0 | -1.39% | -24.91% |
| CSL | Carlisle | | Consumer Staples | 367.41 | 41 | -0.39% | 17.60% |
| DOCS | Doximity | | Health Care | 25.35 | 23 | 0.64% | -10.83% |
| ZG | Zillow | | Technology | 41.11 | 0 | -1.84% | -27.52% |
| FNF | Fidelity National | | Financials | 47.58 | 17 | 1.19% | -6.74% |
| NRG | NRG Energy | | Utilities | 70.52 | 51 | -3.95% | 36.40% |
| DV | DoubleVerify | | Technology | 30.14 | 7 | 0.37% | -18.05% |
| PRGO | Perrigo | | Health Care | 29.94 | 28 | -0.33% | -6.96% |
| MPWR | Monolithic Power | | Technology | 620.31 | 26 | -2.73% | -1.66% |
| OHI | Omega | | Financials | 29.98 | 36 | 0.07% | -2.22% |
| TTC | Toro | | Industrials | 84.51 | 10 | 0.27% | -11.96% |
| KRC | Kilroy Realty | | Financials | 32.67 | 10 | 0.83% | -18.00% |
| SEIC | SEI s | | Financials | 66.01 | 36 | -0.11% | 3.87% |
| CTLT | Catalent | | Health Care | 55.80 | 51 | -0.29% | 24.19% |
| REG | Regency Centers | | Financials | 57.76 | 25 | 0.82% | -13.79% |
| For chart view version of above stock list: Chart View ➞ 0 - 25 , 25 - 50 , 50 - 75 , 75 - 100 , 100 - 125 , 125 - 150 , 150 - 175 , 175 - 200 | ||
 | Click To Change The Sort Order: By Market Cap or Company Size Performance: Year-to-date, Week and Day |  |
|
Get the most comprehensive stock market coverage daily at 12Stocks.com ➞ Best Stocks Today ➞ Best Stocks Weekly ➞ Best Stocks Year-to-Date ➞ Best Stocks Trends ➞  Best Stocks Today 12Stocks.com Best Nasdaq Stocks ➞ Best S&P 500 Stocks ➞ Best Tech Stocks ➞ Best Biotech Stocks ➞ |
| Detailed Overview of Midcap Stocks |
| Midcap Technical Overview, Leaders & Laggards, Top Midcap ETF Funds & Detailed Midcap Stocks List, Charts, Trends & More |
| Midcap: Technical Analysis, Trends & YTD Performance | |
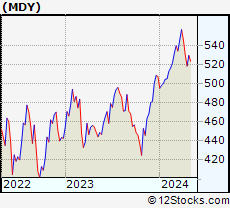
| MidCap segment as represented by
MDY, an exchange-traded fund [ETF], holds basket of about four hundred midcap stocks from across all major sectors of the US stock market. The midcap index (contains stocks like Green Mountain Coffee Roasters and Tractor Supply Company) is up by 1.81% and is currently underperforming the overall market by -2.38% year-to-date. Below is a quick view of technical charts and trends: | |
 MDY Weekly Chart |
|
| Long Term Trend: Good | |
| Medium Term Trend: Not Good | |
 MDY Daily Chart |
|
| Short Term Trend: Not Good | |
| Overall Trend Score: 36 | |
| YTD Performance: 1.81% | |
| **Trend Scores & Views Are Only For Educational Purposes And Not For Investing | |
| 12Stocks.com: Investing in Midcap Index using Exchange Traded Funds | |
|
The following table shows list of key exchange traded funds (ETF) that
help investors track Midcap index. The following list also includes leveraged ETF funds that track twice or thrice the daily returns of Midcap indices. Short or inverse ETF funds move in the opposite direction to the index they track and are useful during market pullbacks or during bear markets. Quick View: Move mouse or cursor over ETF symbol (ticker) to view short-term technical chart and over ETF name to view long term chart. Click on ticker or stock name for detailed view. Click on to add stock symbol to your watchlist and to view watchlist. |
12Stocks.com List of ETFs that track Midcap Index
| Ticker | ETF Name | Watchlist | Recent Price | Smart Investing & Trading Score | Change % | Week % | Year-to-date % |
| IJH | iShares Core S&P Mid-Cap | | 56.43 | 36 | -0.14 | -2.52 | 1.8% |
| IWR | iShares Russell Mid-Cap | | 78.71 | 36 | -0.14 | -2.37 | 1.26% |
| MDY | SPDR S&P MidCap 400 ETF | | 516.55 | 36 | -0.14 | -2.53 | 1.81% |
| IWP | iShares Russell Mid-Cap Growth | | 106.50 | 26 | -0.49 | -3.04 | 1.95% |
| IWS | iShares Russell Mid-Cap Value | | 117.31 | 41 | -0.09 | -2.15 | 0.88% |
| IJK | iShares S&P Mid-Cap 400 Growth | | 85.03 | 36 | -0.36 | -2.8 | 7.33% |
| IJJ | iShares S&P Mid-Cap 400 Value | | 109.46 | 10 | 0.02 | -2.26 | -4.02% |
| XMLV | PowerShares S&P MidCap Low Volatil ETF | | 53.59 | 54 | 0.41 | -1.22 | 0.77% |
| UMDD | ProShares UltraPro MidCap400 | | 22.31 | 36 | -0.63 | -7.71 | -0.05% |
| MVV | ProShares Ultra MidCap400 | | 58.42 | 36 | -0.70 | -5.36 | 0.92% |
| SMDD | ProShares UltraPro Short MidCap400 | | 12.69 | 59 | 1.20 | 8 | -5.75% |
| MYY | ProShares Short MidCap400 | | 21.26 | 69 | 0.24 | 2.7 | -0.91% |
| MZZ | ProShares UltraShort MidCap400 | | 12.23 | 34 | 1.37 | 5.43 | -2.71% |
| 12Stocks.com: Charts, Trends, Fundamental Data and Performances of MidCap Stocks | |
|
We now take in-depth look at all MidCap stocks including charts, multi-period performances and overall trends (as measured by Smart Investing & Trading Score). One can sort MidCap stocks (click link to choose) by Daily, Weekly and by Year-to-Date performances. Also, one can sort by size of the company or by market capitalization. |
| Select Your Default Chart Type: | |||||
| |||||
| Click on stock symbol or name for detailed view. Click on to add stock symbol to your watchlist and to view watchlist. Quick View: Move mouse or cursor over "Daily" to quickly view daily technical stock chart and over "Weekly" to view weekly technical stock chart. | |||||

 | CCCS CCC Intelligent Solutions Holdings Inc. |
| Sector: Technology | |
| SubSector: Software - Infrastructure | |
| MarketCap: 6990 Millions | |
| Recent Price: 11.48 Smart Investing & Trading Score: 43 | |
| Day Percent Change: 0.44% Day Change: 0.05 | |
| Week Change: -1.96% Year-to-date Change: 1.2% | |
| CCCS Links: Profile News Message Board | |
| Charts:- Daily , Weekly | |
| Add CCCS to Watchlist: View: Get Complete CCCS Trend Analysis ➞ | |
 | TECH Bio-Techne Corporation |
| Sector: Health Care | |
| SubSector: Biotechnology | |
| MarketCap: 6958.05 Millions | |
| Recent Price: 62.21 Smart Investing & Trading Score: 10 | |
| Day Percent Change: -0.83% Day Change: -0.52 | |
| Week Change: -6.77% Year-to-date Change: -19.4% | |
| TECH Links: Profile News Message Board | |
| Charts:- Daily , Weekly | |
| Add TECH to Watchlist: View: Get Complete TECH Trend Analysis ➞ | |
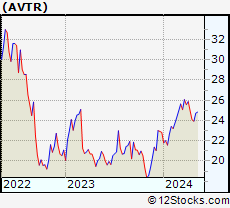 | AVTR Avantor, Inc. |
| Sector: Materials | |
| SubSector: Specialty Chemicals | |
| MarketCap: 6954 Millions | |
| Recent Price: 24.30 Smart Investing & Trading Score: 43 | |
| Day Percent Change: -0.33% Day Change: -0.08 | |
| Week Change: -2.64% Year-to-date Change: 6.4% | |
| AVTR Links: Profile News Message Board | |
| Charts:- Daily , Weekly | |
| Add AVTR to Watchlist: View: Get Complete AVTR Trend Analysis ➞ | |
 | DOX Amdocs Limited |
| Sector: Technology | |
| SubSector: Business Software & Services | |
| MarketCap: 6895.48 Millions | |
| Recent Price: 85.11 Smart Investing & Trading Score: 18 | |
| Day Percent Change: 0.21% Day Change: 0.18 | |
| Week Change: -0.7% Year-to-date Change: -3.2% | |
| DOX Links: Profile News Message Board | |
| Charts:- Daily , Weekly | |
| Add DOX to Watchlist: View: Get Complete DOX Trend Analysis ➞ | |
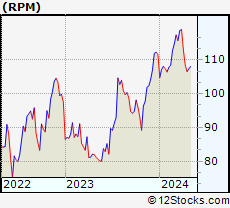 | RPM RPM International Inc. |
| Sector: Materials | |
| SubSector: Specialty Chemicals | |
| MarketCap: 6814.87 Millions | |
| Recent Price: 107.38 Smart Investing & Trading Score: 30 | |
| Day Percent Change: 0.02% Day Change: 0.02 | |
| Week Change: -0.99% Year-to-date Change: -3.8% | |
| RPM Links: Profile News Message Board | |
| Charts:- Daily , Weekly | |
| Add RPM to Watchlist: View: Get Complete RPM Trend Analysis ➞ | |
 | HSIC Henry Schein, Inc. |
| Sector: Services & Goods | |
| SubSector: Medical Equipment Wholesale | |
| MarketCap: 6760.9 Millions | |
| Recent Price: 69.97 Smart Investing & Trading Score: 10 | |
| Day Percent Change: -0.33% Day Change: -0.23 | |
| Week Change: -1.46% Year-to-date Change: -7.6% | |
| HSIC Links: Profile News Message Board | |
| Charts:- Daily , Weekly | |
| Add HSIC to Watchlist: View: Get Complete HSIC Trend Analysis ➞ | |
 | IONS Ionis Pharmaceuticals, Inc. |
| Sector: Health Care | |
| SubSector: Biotechnology | |
| MarketCap: 6725.05 Millions | |
| Recent Price: 40.81 Smart Investing & Trading Score: 10 | |
| Day Percent Change: -0.24% Day Change: -0.10 | |
| Week Change: -2.23% Year-to-date Change: -19.3% | |
| IONS Links: Profile News Message Board | |
| Charts:- Daily , Weekly | |
| Add IONS to Watchlist: View: Get Complete IONS Trend Analysis ➞ | |
 | FFIV F5 Networks, Inc. |
| Sector: Technology | |
| SubSector: Business Software & Services | |
| MarketCap: 6675.38 Millions | |
| Recent Price: 179.59 Smart Investing & Trading Score: 0 | |
| Day Percent Change: -0.94% Day Change: -1.71 | |
| Week Change: -6.51% Year-to-date Change: 0.3% | |
| FFIV Links: Profile News Message Board | |
| Charts:- Daily , Weekly | |
| Add FFIV to Watchlist: View: Get Complete FFIV Trend Analysis ➞ | |
 | WYNN Wynn Resorts, Limited |
| Sector: Services & Goods | |
| SubSector: Resorts & Casinos | |
| MarketCap: 6643.34 Millions | |
| Recent Price: 96.10 Smart Investing & Trading Score: 26 | |
| Day Percent Change: -1.42% Day Change: -1.38 | |
| Week Change: -5.02% Year-to-date Change: 5.5% | |
| WYNN Links: Profile News Message Board | |
| Charts:- Daily , Weekly | |
| Add WYNN to Watchlist: View: Get Complete WYNN Trend Analysis ➞ | |
 | AGNC AGNC Investment Corp. |
| Sector: Financials | |
| SubSector: Mortgage Investment | |
| MarketCap: 6622.19 Millions | |
| Recent Price: 9.06 Smart Investing & Trading Score: 25 | |
| Day Percent Change: 0.22% Day Change: 0.02 | |
| Week Change: -2.69% Year-to-date Change: -7.7% | |
| AGNC Links: Profile News Message Board | |
| Charts:- Daily , Weekly | |
| Add AGNC to Watchlist: View: Get Complete AGNC Trend Analysis ➞ | |
 | COLD Americold Realty Trust |
| Sector: Financials | |
| SubSector: REIT - Industrial | |
| MarketCap: 6569.69 Millions | |
| Recent Price: 22.73 Smart Investing & Trading Score: 0 | |
| Day Percent Change: -1.39% Day Change: -0.32 | |
| Week Change: -5.05% Year-to-date Change: -24.9% | |
| COLD Links: Profile News Message Board | |
| Charts:- Daily , Weekly | |
| Add COLD to Watchlist: View: Get Complete COLD Trend Analysis ➞ | |
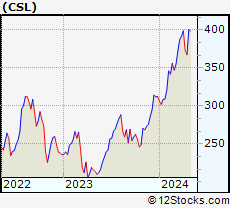 | CSL Carlisle Companies Incorporated |
| Sector: Consumer Staples | |
| SubSector: Rubber & Plastics | |
| MarketCap: 6542.7 Millions | |
| Recent Price: 367.41 Smart Investing & Trading Score: 41 | |
| Day Percent Change: -0.39% Day Change: -1.43 | |
| Week Change: -1.54% Year-to-date Change: 17.6% | |
| CSL Links: Profile News Message Board | |
| Charts:- Daily , Weekly | |
| Add CSL to Watchlist: View: Get Complete CSL Trend Analysis ➞ | |
 | DOCS Doximity, Inc. |
| Sector: Health Care | |
| SubSector: Health Information Services | |
| MarketCap: 6540 Millions | |
| Recent Price: 25.35 Smart Investing & Trading Score: 23 | |
| Day Percent Change: 0.64% Day Change: 0.16 | |
| Week Change: -2.01% Year-to-date Change: -10.8% | |
| DOCS Links: Profile News Message Board | |
| Charts:- Daily , Weekly | |
| Add DOCS to Watchlist: View: Get Complete DOCS Trend Analysis ➞ | |
 | ZG Zillow Group, Inc. |
| Sector: Technology | |
| SubSector: Internet Information Providers | |
| MarketCap: 6536.7 Millions | |
| Recent Price: 41.11 Smart Investing & Trading Score: 0 | |
| Day Percent Change: -1.84% Day Change: -0.77 | |
| Week Change: -5.95% Year-to-date Change: -27.5% | |
| ZG Links: Profile News Message Board | |
| Charts:- Daily , Weekly | |
| Add ZG to Watchlist: View: Get Complete ZG Trend Analysis ➞ | |
 | FNF Fidelity National Financial, Inc. |
| Sector: Financials | |
| SubSector: Surety & Title Insurance | |
| MarketCap: 6532.18 Millions | |
| Recent Price: 47.58 Smart Investing & Trading Score: 17 | |
| Day Percent Change: 1.19% Day Change: 0.56 | |
| Week Change: -2.12% Year-to-date Change: -6.7% | |
| FNF Links: Profile News Message Board | |
| Charts:- Daily , Weekly | |
| Add FNF to Watchlist: View: Get Complete FNF Trend Analysis ➞ | |
 | NRG NRG Energy, Inc. |
| Sector: Utilities | |
| SubSector: Diversified Utilities | |
| MarketCap: 6510.7 Millions | |
| Recent Price: 70.52 Smart Investing & Trading Score: 51 | |
| Day Percent Change: -3.95% Day Change: -2.90 | |
| Week Change: -4.61% Year-to-date Change: 36.4% | |
| NRG Links: Profile News Message Board | |
| Charts:- Daily , Weekly | |
| Add NRG to Watchlist: View: Get Complete NRG Trend Analysis ➞ | |
 | DV DoubleVerify Holdings, Inc. |
| Sector: Technology | |
| SubSector: Software - Application | |
| MarketCap: 6500 Millions | |
| Recent Price: 30.14 Smart Investing & Trading Score: 7 | |
| Day Percent Change: 0.37% Day Change: 0.11 | |
| Week Change: -6.86% Year-to-date Change: -18.1% | |
| DV Links: Profile News Message Board | |
| Charts:- Daily , Weekly | |
| Add DV to Watchlist: View: Get Complete DV Trend Analysis ➞ | |
 | PRGO Perrigo Company plc |
| Sector: Health Care | |
| SubSector: Drug Related Products | |
| MarketCap: 6493.93 Millions | |
| Recent Price: 29.94 Smart Investing & Trading Score: 28 | |
| Day Percent Change: -0.33% Day Change: -0.10 | |
| Week Change: -1.25% Year-to-date Change: -7.0% | |
| PRGO Links: Profile News Message Board | |
| Charts:- Daily , Weekly | |
| Add PRGO to Watchlist: View: Get Complete PRGO Trend Analysis ➞ | |
 | MPWR Monolithic Power Systems, Inc. |
| Sector: Technology | |
| SubSector: Semiconductor - Specialized | |
| MarketCap: 6436.4 Millions | |
| Recent Price: 620.31 Smart Investing & Trading Score: 26 | |
| Day Percent Change: -2.73% Day Change: -17.41 | |
| Week Change: -5.76% Year-to-date Change: -1.7% | |
| MPWR Links: Profile News Message Board | |
| Charts:- Daily , Weekly | |
| Add MPWR to Watchlist: View: Get Complete MPWR Trend Analysis ➞ | |
 | OHI Omega Healthcare Investors, Inc. |
| Sector: Financials | |
| SubSector: REIT - Healthcare Facilities | |
| MarketCap: 6433.84 Millions | |
| Recent Price: 29.98 Smart Investing & Trading Score: 36 | |
| Day Percent Change: 0.07% Day Change: 0.02 | |
| Week Change: -1.7% Year-to-date Change: -2.2% | |
| OHI Links: Profile News Message Board | |
| Charts:- Daily , Weekly | |
| Add OHI to Watchlist: View: Get Complete OHI Trend Analysis ➞ | |
 | TTC The Toro Company |
| Sector: Industrials | |
| SubSector: Small Tools & Accessories | |
| MarketCap: 6426.96 Millions | |
| Recent Price: 84.51 Smart Investing & Trading Score: 10 | |
| Day Percent Change: 0.27% Day Change: 0.23 | |
| Week Change: -1.47% Year-to-date Change: -12.0% | |
| TTC Links: Profile News Message Board | |
| Charts:- Daily , Weekly | |
| Add TTC to Watchlist: View: Get Complete TTC Trend Analysis ➞ | |
 | KRC Kilroy Realty Corporation |
| Sector: Financials | |
| SubSector: REIT - Office | |
| MarketCap: 6390.46 Millions | |
| Recent Price: 32.67 Smart Investing & Trading Score: 10 | |
| Day Percent Change: 0.83% Day Change: 0.27 | |
| Week Change: -2.39% Year-to-date Change: -18.0% | |
| KRC Links: Profile News Message Board | |
| Charts:- Daily , Weekly | |
| Add KRC to Watchlist: View: Get Complete KRC Trend Analysis ➞ | |
 | SEIC SEI Investments Company |
| Sector: Financials | |
| SubSector: Asset Management | |
| MarketCap: 6367.03 Millions | |
| Recent Price: 66.01 Smart Investing & Trading Score: 36 | |
| Day Percent Change: -0.11% Day Change: -0.07 | |
| Week Change: -2.18% Year-to-date Change: 3.9% | |
| SEIC Links: Profile News Message Board | |
| Charts:- Daily , Weekly | |
| Add SEIC to Watchlist: View: Get Complete SEIC Trend Analysis ➞ | |
 | CTLT Catalent, Inc. |
| Sector: Health Care | |
| SubSector: Drugs - Generic | |
| MarketCap: 6351.95 Millions | |
| Recent Price: 55.80 Smart Investing & Trading Score: 51 | |
| Day Percent Change: -0.29% Day Change: -0.16 | |
| Week Change: -0.89% Year-to-date Change: 24.2% | |
| CTLT Links: Profile News Message Board | |
| Charts:- Daily , Weekly | |
| Add CTLT to Watchlist: View: Get Complete CTLT Trend Analysis ➞ | |
 | REG Regency Centers Corporation |
| Sector: Financials | |
| SubSector: REIT - Retail | |
| MarketCap: 6345.84 Millions | |
| Recent Price: 57.76 Smart Investing & Trading Score: 25 | |
| Day Percent Change: 0.82% Day Change: 0.47 | |
| Week Change: -1.25% Year-to-date Change: -13.8% | |
| REG Links: Profile News Message Board | |
| Charts:- Daily , Weekly | |
| Add REG to Watchlist: View: Get Complete REG Trend Analysis ➞ | |
| For tabular summary view of above stock list: Summary View ➞ 0 - 25 , 25 - 50 , 50 - 75 , 75 - 100 , 100 - 125 , 125 - 150 , 150 - 175 , 175 - 200 | ||
| Click To Change The Sort Order: By Market Cap or Company Size Performance: Year-to-date, Week and Day | |
| Select Chart Type: | ||
|
Best Stocks Today 12Stocks.com |
© 2024 12Stocks.com Terms & Conditions Privacy Contact Us
All Information Provided Only For Education And Not To Be Used For Investing or Trading. See Terms & Conditions


One More Thing ... Get Best Stocks Delivered Daily!
Never Ever Miss A Move With Our Top Ten Stocks Lists
Find Best Stocks In Any Market - Bull or Bear Market
Take A Peek At Our Top Ten Stocks Lists: Daily, Weekly, Year-to-Date & Top Trends
Find Best Stocks In Any Market - Bull or Bear Market
Take A Peek At Our Top Ten Stocks Lists: Daily, Weekly, Year-to-Date & Top Trends
Midcap Stocks With Best Up Trends [0-bearish to 100-bullish]: Genuine Parts[100], United Airlines[100], Medical Properties[100], Alaska Air[100], Flowers Foods[100], HEICO [95], Generac [93], Bunge [93], Conagra [93], Inspire Medical[93], Coupang [90]
Best Midcap Stocks Year-to-Date:
AppLovin [77.99%], ShockWave Medical[71.87%], Vistra Energy[71.03%], Constellation Energy[59.78%], EMCOR [55.99%], Spotify [53.9%], Pure Storage[45.32%], CAVA [44.09%], Natera [39.34%], Wingstop [38.9%], Williams-Sonoma [38.53%] Best Midcap Stocks This Week:
Medical Properties[25.06%], United Airlines[23.01%], Genuine Parts[10.21%], AMC Entertainment[10.19%], Globe Life[10%], Advance Auto[9.5%], Bentley [8.14%], Alaska Air[7.6%], American Airlines[6.62%], Flowers Foods[6.28%], agilon health[5.96%] Best Midcap Stocks Daily:
Genuine Parts[11.22%], Ally Financial[6.73%], Coinbase Global[5.90%], Manpower [5.65%], United Airlines[5.50%], Iridium [5.46%], Ginkgo Bioworks[5.13%], Bank OZK[4.73%], agilon health[4.69%], Medical Properties[4.61%], Kohl s[4.53%]