
 Login Sign Up


| |||||
 |  | ||||

| 12Stocks.com Market Intelligence |
Best MidCap Stocks
|
| In a hurry? Mid Cap Stocks Lists: Performance Trends Table, Stock Charts
Sort midcap stocks: Daily, Weekly, Year-to-Date, Market Cap & Trends. Filter midcap stocks list by sector: Show all, Tech, Finance, Energy, Staples, Retail, Industrial, Materials, Utilities and HealthCare Filter midcap stocks list by size:All MidCap Large Mid-Range Small |
| 12Stocks.com Mid Cap Stocks Performances & Trends Daily | |||||||||
|
|  The overall Smart Investing & Trading Score is 26 (0-bearish to 100-bullish) which puts Mid Cap index in short term bearish to neutral trend. The Smart Investing & Trading Score from previous trading session is 31 and a deterioration of trend continues.
| ||||||||
Here are the Smart Investing & Trading Scores of the most requested mid cap stocks at 12Stocks.com (click stock name for detailed review):
|


| 12Stocks.com: Top Performing Mid Cap Index Stocks | ||||||||||||||||||||||||||||||||||||||||||||||||
 The top performing Mid Cap Index stocks year to date are
Now, more recently, over last week, the top performing Mid Cap Index stocks on the move are


|
||||||||||||||||||||||||||||||||||||||||||||||||
| 12Stocks.com: Investing in Midcap Index with Stocks | |
|
The following table helps investors and traders sort through current performance and trends (as measured by Smart Investing & Trading Score) of various
stocks in the Midcap Index. Quick View: Move mouse or cursor over stock symbol (ticker) to view short-term technical chart and over stock name to view long term chart. Click on  to add stock symbol to your watchlist and to add stock symbol to your watchlist and  to view watchlist. Click on any ticker or stock name for detailed market intelligence report for that stock. to view watchlist. Click on any ticker or stock name for detailed market intelligence report for that stock. |
12Stocks.com Performance of Stocks in Midcap Index
| Ticker | Stock Name | Watchlist | Category | Recent Price | Smart Investing & Trading Score | Change % | YTD Change% |
| TRMB | Trimble |   | Technology | 58.49 | 36 | -0.73% | 9.94% |
| SOFI | SoFi Technologies | | Financials | 7.16 | 17 | -0.63% | -27.36% |
| WU | Western Union | | Financials | 12.80 | 48 | 0.79% | 7.38% |
| FICO | Fair Isaac | | Technology | 1153.28 | 17 | 0.05% | -0.92% |
| LYFT | Lyft | | Technology | 17.31 | 31 | -5.25% | 15.48% |
| NBIX | Neurocrine Biosciences | | Health Care | 133.23 | 10 | 0.18% | 1.12% |
| LW | Lamb Weston | | Consumer Staples | 80.36 | 32 | -2.07% | -25.65% |
| GTLB | GitLab | | Technology | 53.56 | 7 | -0.56% | -15.48% |
| WRK | WestRock | | Consumer Staples | 47.23 | 48 | 0.04% | 13.75% |
| ROIV | Roivant Sciences | | Health Care | 10.45 | 26 | -2.43% | -5.90% |
| IT | Gartner | | Technology | 449.31 | 0 | -1.93% | -0.40% |
| ELAN | Elanco Animal | | Health Care | 13.41 | 0 | -1.69% | -10.00% |
| XRAY | DENTSPLY SIRONA | | Health Care | 30.36 | 0 | -1.40% | -14.70% |
| GGG | Graco | | Industrials | 88.43 | 26 | -0.72% | 1.92% |
| LII | Lennox | | Industrials | 457.85 | 43 | -0.68% | 2.31% |
| GL | Globe Life | | Financials | 63.23 | 32 | 5.44% | -48.05% |
| MDB | MongoDB | | Technology | 342.75 | 17 | -2.02% | -16.17% |
| DBX | Dropbox | | Technology | 22.80 | 17 | -0.61% | -22.66% |
| CPT | Camden Property | | Financials | 95.32 | 43 | 0.28% | -4.00% |
| ZS | Zscaler | | Technology | 172.96 | 10 | -0.78% | -21.94% |
| POOL | Pool | | Consumer Staples | 364.15 | 0 | -1.58% | -8.67% |
| CNP | CenterPoint Energy | | Utilities | 27.70 | 42 | 1.76% | -3.05% |
| HAS | Hasbro | | Consumer Staples | 54.82 | 36 | -0.38% | 7.36% |
| SRPT | Sarepta | | Health Care | 117.89 | 12 | 0.51% | 22.25% |
| CGNX | Cognex | | Technology | 39.21 | 36 | -1.03% | -6.06% |
| For chart view version of above stock list: Chart View ➞ 0 - 25 , 25 - 50 , 50 - 75 , 75 - 100 , 100 - 125 , 125 - 150 , 150 - 175 , 175 - 200 , 200 - 225 , 225 - 250 , 250 - 275 , 275 - 300 , 300 - 325 , 325 - 350 , 350 - 375 , 375 - 400 , 400 - 425 , 425 - 450 , 450 - 475 , 475 - 500 , 500 - 525 , 525 - 550 , 550 - 575 , 575 - 600 , 600 - 625 , 625 - 650 , 650 - 675 , 675 - 700 , 700 - 725 , 725 - 750 , 750 - 775 | ||
 | Click To Change The Sort Order: By Market Cap or Company Size Performance: Year-to-date, Week and Day |  |
|
Get the most comprehensive stock market coverage daily at 12Stocks.com ➞ Best Stocks Today ➞ Best Stocks Weekly ➞ Best Stocks Year-to-Date ➞ Best Stocks Trends ➞  Best Stocks Today 12Stocks.com Best Nasdaq Stocks ➞ Best S&P 500 Stocks ➞ Best Tech Stocks ➞ Best Biotech Stocks ➞ |
| Detailed Overview of Midcap Stocks |
| Midcap Technical Overview, Leaders & Laggards, Top Midcap ETF Funds & Detailed Midcap Stocks List, Charts, Trends & More |
| Midcap: Technical Analysis, Trends & YTD Performance | |
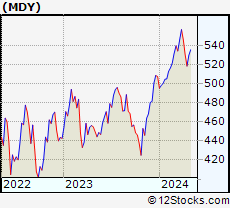
| MidCap segment as represented by
MDY, an exchange-traded fund [ETF], holds basket of about four hundred midcap stocks from across all major sectors of the US stock market. The midcap index (contains stocks like Green Mountain Coffee Roasters and Tractor Supply Company) is up by 1.95% and is currently underperforming the overall market by -2.46% year-to-date. Below is a quick view of technical charts and trends: | |
 MDY Weekly Chart |
|
| Long Term Trend: Good | |
| Medium Term Trend: Not Good | |
 MDY Daily Chart |
|
| Short Term Trend: Not Good | |
| Overall Trend Score: 26 | |
| YTD Performance: 1.95% | |
| **Trend Scores & Views Are Only For Educational Purposes And Not For Investing | |
| 12Stocks.com: Investing in Midcap Index using Exchange Traded Funds | |
|
The following table shows list of key exchange traded funds (ETF) that
help investors track Midcap index. The following list also includes leveraged ETF funds that track twice or thrice the daily returns of Midcap indices. Short or inverse ETF funds move in the opposite direction to the index they track and are useful during market pullbacks or during bear markets. Quick View: Move mouse or cursor over ETF symbol (ticker) to view short-term technical chart and over ETF name to view long term chart. Click on ticker or stock name for detailed view. Click on to add stock symbol to your watchlist and to view watchlist. |
12Stocks.com List of ETFs that track Midcap Index
| Ticker | ETF Name | Watchlist | Recent Price | Smart Investing & Trading Score | Change % | Week % | Year-to-date % |
| IJH | iShares Core S&P Mid-Cap | | 56.51 | 26 | -0.65 | -2.38 | 1.95% |
| IWR | iShares Russell Mid-Cap | | 78.82 | 33 | -0.35 | -2.23 | 1.4% |
| IWP | iShares Russell Mid-Cap Growth | | 107.02 | 26 | -0.67 | -2.57 | 2.45% |
| MDY | SPDR S&P MidCap 400 ETF | | 517.25 | 26 | -0.84 | -2.39 | 1.95% |
| IJK | iShares S&P Mid-Cap 400 Growth | | 85.34 | 31 | -0.88 | -2.45 | 7.73% |
| IWS | iShares Russell Mid-Cap Value | | 117.41 | 38 | -0.10 | -2.07 | 0.96% |
| IJJ | iShares S&P Mid-Cap 400 Value | | 109.44 | 0 | -0.69 | -2.28 | -4.03% |
| XMLV | PowerShares S&P MidCap Low Volatil ETF | | 53.37 | 36 | -0.58 | -1.62 | 0.36% |
| MVV | ProShares Ultra MidCap400 | | 58.83 | 26 | -1.97 | -4.7 | 1.62% |
| UMDD | ProShares UltraPro MidCap400 | | 22.45 | 26 | -2.52 | -7.12 | 0.58% |
| SMDD | ProShares UltraPro Short MidCap400 | | 12.54 | 57 | 2.20 | 6.72 | -6.86% |
| MZZ | ProShares UltraShort MidCap400 | | 12.07 | 34 | 0.72 | 4.01 | -4.02% |
| MYY | ProShares Short MidCap400 | | 21.21 | 74 | 0.90 | 2.46 | -1.14% |
| 12Stocks.com: Charts, Trends, Fundamental Data and Performances of MidCap Stocks | |
|
We now take in-depth look at all MidCap stocks including charts, multi-period performances and overall trends (as measured by Smart Investing & Trading Score). One can sort MidCap stocks (click link to choose) by Daily, Weekly and by Year-to-Date performances. Also, one can sort by size of the company or by market capitalization. |
| Select Your Default Chart Type: | |||||
| |||||
| Click on stock symbol or name for detailed view. Click on to add stock symbol to your watchlist and to view watchlist. Quick View: Move mouse or cursor over "Daily" to quickly view daily technical stock chart and over "Weekly" to view weekly technical stock chart. | |||||

 | TRMB Trimble Inc. |
| Sector: Technology | |
| SubSector: Scientific & Technical Instruments | |
| MarketCap: 7990.33 Millions | |
| Recent Price: 58.49 Smart Investing & Trading Score: 36 | |
| Day Percent Change: -0.73% Day Change: -0.43 | |
| Week Change: -3.39% Year-to-date Change: 9.9% | |
| TRMB Links: Profile News Message Board | |
| Charts:- Daily , Weekly | |
| Add TRMB to Watchlist: View: Get Complete TRMB Trend Analysis ➞ | |
 | SOFI SoFi Technologies, Inc. |
| Sector: Financials | |
| SubSector: Credit Services | |
| MarketCap: 7990 Millions | |
| Recent Price: 7.16 Smart Investing & Trading Score: 17 | |
| Day Percent Change: -0.63% Day Change: -0.04 | |
| Week Change: -2.39% Year-to-date Change: -27.4% | |
| SOFI Links: Profile News Message Board | |
| Charts:- Daily , Weekly | |
| Add SOFI to Watchlist: View: Get Complete SOFI Trend Analysis ➞ | |
 | WU The Western Union Company |
| Sector: Financials | |
| SubSector: Credit Services | |
| MarketCap: 7974.48 Millions | |
| Recent Price: 12.80 Smart Investing & Trading Score: 48 | |
| Day Percent Change: 0.79% Day Change: 0.10 | |
| Week Change: -2.96% Year-to-date Change: 7.4% | |
| WU Links: Profile News Message Board | |
| Charts:- Daily , Weekly | |
| Add WU to Watchlist: View: Get Complete WU Trend Analysis ➞ | |
 | FICO Fair Isaac Corporation |
| Sector: Technology | |
| SubSector: Business Software & Services | |
| MarketCap: 7930.98 Millions | |
| Recent Price: 1153.28 Smart Investing & Trading Score: 17 | |
| Day Percent Change: 0.05% Day Change: 0.58 | |
| Week Change: -1.9% Year-to-date Change: -0.9% | |
| FICO Links: Profile News Message Board | |
| Charts:- Daily , Weekly | |
| Add FICO to Watchlist: View: Get Complete FICO Trend Analysis ➞ | |
 | LYFT Lyft, Inc. |
| Sector: Technology | |
| SubSector: Application Software | |
| MarketCap: 7923.22 Millions | |
| Recent Price: 17.31 Smart Investing & Trading Score: 31 | |
| Day Percent Change: -5.25% Day Change: -0.96 | |
| Week Change: -7.73% Year-to-date Change: 15.5% | |
| LYFT Links: Profile News Message Board | |
| Charts:- Daily , Weekly | |
| Add LYFT to Watchlist: View: Get Complete LYFT Trend Analysis ➞ | |
 | NBIX Neurocrine Biosciences, Inc. |
| Sector: Health Care | |
| SubSector: Biotechnology | |
| MarketCap: 7897.85 Millions | |
| Recent Price: 133.23 Smart Investing & Trading Score: 10 | |
| Day Percent Change: 0.18% Day Change: 0.24 | |
| Week Change: -1.06% Year-to-date Change: 1.1% | |
| NBIX Links: Profile News Message Board | |
| Charts:- Daily , Weekly | |
| Add NBIX to Watchlist: View: Get Complete NBIX Trend Analysis ➞ | |
 | LW Lamb Weston Holdings, Inc. |
| Sector: Consumer Staples | |
| SubSector: Food - Major Diversified | |
| MarketCap: 7844.63 Millions | |
| Recent Price: 80.36 Smart Investing & Trading Score: 32 | |
| Day Percent Change: -2.07% Day Change: -1.70 | |
| Week Change: 0.74% Year-to-date Change: -25.7% | |
| LW Links: Profile News Message Board | |
| Charts:- Daily , Weekly | |
| Add LW to Watchlist: View: Get Complete LW Trend Analysis ➞ | |
 | GTLB GitLab Inc. |
| Sector: Technology | |
| SubSector: Software - Application | |
| MarketCap: 7840 Millions | |
| Recent Price: 53.56 Smart Investing & Trading Score: 7 | |
| Day Percent Change: -0.56% Day Change: -0.30 | |
| Week Change: -6.15% Year-to-date Change: -15.5% | |
| GTLB Links: Profile News Message Board | |
| Charts:- Daily , Weekly | |
| Add GTLB to Watchlist: View: Get Complete GTLB Trend Analysis ➞ | |
 | WRK WestRock Company |
| Sector: Consumer Staples | |
| SubSector: Packaging & Containers | |
| MarketCap: 7835.43 Millions | |
| Recent Price: 47.23 Smart Investing & Trading Score: 48 | |
| Day Percent Change: 0.04% Day Change: 0.02 | |
| Week Change: -1.58% Year-to-date Change: 13.8% | |
| WRK Links: Profile News Message Board | |
| Charts:- Daily , Weekly | |
| Add WRK to Watchlist: View: Get Complete WRK Trend Analysis ➞ | |
 | ROIV Roivant Sciences Ltd. |
| Sector: Health Care | |
| SubSector: Biotechnology | |
| MarketCap: 7780 Millions | |
| Recent Price: 10.45 Smart Investing & Trading Score: 26 | |
| Day Percent Change: -2.43% Day Change: -0.26 | |
| Week Change: -4.48% Year-to-date Change: -5.9% | |
| ROIV Links: Profile News Message Board | |
| Charts:- Daily , Weekly | |
| Add ROIV to Watchlist: View: Get Complete ROIV Trend Analysis ➞ | |
 | IT Gartner, Inc. |
| Sector: Technology | |
| SubSector: Information Technology Services | |
| MarketCap: 7767.98 Millions | |
| Recent Price: 449.31 Smart Investing & Trading Score: 0 | |
| Day Percent Change: -1.93% Day Change: -8.82 | |
| Week Change: -3.47% Year-to-date Change: -0.4% | |
| IT Links: Profile News Message Board | |
| Charts:- Daily , Weekly | |
| Add IT to Watchlist: View: Get Complete IT Trend Analysis ➞ | |
 | ELAN Elanco Animal Health Incorporated |
| Sector: Health Care | |
| SubSector: Drugs - Generic | |
| MarketCap: 7752.15 Millions | |
| Recent Price: 13.41 Smart Investing & Trading Score: 0 | |
| Day Percent Change: -1.69% Day Change: -0.23 | |
| Week Change: -6.55% Year-to-date Change: -10.0% | |
| ELAN Links: Profile News Message Board | |
| Charts:- Daily , Weekly | |
| Add ELAN to Watchlist: View: Get Complete ELAN Trend Analysis ➞ | |
 | XRAY DENTSPLY SIRONA Inc. |
| Sector: Health Care | |
| SubSector: Medical Instruments & Supplies | |
| MarketCap: 7746.1 Millions | |
| Recent Price: 30.36 Smart Investing & Trading Score: 0 | |
| Day Percent Change: -1.40% Day Change: -0.43 | |
| Week Change: -3% Year-to-date Change: -14.7% | |
| XRAY Links: Profile News Message Board | |
| Charts:- Daily , Weekly | |
| Add XRAY to Watchlist: View: Get Complete XRAY Trend Analysis ➞ | |
 | GGG Graco Inc. |
| Sector: Industrials | |
| SubSector: Diversified Machinery | |
| MarketCap: 7739.76 Millions | |
| Recent Price: 88.43 Smart Investing & Trading Score: 26 | |
| Day Percent Change: -0.72% Day Change: -0.64 | |
| Week Change: -1.16% Year-to-date Change: 1.9% | |
| GGG Links: Profile News Message Board | |
| Charts:- Daily , Weekly | |
| Add GGG to Watchlist: View: Get Complete GGG Trend Analysis ➞ | |
 | LII Lennox International Inc. |
| Sector: Industrials | |
| SubSector: Diversified Machinery | |
| MarketCap: 7720.66 Millions | |
| Recent Price: 457.85 Smart Investing & Trading Score: 43 | |
| Day Percent Change: -0.68% Day Change: -3.14 | |
| Week Change: -2.82% Year-to-date Change: 2.3% | |
| LII Links: Profile News Message Board | |
| Charts:- Daily , Weekly | |
| Add LII to Watchlist: View: Get Complete LII Trend Analysis ➞ | |
 | GL Globe Life Inc. |
| Sector: Financials | |
| SubSector: Life Insurance | |
| MarketCap: 7596.46 Millions | |
| Recent Price: 63.23 Smart Investing & Trading Score: 32 | |
| Day Percent Change: 5.44% Day Change: 3.26 | |
| Week Change: 7.01% Year-to-date Change: -48.1% | |
| GL Links: Profile News Message Board | |
| Charts:- Daily , Weekly | |
| Add GL to Watchlist: View: Get Complete GL Trend Analysis ➞ | |
 | MDB MongoDB, Inc. |
| Sector: Technology | |
| SubSector: Application Software | |
| MarketCap: 7591.22 Millions | |
| Recent Price: 342.75 Smart Investing & Trading Score: 17 | |
| Day Percent Change: -2.02% Day Change: -7.05 | |
| Week Change: -2.64% Year-to-date Change: -16.2% | |
| MDB Links: Profile News Message Board | |
| Charts:- Daily , Weekly | |
| Add MDB to Watchlist: View: Get Complete MDB Trend Analysis ➞ | |
 | DBX Dropbox, Inc. |
| Sector: Technology | |
| SubSector: Application Software | |
| MarketCap: 7588.32 Millions | |
| Recent Price: 22.80 Smart Investing & Trading Score: 17 | |
| Day Percent Change: -0.61% Day Change: -0.14 | |
| Week Change: -0.83% Year-to-date Change: -22.7% | |
| DBX Links: Profile News Message Board | |
| Charts:- Daily , Weekly | |
| Add DBX to Watchlist: View: Get Complete DBX Trend Analysis ➞ | |
 | CPT Camden Property Trust |
| Sector: Financials | |
| SubSector: REIT - Residential | |
| MarketCap: 7535.21 Millions | |
| Recent Price: 95.32 Smart Investing & Trading Score: 43 | |
| Day Percent Change: 0.28% Day Change: 0.27 | |
| Week Change: -2.68% Year-to-date Change: -4.0% | |
| CPT Links: Profile News Message Board | |
| Charts:- Daily , Weekly | |
| Add CPT to Watchlist: View: Get Complete CPT Trend Analysis ➞ | |
 | ZS Zscaler, Inc. |
| Sector: Technology | |
| SubSector: Security Software & Services | |
| MarketCap: 7532.17 Millions | |
| Recent Price: 172.96 Smart Investing & Trading Score: 10 | |
| Day Percent Change: -0.78% Day Change: -1.36 | |
| Week Change: -4.66% Year-to-date Change: -21.9% | |
| ZS Links: Profile News Message Board | |
| Charts:- Daily , Weekly | |
| Add ZS to Watchlist: View: Get Complete ZS Trend Analysis ➞ | |
 | POOL Pool Corporation |
| Sector: Consumer Staples | |
| SubSector: Sporting Goods | |
| MarketCap: 7479.64 Millions | |
| Recent Price: 364.15 Smart Investing & Trading Score: 0 | |
| Day Percent Change: -1.58% Day Change: -5.83 | |
| Week Change: -4.22% Year-to-date Change: -8.7% | |
| POOL Links: Profile News Message Board | |
| Charts:- Daily , Weekly | |
| Add POOL to Watchlist: View: Get Complete POOL Trend Analysis ➞ | |
 | CNP CenterPoint Energy, Inc. |
| Sector: Utilities | |
| SubSector: Gas Utilities | |
| MarketCap: 7444.07 Millions | |
| Recent Price: 27.70 Smart Investing & Trading Score: 42 | |
| Day Percent Change: 1.76% Day Change: 0.48 | |
| Week Change: 0.87% Year-to-date Change: -3.1% | |
| CNP Links: Profile News Message Board | |
| Charts:- Daily , Weekly | |
| Add CNP to Watchlist: View: Get Complete CNP Trend Analysis ➞ | |
 | HAS Hasbro, Inc. |
| Sector: Consumer Staples | |
| SubSector: Toys & Games | |
| MarketCap: 7389.5 Millions | |
| Recent Price: 54.82 Smart Investing & Trading Score: 36 | |
| Day Percent Change: -0.38% Day Change: -0.21 | |
| Week Change: -1.76% Year-to-date Change: 7.4% | |
| HAS Links: Profile News Message Board | |
| Charts:- Daily , Weekly | |
| Add HAS to Watchlist: View: Get Complete HAS Trend Analysis ➞ | |
 | SRPT Sarepta Therapeutics, Inc. |
| Sector: Health Care | |
| SubSector: Biotechnology | |
| MarketCap: 7388.05 Millions | |
| Recent Price: 117.89 Smart Investing & Trading Score: 12 | |
| Day Percent Change: 0.51% Day Change: 0.60 | |
| Week Change: -4.05% Year-to-date Change: 22.3% | |
| SRPT Links: Profile News Message Board | |
| Charts:- Daily , Weekly | |
| Add SRPT to Watchlist: View: Get Complete SRPT Trend Analysis ➞ | |
 | CGNX Cognex Corporation |
| Sector: Technology | |
| SubSector: Scientific & Technical Instruments | |
| MarketCap: 7373.13 Millions | |
| Recent Price: 39.21 Smart Investing & Trading Score: 36 | |
| Day Percent Change: -1.03% Day Change: -0.41 | |
| Week Change: -2.58% Year-to-date Change: -6.1% | |
| CGNX Links: Profile News Message Board | |
| Charts:- Daily , Weekly | |
| Add CGNX to Watchlist: View: Get Complete CGNX Trend Analysis ➞ | |
| For tabular summary view of above stock list: Summary View ➞ 0 - 25 , 25 - 50 , 50 - 75 , 75 - 100 , 100 - 125 , 125 - 150 , 150 - 175 , 175 - 200 , 200 - 225 , 225 - 250 , 250 - 275 , 275 - 300 , 300 - 325 , 325 - 350 , 350 - 375 , 375 - 400 , 400 - 425 , 425 - 450 , 450 - 475 , 475 - 500 , 500 - 525 , 525 - 550 , 550 - 575 , 575 - 600 , 600 - 625 , 625 - 650 , 650 - 675 , 675 - 700 , 700 - 725 , 725 - 750 , 750 - 775 | ||
| Click To Change The Sort Order: By Market Cap or Company Size Performance: Year-to-date, Week and Day | |
| Select Chart Type: | ||
|
Best Stocks Today 12Stocks.com |
© 2024 12Stocks.com Terms & Conditions Privacy Contact Us
All Information Provided Only For Education And Not To Be Used For Investing or Trading. See Terms & Conditions


One More Thing ... Get Best Stocks Delivered Daily!
Never Ever Miss A Move With Our Top Ten Stocks Lists
Find Best Stocks In Any Market - Bull or Bear Market
Take A Peek At Our Top Ten Stocks Lists: Daily, Weekly, Year-to-Date & Top Trends
Find Best Stocks In Any Market - Bull or Bear Market
Take A Peek At Our Top Ten Stocks Lists: Daily, Weekly, Year-to-Date & Top Trends
Midcap Stocks With Best Up Trends [0-bearish to 100-bullish]: United Airlines[100], Medical Properties[100], Coupang [100], HEICO [100], Conagra [95], Inspire Medical[93], Royal Gold[93], Bunge [93], Allegro Micro[93], SYNNEX [88], United [88]
Best Midcap Stocks Year-to-Date:
Vistra Energy[78.22%], AppLovin [78.06%], ShockWave Medical[71.86%], Constellation Energy[58.3%], EMCOR [57.45%], Spotify [56.23%], Pure Storage[46.72%], Natera [44.2%], NRG Energy[42.01%], CAVA [41.58%], Wingstop [40.14%] Best Midcap Stocks This Week:
Medical Properties[19.55%], United Airlines[16.6%], AMC Entertainment[12.45%], Globe Life[7.01%], Coupang [6.49%], American Airlines[5.63%], Inspire Medical[5.08%], Advance Auto[5.04%], New York[4.58%], Southwest Airlines[4.5%], Bentley [4.03%] Best Midcap Stocks Daily:
United Airlines[17.45%], agilon health[11.83%], Inspire Medical[9.87%], AMC Entertainment[9.56%], American Airlines[6.60%], Globe Life[5.44%], Sunrun [4.99%], Alaska Air[4.71%], Ultragenyx Pharmaceutical[4.25%], Advance Auto[3.41%], Consolidated Edison[3.33%]