
 Login Sign Up


| |||||
 |  | ||||

| 12Stocks.com Market Intelligence |
Best MidCap Stocks
|
| In a hurry? Mid Cap Stocks Lists: Performance Trends Table, Stock Charts
Sort midcap stocks: Daily, Weekly, Year-to-Date, Market Cap & Trends. Filter midcap stocks list by sector: Show all, Tech, Finance, Energy, Staples, Retail, Industrial, Materials, Utilities and HealthCare Filter midcap stocks list by size:All MidCap Large Mid-Range Small |
| 12Stocks.com Mid Cap Stocks Performances & Trends Daily | |||||||||
|
|  The overall Smart Investing & Trading Score is 36 (0-bearish to 100-bullish) which puts Mid Cap index in short term bearish to neutral trend. The Smart Investing & Trading Score from previous trading session is 26 and hence an improvement of trend.
| ||||||||
Here are the Smart Investing & Trading Scores of the most requested mid cap stocks at 12Stocks.com (click stock name for detailed review):
|


| 12Stocks.com: Top Performing Mid Cap Index Stocks | ||||||||||||||||||||||||||||||||||||||||||||||||
 The top performing Mid Cap Index stocks year to date are
Now, more recently, over last week, the top performing Mid Cap Index stocks on the move are


|
||||||||||||||||||||||||||||||||||||||||||||||||
| 12Stocks.com: Investing in Midcap Index with Stocks | |
|
The following table helps investors and traders sort through current performance and trends (as measured by Smart Investing & Trading Score) of various
stocks in the Midcap Index. Quick View: Move mouse or cursor over stock symbol (ticker) to view short-term technical chart and over stock name to view long term chart. Click on  to add stock symbol to your watchlist and to add stock symbol to your watchlist and  to view watchlist. Click on any ticker or stock name for detailed market intelligence report for that stock. to view watchlist. Click on any ticker or stock name for detailed market intelligence report for that stock. |
12Stocks.com Performance of Stocks in Midcap Index
| Ticker | Stock Name | Watchlist | Category | Recent Price | Smart Investing & Trading Score | Change % | YTD Change% |
| RKT | Rocket |   | Financials | 11.53 | 17 | 1.32% | -20.37% |
| NU | Nu | | Financials | 10.91 | 49 | 1.11% | 30.82% |
| BK | Bank of New York | | Financials | 55.25 | 43 | 1.45% | 6.15% |
| DLR | Digital Realty | | Financials | 136.66 | 7 | 0.67% | 1.55% |
| ALL | Allstate | | Financials | 169.11 | 68 | 3.80% | 20.81% |
| TROW | T. Rowe | | Financials | 108.72 | 18 | -2.40% | 0.96% |
| AFL | Aflac | | Financials | 80.98 | 32 | 0.90% | -1.84% |
| EQR | Equity Residential | | Financials | 60.99 | 61 | 0.96% | -0.28% |
| CSGP | CoStar | | Financials | 84.18 | 26 | -1.50% | -3.67% |
| WELL | Welltower | | Financials | 90.81 | 56 | 1.24% | 0.71% |
| PRU | Prudential Financial | | Financials | 108.70 | 51 | 1.26% | 4.81% |
| AVB | AvalonBay Communities | | Financials | 182.02 | 61 | 0.59% | -2.78% |
| STT | State Street | | Financials | 73.04 | 17 | 0.32% | -5.71% |
| SPG | Simon Property | | Financials | 140.37 | 36 | -0.40% | -1.59% |
| KKR | KKR | | Financials | 93.35 | 26 | -1.35% | 12.67% |
| O | Realty ome | | Financials | 52.03 | 42 | 1.46% | -9.39% |
| IBKR | Interactive Brokers | | Financials | 110.60 | 68 | 1.25% | 33.41% |
| ARE | Alexandria Real | | Financials | 116.51 | 20 | 0.05% | -8.09% |
| COIN | Coinbase Global | | Financials | 226.35 | 63 | 5.90% | 31.00% |
| OWL | Blue Owl | | Financials | 18.58 | 68 | 1.47% | 24.78% |
| NTRS | Northern Trust | | Financials | 81.41 | 46 | 0.22% | -3.52% |
| NDAQ | Nasdaq | | Financials | 60.07 | 54 | 0.10% | 3.32% |
| AJG | Arthur J. | | Financials | 233.99 | 58 | 1.51% | 4.05% |
| MTB | M&T Bank | | Financials | 139.30 | 60 | 0.19% | 1.62% |
| BXP | Boston Properties | | Financials | 58.69 | 18 | 1.28% | -16.36% |
| For chart view version of above stock list: Chart View ➞ 0 - 25 , 25 - 50 , 50 - 75 , 75 - 100 , 100 - 125 , 125 - 150 , 150 - 175 | ||
 | Click To Change The Sort Order: By Market Cap or Company Size Performance: Year-to-date, Week and Day |  |
|
Get the most comprehensive stock market coverage daily at 12Stocks.com ➞ Best Stocks Today ➞ Best Stocks Weekly ➞ Best Stocks Year-to-Date ➞ Best Stocks Trends ➞  Best Stocks Today 12Stocks.com Best Nasdaq Stocks ➞ Best S&P 500 Stocks ➞ Best Tech Stocks ➞ Best Biotech Stocks ➞ |
| Detailed Overview of Midcap Stocks |
| Midcap Technical Overview, Leaders & Laggards, Top Midcap ETF Funds & Detailed Midcap Stocks List, Charts, Trends & More |
| Midcap: Technical Analysis, Trends & YTD Performance | |
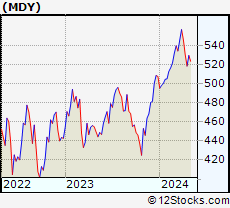
| MidCap segment as represented by
MDY, an exchange-traded fund [ETF], holds basket of about four hundred midcap stocks from across all major sectors of the US stock market. The midcap index (contains stocks like Green Mountain Coffee Roasters and Tractor Supply Company) is up by 1.81% and is currently underperforming the overall market by -2.38% year-to-date. Below is a quick view of technical charts and trends: | |
 MDY Weekly Chart |
|
| Long Term Trend: Good | |
| Medium Term Trend: Not Good | |
 MDY Daily Chart |
|
| Short Term Trend: Not Good | |
| Overall Trend Score: 36 | |
| YTD Performance: 1.81% | |
| **Trend Scores & Views Are Only For Educational Purposes And Not For Investing | |
| 12Stocks.com: Investing in Midcap Index using Exchange Traded Funds | |
|
The following table shows list of key exchange traded funds (ETF) that
help investors track Midcap index. The following list also includes leveraged ETF funds that track twice or thrice the daily returns of Midcap indices. Short or inverse ETF funds move in the opposite direction to the index they track and are useful during market pullbacks or during bear markets. Quick View: Move mouse or cursor over ETF symbol (ticker) to view short-term technical chart and over ETF name to view long term chart. Click on ticker or stock name for detailed view. Click on to add stock symbol to your watchlist and to view watchlist. |
12Stocks.com List of ETFs that track Midcap Index
| Ticker | ETF Name | Watchlist | Recent Price | Smart Investing & Trading Score | Change % | Week % | Year-to-date % |
| IJH | iShares Core S&P Mid-Cap | | 56.43 | 36 | -0.14 | -2.52 | 1.8% |
| IWR | iShares Russell Mid-Cap | | 78.71 | 36 | -0.14 | -2.37 | 1.26% |
| MDY | SPDR S&P MidCap 400 ETF | | 516.55 | 36 | -0.14 | -2.53 | 1.81% |
| IWP | iShares Russell Mid-Cap Growth | | 106.50 | 26 | -0.49 | -3.04 | 1.95% |
| IWS | iShares Russell Mid-Cap Value | | 117.31 | 41 | -0.09 | -2.15 | 0.88% |
| IJK | iShares S&P Mid-Cap 400 Growth | | 85.03 | 36 | -0.36 | -2.8 | 7.33% |
| IJJ | iShares S&P Mid-Cap 400 Value | | 109.46 | 10 | 0.02 | -2.26 | -4.02% |
| XMLV | PowerShares S&P MidCap Low Volatil ETF | | 53.59 | 54 | 0.41 | -1.22 | 0.77% |
| UMDD | ProShares UltraPro MidCap400 | | 22.31 | 36 | -0.63 | -7.71 | -0.05% |
| MVV | ProShares Ultra MidCap400 | | 58.42 | 36 | -0.70 | -5.36 | 0.92% |
| SMDD | ProShares UltraPro Short MidCap400 | | 12.69 | 59 | 1.20 | 8 | -5.75% |
| MYY | ProShares Short MidCap400 | | 21.26 | 69 | 0.24 | 2.7 | -0.91% |
| MZZ | ProShares UltraShort MidCap400 | | 12.23 | 34 | 1.37 | 5.43 | -2.71% |
| 12Stocks.com: Charts, Trends, Fundamental Data and Performances of MidCap Stocks | |
|
We now take in-depth look at all MidCap stocks including charts, multi-period performances and overall trends (as measured by Smart Investing & Trading Score). One can sort MidCap stocks (click link to choose) by Daily, Weekly and by Year-to-Date performances. Also, one can sort by size of the company or by market capitalization. |
| Select Your Default Chart Type: | |||||
| |||||
| Click on stock symbol or name for detailed view. Click on to add stock symbol to your watchlist and to view watchlist. Quick View: Move mouse or cursor over "Daily" to quickly view daily technical stock chart and over "Weekly" to view weekly technical stock chart. | |||||

 | RKT Rocket Companies, Inc. |
| Sector: Financials | |
| SubSector: Mortgage Finance | |
| MarketCap: 41287 Millions | |
| Recent Price: 11.53 Smart Investing & Trading Score: 17 | |
| Day Percent Change: 1.32% Day Change: 0.15 | |
| Week Change: -5.88% Year-to-date Change: -20.4% | |
| RKT Links: Profile News Message Board | |
| Charts:- Daily , Weekly | |
| Add RKT to Watchlist: View: Get Complete RKT Trend Analysis ➞ | |
 | NU Nu Holdings Ltd. |
| Sector: Financials | |
| SubSector: Banks - Diversified | |
| MarketCap: 37240 Millions | |
| Recent Price: 10.91 Smart Investing & Trading Score: 49 | |
| Day Percent Change: 1.11% Day Change: 0.12 | |
| Week Change: -3.37% Year-to-date Change: 30.8% | |
| NU Links: Profile News Message Board | |
| Charts:- Daily , Weekly | |
| Add NU to Watchlist: View: Get Complete NU Trend Analysis ➞ | |
 | BK The Bank of New York Mellon Corporation |
| Sector: Financials | |
| SubSector: Asset Management | |
| MarketCap: 29807.5 Millions | |
| Recent Price: 55.25 Smart Investing & Trading Score: 43 | |
| Day Percent Change: 1.45% Day Change: 0.79 | |
| Week Change: 0.36% Year-to-date Change: 6.2% | |
| BK Links: Profile News Message Board | |
| Charts:- Daily , Weekly | |
| Add BK to Watchlist: View: Get Complete BK Trend Analysis ➞ | |
 | DLR Digital Realty Trust, Inc. |
| Sector: Financials | |
| SubSector: REIT - Office | |
| MarketCap: 27038.6 Millions | |
| Recent Price: 136.66 Smart Investing & Trading Score: 7 | |
| Day Percent Change: 0.67% Day Change: 0.91 | |
| Week Change: -4.09% Year-to-date Change: 1.6% | |
| DLR Links: Profile News Message Board | |
| Charts:- Daily , Weekly | |
| Add DLR to Watchlist: View: Get Complete DLR Trend Analysis ➞ | |
 | ALL The Allstate Corporation |
| Sector: Financials | |
| SubSector: Property & Casualty Insurance | |
| MarketCap: 25916.6 Millions | |
| Recent Price: 169.11 Smart Investing & Trading Score: 68 | |
| Day Percent Change: 3.80% Day Change: 6.19 | |
| Week Change: 1.38% Year-to-date Change: 20.8% | |
| ALL Links: Profile News Message Board | |
| Charts:- Daily , Weekly | |
| Add ALL to Watchlist: View: Get Complete ALL Trend Analysis ➞ | |
 | TROW T. Rowe Price Group, Inc. |
| Sector: Financials | |
| SubSector: Asset Management | |
| MarketCap: 24530 Millions | |
| Recent Price: 108.72 Smart Investing & Trading Score: 18 | |
| Day Percent Change: -2.40% Day Change: -2.67 | |
| Week Change: -5.62% Year-to-date Change: 1.0% | |
| TROW Links: Profile News Message Board | |
| Charts:- Daily , Weekly | |
| Add TROW to Watchlist: View: Get Complete TROW Trend Analysis ➞ | |
 | AFL Aflac Incorporated |
| Sector: Financials | |
| SubSector: Accident & Health Insurance | |
| MarketCap: 22706 Millions | |
| Recent Price: 80.98 Smart Investing & Trading Score: 32 | |
| Day Percent Change: 0.90% Day Change: 0.72 | |
| Week Change: 0.87% Year-to-date Change: -1.8% | |
| AFL Links: Profile News Message Board | |
| Charts:- Daily , Weekly | |
| Add AFL to Watchlist: View: Get Complete AFL Trend Analysis ➞ | |
 | EQR Equity Residential |
| Sector: Financials | |
| SubSector: REIT - Residential | |
| MarketCap: 22061.9 Millions | |
| Recent Price: 60.99 Smart Investing & Trading Score: 61 | |
| Day Percent Change: 0.96% Day Change: 0.58 | |
| Week Change: -1.13% Year-to-date Change: -0.3% | |
| EQR Links: Profile News Message Board | |
| Charts:- Daily , Weekly | |
| Add EQR to Watchlist: View: Get Complete EQR Trend Analysis ➞ | |
 | CSGP CoStar Group, Inc. |
| Sector: Financials | |
| SubSector: Property Management | |
| MarketCap: 21454.4 Millions | |
| Recent Price: 84.18 Smart Investing & Trading Score: 26 | |
| Day Percent Change: -1.50% Day Change: -1.28 | |
| Week Change: -6.82% Year-to-date Change: -3.7% | |
| CSGP Links: Profile News Message Board | |
| Charts:- Daily , Weekly | |
| Add CSGP to Watchlist: View: Get Complete CSGP Trend Analysis ➞ | |
 | WELL Welltower Inc. |
| Sector: Financials | |
| SubSector: REIT - Healthcare Facilities | |
| MarketCap: 21398.8 Millions | |
| Recent Price: 90.81 Smart Investing & Trading Score: 56 | |
| Day Percent Change: 1.24% Day Change: 1.11 | |
| Week Change: 1.14% Year-to-date Change: 0.7% | |
| WELL Links: Profile News Message Board | |
| Charts:- Daily , Weekly | |
| Add WELL to Watchlist: View: Get Complete WELL Trend Analysis ➞ | |
 | PRU Prudential Financial, Inc. |
| Sector: Financials | |
| SubSector: Life Insurance | |
| MarketCap: 21001.6 Millions | |
| Recent Price: 108.70 Smart Investing & Trading Score: 51 | |
| Day Percent Change: 1.26% Day Change: 1.35 | |
| Week Change: -0.9% Year-to-date Change: 4.8% | |
| PRU Links: Profile News Message Board | |
| Charts:- Daily , Weekly | |
| Add PRU to Watchlist: View: Get Complete PRU Trend Analysis ➞ | |
 | AVB AvalonBay Communities, Inc. |
| Sector: Financials | |
| SubSector: REIT - Residential | |
| MarketCap: 19921.9 Millions | |
| Recent Price: 182.02 Smart Investing & Trading Score: 61 | |
| Day Percent Change: 0.59% Day Change: 1.07 | |
| Week Change: -0.96% Year-to-date Change: -2.8% | |
| AVB Links: Profile News Message Board | |
| Charts:- Daily , Weekly | |
| Add AVB to Watchlist: View: Get Complete AVB Trend Analysis ➞ | |
 | STT State Street Corporation |
| Sector: Financials | |
| SubSector: Asset Management | |
| MarketCap: 18623 Millions | |
| Recent Price: 73.04 Smart Investing & Trading Score: 17 | |
| Day Percent Change: 0.32% Day Change: 0.23 | |
| Week Change: -3.62% Year-to-date Change: -5.7% | |
| STT Links: Profile News Message Board | |
| Charts:- Daily , Weekly | |
| Add STT to Watchlist: View: Get Complete STT Trend Analysis ➞ | |
 | SPG Simon Property Group, Inc. |
| Sector: Financials | |
| SubSector: REIT - Retail | |
| MarketCap: 17959.6 Millions | |
| Recent Price: 140.37 Smart Investing & Trading Score: 36 | |
| Day Percent Change: -0.40% Day Change: -0.57 | |
| Week Change: -3.07% Year-to-date Change: -1.6% | |
| SPG Links: Profile News Message Board | |
| Charts:- Daily , Weekly | |
| Add SPG to Watchlist: View: Get Complete SPG Trend Analysis ➞ | |
 | KKR KKR & Co. Inc. |
| Sector: Financials | |
| SubSector: Asset Management | |
| MarketCap: 17722.5 Millions | |
| Recent Price: 93.35 Smart Investing & Trading Score: 26 | |
| Day Percent Change: -1.35% Day Change: -1.28 | |
| Week Change: -4.05% Year-to-date Change: 12.7% | |
| KKR Links: Profile News Message Board | |
| Charts:- Daily , Weekly | |
| Add KKR to Watchlist: View: Get Complete KKR Trend Analysis ➞ | |
 | O Realty Income Corporation |
| Sector: Financials | |
| SubSector: REIT - Retail | |
| MarketCap: 17647.4 Millions | |
| Recent Price: 52.03 Smart Investing & Trading Score: 42 | |
| Day Percent Change: 1.46% Day Change: 0.75 | |
| Week Change: 0.02% Year-to-date Change: -9.4% | |
| O Links: Profile News Message Board | |
| Charts:- Daily , Weekly | |
| Add O to Watchlist: View: Get Complete O Trend Analysis ➞ | |
 | IBKR Interactive Brokers Group, Inc. |
| Sector: Financials | |
| SubSector: Investment Brokerage - National | |
| MarketCap: 16975.7 Millions | |
| Recent Price: 110.60 Smart Investing & Trading Score: 68 | |
| Day Percent Change: 1.25% Day Change: 1.37 | |
| Week Change: 0.19% Year-to-date Change: 33.4% | |
| IBKR Links: Profile News Message Board | |
| Charts:- Daily , Weekly | |
| Add IBKR to Watchlist: View: Get Complete IBKR Trend Analysis ➞ | |
 | ARE Alexandria Real Estate Equities, Inc. |
| Sector: Financials | |
| SubSector: REIT - Office | |
| MarketCap: 16793.6 Millions | |
| Recent Price: 116.51 Smart Investing & Trading Score: 20 | |
| Day Percent Change: 0.05% Day Change: 0.06 | |
| Week Change: -4.37% Year-to-date Change: -8.1% | |
| ARE Links: Profile News Message Board | |
| Charts:- Daily , Weekly | |
| Add ARE to Watchlist: View: Get Complete ARE Trend Analysis ➞ | |
 | COIN Coinbase Global, Inc. |
| Sector: Financials | |
| SubSector: Financial Data & Stock Exchanges | |
| MarketCap: 16390 Millions | |
| Recent Price: 226.35 Smart Investing & Trading Score: 63 | |
| Day Percent Change: 5.90% Day Change: 12.62 | |
| Week Change: -7.89% Year-to-date Change: 31.0% | |
| COIN Links: Profile News Message Board | |
| Charts:- Daily , Weekly | |
| Add COIN to Watchlist: View: Get Complete COIN Trend Analysis ➞ | |
 | OWL Blue Owl Capital Inc. |
| Sector: Financials | |
| SubSector: Asset Management | |
| MarketCap: 16240 Millions | |
| Recent Price: 18.58 Smart Investing & Trading Score: 68 | |
| Day Percent Change: 1.47% Day Change: 0.27 | |
| Week Change: 0.22% Year-to-date Change: 24.8% | |
| OWL Links: Profile News Message Board | |
| Charts:- Daily , Weekly | |
| Add OWL to Watchlist: View: Get Complete OWL Trend Analysis ➞ | |
 | NTRS Northern Trust Corporation |
| Sector: Financials | |
| SubSector: Asset Management | |
| MarketCap: 15316.8 Millions | |
| Recent Price: 81.41 Smart Investing & Trading Score: 46 | |
| Day Percent Change: 0.22% Day Change: 0.18 | |
| Week Change: -2.89% Year-to-date Change: -3.5% | |
| NTRS Links: Profile News Message Board | |
| Charts:- Daily , Weekly | |
| Add NTRS to Watchlist: View: Get Complete NTRS Trend Analysis ➞ | |
 | NDAQ Nasdaq, Inc. |
| Sector: Financials | |
| SubSector: Diversified Investments | |
| MarketCap: 14885.2 Millions | |
| Recent Price: 60.07 Smart Investing & Trading Score: 54 | |
| Day Percent Change: 0.10% Day Change: 0.06 | |
| Week Change: -2.36% Year-to-date Change: 3.3% | |
| NDAQ Links: Profile News Message Board | |
| Charts:- Daily , Weekly | |
| Add NDAQ to Watchlist: View: Get Complete NDAQ Trend Analysis ➞ | |
 | AJG Arthur J. Gallagher & Co. |
| Sector: Financials | |
| SubSector: Insurance Brokers | |
| MarketCap: 14852.2 Millions | |
| Recent Price: 233.99 Smart Investing & Trading Score: 58 | |
| Day Percent Change: 1.51% Day Change: 3.47 | |
| Week Change: -0.25% Year-to-date Change: 4.1% | |
| AJG Links: Profile News Message Board | |
| Charts:- Daily , Weekly | |
| Add AJG to Watchlist: View: Get Complete AJG Trend Analysis ➞ | |
 | MTB M&T Bank Corporation |
| Sector: Financials | |
| SubSector: Regional - Northeast Banks | |
| MarketCap: 13950.9 Millions | |
| Recent Price: 139.30 Smart Investing & Trading Score: 60 | |
| Day Percent Change: 0.19% Day Change: 0.26 | |
| Week Change: 3.52% Year-to-date Change: 1.6% | |
| MTB Links: Profile News Message Board | |
| Charts:- Daily , Weekly | |
| Add MTB to Watchlist: View: Get Complete MTB Trend Analysis ➞ | |
 | BXP Boston Properties, Inc. |
| Sector: Financials | |
| SubSector: REIT - Office | |
| MarketCap: 13788.6 Millions | |
| Recent Price: 58.69 Smart Investing & Trading Score: 18 | |
| Day Percent Change: 1.28% Day Change: 0.74 | |
| Week Change: -3.17% Year-to-date Change: -16.4% | |
| BXP Links: Profile News Message Board | |
| Charts:- Daily , Weekly | |
| Add BXP to Watchlist: View: Get Complete BXP Trend Analysis ➞ | |
| For tabular summary view of above stock list: Summary View ➞ 0 - 25 , 25 - 50 , 50 - 75 , 75 - 100 , 100 - 125 , 125 - 150 , 150 - 175 | ||
| Click To Change The Sort Order: By Market Cap or Company Size Performance: Year-to-date, Week and Day | |
| Select Chart Type: | ||
|
Best Stocks Today 12Stocks.com |
© 2024 12Stocks.com Terms & Conditions Privacy Contact Us
All Information Provided Only For Education And Not To Be Used For Investing or Trading. See Terms & Conditions


One More Thing ... Get Best Stocks Delivered Daily!
Never Ever Miss A Move With Our Top Ten Stocks Lists
Find Best Stocks In Any Market - Bull or Bear Market
Take A Peek At Our Top Ten Stocks Lists: Daily, Weekly, Year-to-Date & Top Trends
Find Best Stocks In Any Market - Bull or Bear Market
Take A Peek At Our Top Ten Stocks Lists: Daily, Weekly, Year-to-Date & Top Trends
Midcap Stocks With Best Up Trends [0-bearish to 100-bullish]: Genuine Parts[100], United Airlines[100], Medical Properties[100], Alaska Air[100], Flowers Foods[100], HEICO [95], Generac [93], Bunge [93], Conagra [93], Inspire Medical[93], Coupang [90]
Best Midcap Stocks Year-to-Date:
AppLovin [77.99%], ShockWave Medical[71.87%], Vistra Energy[71.03%], Constellation Energy[59.78%], EMCOR [55.99%], Spotify [53.9%], Pure Storage[45.32%], CAVA [44.09%], Natera [39.34%], Wingstop [38.9%], Williams-Sonoma [38.53%] Best Midcap Stocks This Week:
Medical Properties[25.06%], United Airlines[23.01%], Genuine Parts[10.21%], AMC Entertainment[10.19%], Globe Life[10%], Advance Auto[9.5%], Bentley [8.14%], Alaska Air[7.6%], American Airlines[6.62%], Flowers Foods[6.28%], agilon health[5.96%] Best Midcap Stocks Daily:
Genuine Parts[11.22%], Ally Financial[6.73%], Coinbase Global[5.90%], Manpower [5.65%], United Airlines[5.50%], Iridium [5.46%], Ginkgo Bioworks[5.13%], Bank OZK[4.73%], agilon health[4.69%], Medical Properties[4.61%], Kohl s[4.53%]