
 Login Sign Up


| |||||
 |  | ||||

| 12Stocks.com Market Intelligence |
Best MidCap Stocks
|
| In a hurry? Mid Cap Stocks Lists: Performance Trends Table, Stock Charts
Sort midcap stocks: Daily, Weekly, Year-to-Date, Market Cap & Trends. Filter midcap stocks list by sector: Show all, Tech, Finance, Energy, Staples, Retail, Industrial, Materials, Utilities and HealthCare Filter midcap stocks list by size:All MidCap Large Mid-Range Small |
| 12Stocks.com Mid Cap Stocks Performances & Trends Daily | |||||||||
|
|  The overall Smart Investing & Trading Score is 26 (0-bearish to 100-bullish) which puts Mid Cap index in short term bearish to neutral trend. The Smart Investing & Trading Score from previous trading session is 31 and hence a deterioration of trend.
| ||||||||
Here are the Smart Investing & Trading Scores of the most requested mid cap stocks at 12Stocks.com (click stock name for detailed review):
|


| 12Stocks.com: Top Performing Mid Cap Index Stocks | ||||||||||||||||||||||||||||||||||||||||||||||||
 The top performing Mid Cap Index stocks year to date are
Now, more recently, over last week, the top performing Mid Cap Index stocks on the move are


|
||||||||||||||||||||||||||||||||||||||||||||||||
| 12Stocks.com: Investing in Midcap Index with Stocks | |
|
The following table helps investors and traders sort through current performance and trends (as measured by Smart Investing & Trading Score) of various
stocks in the Midcap Index. Quick View: Move mouse or cursor over stock symbol (ticker) to view short-term technical chart and over stock name to view long term chart. Click on  to add stock symbol to your watchlist and to add stock symbol to your watchlist and  to view watchlist. Click on any ticker or stock name for detailed market intelligence report for that stock. to view watchlist. Click on any ticker or stock name for detailed market intelligence report for that stock. |
12Stocks.com Performance of Stocks in Midcap Index
| Ticker | Stock Name | Watchlist | Category | Recent Price | Smart Investing & Trading Score | Change % | YTD Change% |
| CARR | Carrier Global |   | Industrials | 54.76 | 13 | -1.26% | -4.68% |
| CPNG | Coupang | | Services & Goods | 22.51 | 100 | 3.97% | 38.95% |
| BK | Bank of New York | | Financials | 54.00 | 0 | -1.98% | 3.75% |
| CEG | Constellation Energy | | Utilities | 186.66 | 51 | 0.68% | 59.39% |
| XEL | Xcel Energy | | Utilities | 52.53 | 20 | -1.20% | -15.15% |
| RPRX | Royalty Pharma | | Health Care | 27.78 | 10 | -1.66% | -1.10% |
| OTIS | Otis Worldwide | | Industrials | 95.98 | 41 | -0.07% | 7.28% |
| EA | Electronic Arts | | Technology | 126.58 | 0 | -0.37% | -7.48% |
| DLR | Digital Realty | | Financials | 136.43 | 0 | -1.54% | 1.37% |
| KR | Kroger Co | | Services & Goods | 55.28 | 53 | -0.14% | 20.94% |
| SBAC | SBA | | Technology | 195.01 | 0 | -2.43% | -23.13% |
| CTSH | Cognizant | | Technology | 67.95 | 0 | -0.69% | -10.04% |
| RSG | Republic Services | | Industrials | 187.48 | 48 | 0.13% | 13.69% |
| ALL | Allstate | | Financials | 164.21 | 39 | -0.94% | 17.31% |
| DD | DuPont de | | Materials | 72.57 | 36 | -1.18% | -5.67% |
| HRL | Hormel Foods | | Consumer Staples | 33.81 | 36 | -0.29% | 5.29% |
| RBLX | Roblox | | Services & Goods | 36.64 | 0 | -0.05% | -20.60% |
| PSX | Phillips 66 | | Energy | 157.88 | 36 | -1.83% | 18.58% |
| ED | Consolidated Edison | | Utilities | 87.42 | 18 | -2.13% | -3.90% |
| ROST | Ross Stores | | Services & Goods | 133.85 | 10 | 0.15% | -3.28% |
| WEC | WEC Energy | | Utilities | 77.80 | 10 | -1.38% | -7.57% |
| TROW | T. Rowe | | Financials | 112.11 | 36 | -1.87% | 4.10% |
| SPOT | Spotify | | Services & Goods | 299.96 | 51 | 3.25% | 59.63% |
| FOX | Twenty-First Century | | Services & Goods | 27.95 | 35 | 0.11% | 1.08% |
| ES | Eversource Energy | | Utilities | 57.20 | 36 | -1.79% | -7.32% |
| For chart view version of above stock list: Chart View ➞ 0 - 25 , 25 - 50 , 50 - 75 , 75 - 100 , 100 - 125 , 125 - 150 , 150 - 175 , 175 - 200 , 200 - 225 , 225 - 250 , 250 - 275 , 275 - 300 , 300 - 325 , 325 - 350 , 350 - 375 , 375 - 400 , 400 - 425 , 425 - 450 , 450 - 475 , 475 - 500 , 500 - 525 , 525 - 550 , 550 - 575 , 575 - 600 , 600 - 625 , 625 - 650 , 650 - 675 , 675 - 700 , 700 - 725 , 725 - 750 , 750 - 775 | ||
 | Click To Change The Sort Order: By Market Cap or Company Size Performance: Year-to-date, Week and Day |  |
|
Get the most comprehensive stock market coverage daily at 12Stocks.com ➞ Best Stocks Today ➞ Best Stocks Weekly ➞ Best Stocks Year-to-Date ➞ Best Stocks Trends ➞  Best Stocks Today 12Stocks.com Best Nasdaq Stocks ➞ Best S&P 500 Stocks ➞ Best Tech Stocks ➞ Best Biotech Stocks ➞ |
| Detailed Overview of Midcap Stocks |
| Midcap Technical Overview, Leaders & Laggards, Top Midcap ETF Funds & Detailed Midcap Stocks List, Charts, Trends & More |
| Midcap: Technical Analysis, Trends & YTD Performance | |
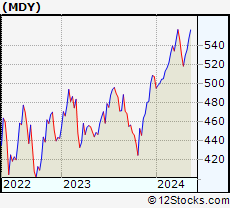
| MidCap segment as represented by
MDY, an exchange-traded fund [ETF], holds basket of about four hundred midcap stocks from across all major sectors of the US stock market. The midcap index (contains stocks like Green Mountain Coffee Roasters and Tractor Supply Company) is up by 2.81% and is currently underperforming the overall market by -2.21% year-to-date. Below is a quick view of technical charts and trends: | |
 MDY Weekly Chart |
|
| Long Term Trend: Good | |
| Medium Term Trend: Not Good | |
 MDY Daily Chart |
|
| Short Term Trend: Not Good | |
| Overall Trend Score: 26 | |
| YTD Performance: 2.81% | |
| **Trend Scores & Views Are Only For Educational Purposes And Not For Investing | |
| 12Stocks.com: Investing in Midcap Index using Exchange Traded Funds | |
|
The following table shows list of key exchange traded funds (ETF) that
help investors track Midcap index. The following list also includes leveraged ETF funds that track twice or thrice the daily returns of Midcap indices. Short or inverse ETF funds move in the opposite direction to the index they track and are useful during market pullbacks or during bear markets. Quick View: Move mouse or cursor over ETF symbol (ticker) to view short-term technical chart and over ETF name to view long term chart. Click on ticker or stock name for detailed view. Click on to add stock symbol to your watchlist and to view watchlist. |
12Stocks.com List of ETFs that track Midcap Index
| Ticker | ETF Name | Watchlist | Recent Price | Smart Investing & Trading Score | Change % | Week % | Year-to-date % |
| IJH | iShares Core S&P Mid-Cap | | 56.88 | 31 | -0.66 | -1.74 | 2.62% |
| IWR | iShares Russell Mid-Cap | | 79.09 | 26 | -0.63 | -1.89 | 1.76% |
| MDY | SPDR S&P MidCap 400 ETF | | 521.63 | 26 | -0.47 | -1.57 | 2.81% |
| IWP | iShares Russell Mid-Cap Growth | | 107.74 | 26 | -0.39 | -1.91 | 3.14% |
| IJK | iShares S&P Mid-Cap 400 Growth | | 85.99 | 31 | -0.54 | -1.7 | 8.55% |
| IWS | iShares Russell Mid-Cap Value | | 117.53 | 31 | -0.88 | -1.97 | 1.07% |
| MYY | ProShares Short MidCap400 | | 21.02 | 64 | 0.53 | 1.54 | -2.03% |
| IJJ | iShares S&P Mid-Cap 400 Value | | 109.66 | 13 | -0.83 | -2.08 | -3.84% |
| UMDD | ProShares UltraPro MidCap400 | | 23.03 | 26 | -1.75 | -4.72 | 3.18% |
| MZZ | ProShares UltraShort MidCap400 | | 12.01 | 34 | 0.84 | 3.53 | -4.46% |
| SMDD | ProShares UltraPro Short MidCap400 | | 12.30 | 64 | 1.71 | 4.68 | -8.64% |
| MVV | ProShares Ultra MidCap400 | | 59.95 | 26 | -2.82 | -2.88 | 3.56% |
| XMLV | PowerShares S&P MidCap Low Volatil ETF | | 53.53 | 36 | -0.42 | -1.32 | 0.67% |
| 12Stocks.com: Charts, Trends, Fundamental Data and Performances of MidCap Stocks | |
|
We now take in-depth look at all MidCap stocks including charts, multi-period performances and overall trends (as measured by Smart Investing & Trading Score). One can sort MidCap stocks (click link to choose) by Daily, Weekly and by Year-to-Date performances. Also, one can sort by size of the company or by market capitalization. |
| Select Your Default Chart Type: | |||||
| |||||
| Click on stock symbol or name for detailed view. Click on to add stock symbol to your watchlist and to view watchlist. Quick View: Move mouse or cursor over "Daily" to quickly view daily technical stock chart and over "Weekly" to view weekly technical stock chart. | |||||

 | CARR Carrier Global Corporation |
| Sector: Industrials | |
| SubSector: Building Products & Equipment | |
| MarketCap: 32547 Millions | |
| Recent Price: 54.76 Smart Investing & Trading Score: 13 | |
| Day Percent Change: -1.26% Day Change: -0.70 | |
| Week Change: -3.66% Year-to-date Change: -4.7% | |
| CARR Links: Profile News Message Board | |
| Charts:- Daily , Weekly | |
| Add CARR to Watchlist: View: Get Complete CARR Trend Analysis ➞ | |
 | CPNG Coupang, Inc. |
| Sector: Services & Goods | |
| SubSector: Internet Retail | |
| MarketCap: 30840 Millions | |
| Recent Price: 22.51 Smart Investing & Trading Score: 100 | |
| Day Percent Change: 3.97% Day Change: 0.86 | |
| Week Change: 5.93% Year-to-date Change: 39.0% | |
| CPNG Links: Profile News Message Board | |
| Charts:- Daily , Weekly | |
| Add CPNG to Watchlist: View: Get Complete CPNG Trend Analysis ➞ | |
 | BK The Bank of New York Mellon Corporation |
| Sector: Financials | |
| SubSector: Asset Management | |
| MarketCap: 29807.5 Millions | |
| Recent Price: 54.00 Smart Investing & Trading Score: 0 | |
| Day Percent Change: -1.98% Day Change: -1.09 | |
| Week Change: -1.91% Year-to-date Change: 3.8% | |
| BK Links: Profile News Message Board | |
| Charts:- Daily , Weekly | |
| Add BK to Watchlist: View: Get Complete BK Trend Analysis ➞ | |
 | CEG Constellation Energy Corporation |
| Sector: Utilities | |
| SubSector: Utilities - Renewable | |
| MarketCap: 29600 Millions | |
| Recent Price: 186.66 Smart Investing & Trading Score: 51 | |
| Day Percent Change: 0.68% Day Change: 1.26 | |
| Week Change: -2.61% Year-to-date Change: 59.4% | |
| CEG Links: Profile News Message Board | |
| Charts:- Daily , Weekly | |
| Add CEG to Watchlist: View: Get Complete CEG Trend Analysis ➞ | |
 | XEL Xcel Energy Inc. |
| Sector: Utilities | |
| SubSector: Electric Utilities | |
| MarketCap: 28960.8 Millions | |
| Recent Price: 52.53 Smart Investing & Trading Score: 20 | |
| Day Percent Change: -1.20% Day Change: -0.64 | |
| Week Change: -1.2% Year-to-date Change: -15.2% | |
| XEL Links: Profile News Message Board | |
| Charts:- Daily , Weekly | |
| Add XEL to Watchlist: View: Get Complete XEL Trend Analysis ➞ | |
 | RPRX Royalty Pharma plc |
| Sector: Health Care | |
| SubSector: Biotechnology | |
| MarketCap: 28457 Millions | |
| Recent Price: 27.78 Smart Investing & Trading Score: 10 | |
| Day Percent Change: -1.66% Day Change: -0.47 | |
| Week Change: -1.56% Year-to-date Change: -1.1% | |
| RPRX Links: Profile News Message Board | |
| Charts:- Daily , Weekly | |
| Add RPRX to Watchlist: View: Get Complete RPRX Trend Analysis ➞ | |
 | OTIS Otis Worldwide Corporation |
| Sector: Industrials | |
| SubSector: Specialty Industrial Machinery | |
| MarketCap: 27727 Millions | |
| Recent Price: 95.98 Smart Investing & Trading Score: 41 | |
| Day Percent Change: -0.07% Day Change: -0.07 | |
| Week Change: -0.19% Year-to-date Change: 7.3% | |
| OTIS Links: Profile News Message Board | |
| Charts:- Daily , Weekly | |
| Add OTIS to Watchlist: View: Get Complete OTIS Trend Analysis ➞ | |
 | EA Electronic Arts Inc. |
| Sector: Technology | |
| SubSector: Multimedia & Graphics Software | |
| MarketCap: 27296.5 Millions | |
| Recent Price: 126.58 Smart Investing & Trading Score: 0 | |
| Day Percent Change: -0.37% Day Change: -0.47 | |
| Week Change: -1.02% Year-to-date Change: -7.5% | |
| EA Links: Profile News Message Board | |
| Charts:- Daily , Weekly | |
| Add EA to Watchlist: View: Get Complete EA Trend Analysis ➞ | |
 | DLR Digital Realty Trust, Inc. |
| Sector: Financials | |
| SubSector: REIT - Office | |
| MarketCap: 27038.6 Millions | |
| Recent Price: 136.43 Smart Investing & Trading Score: 0 | |
| Day Percent Change: -1.54% Day Change: -2.13 | |
| Week Change: -4.25% Year-to-date Change: 1.4% | |
| DLR Links: Profile News Message Board | |
| Charts:- Daily , Weekly | |
| Add DLR to Watchlist: View: Get Complete DLR Trend Analysis ➞ | |
 | KR The Kroger Co. |
| Sector: Services & Goods | |
| SubSector: Grocery Stores | |
| MarketCap: 26718.5 Millions | |
| Recent Price: 55.28 Smart Investing & Trading Score: 53 | |
| Day Percent Change: -0.14% Day Change: -0.08 | |
| Week Change: 0.14% Year-to-date Change: 20.9% | |
| KR Links: Profile News Message Board | |
| Charts:- Daily , Weekly | |
| Add KR to Watchlist: View: Get Complete KR Trend Analysis ➞ | |
 | SBAC SBA Communications Corporation |
| Sector: Technology | |
| SubSector: Diversified Communication Services | |
| MarketCap: 26712.3 Millions | |
| Recent Price: 195.01 Smart Investing & Trading Score: 0 | |
| Day Percent Change: -2.43% Day Change: -4.85 | |
| Week Change: -3.38% Year-to-date Change: -23.1% | |
| SBAC Links: Profile News Message Board | |
| Charts:- Daily , Weekly | |
| Add SBAC to Watchlist: View: Get Complete SBAC Trend Analysis ➞ | |
 | CTSH Cognizant Technology Solutions Corporation |
| Sector: Technology | |
| SubSector: Information Technology Services | |
| MarketCap: 26249.7 Millions | |
| Recent Price: 67.95 Smart Investing & Trading Score: 0 | |
| Day Percent Change: -0.69% Day Change: -0.47 | |
| Week Change: -1.89% Year-to-date Change: -10.0% | |
| CTSH Links: Profile News Message Board | |
| Charts:- Daily , Weekly | |
| Add CTSH to Watchlist: View: Get Complete CTSH Trend Analysis ➞ | |
 | RSG Republic Services, Inc. |
| Sector: Industrials | |
| SubSector: Waste Management | |
| MarketCap: 26178.6 Millions | |
| Recent Price: 187.48 Smart Investing & Trading Score: 48 | |
| Day Percent Change: 0.13% Day Change: 0.24 | |
| Week Change: -0.18% Year-to-date Change: 13.7% | |
| RSG Links: Profile News Message Board | |
| Charts:- Daily , Weekly | |
| Add RSG to Watchlist: View: Get Complete RSG Trend Analysis ➞ | |
 | ALL The Allstate Corporation |
| Sector: Financials | |
| SubSector: Property & Casualty Insurance | |
| MarketCap: 25916.6 Millions | |
| Recent Price: 164.21 Smart Investing & Trading Score: 39 | |
| Day Percent Change: -0.94% Day Change: -1.55 | |
| Week Change: -1.56% Year-to-date Change: 17.3% | |
| ALL Links: Profile News Message Board | |
| Charts:- Daily , Weekly | |
| Add ALL to Watchlist: View: Get Complete ALL Trend Analysis ➞ | |
 | DD DuPont de Nemours, Inc. |
| Sector: Materials | |
| SubSector: Agricultural Chemicals | |
| MarketCap: 25631.6 Millions | |
| Recent Price: 72.57 Smart Investing & Trading Score: 36 | |
| Day Percent Change: -1.18% Day Change: -0.87 | |
| Week Change: -1.67% Year-to-date Change: -5.7% | |
| DD Links: Profile News Message Board | |
| Charts:- Daily , Weekly | |
| Add DD to Watchlist: View: Get Complete DD Trend Analysis ➞ | |
 | HRL Hormel Foods Corporation |
| Sector: Consumer Staples | |
| SubSector: Meat Products | |
| MarketCap: 25590.2 Millions | |
| Recent Price: 33.81 Smart Investing & Trading Score: 36 | |
| Day Percent Change: -0.29% Day Change: -0.10 | |
| Week Change: -0.35% Year-to-date Change: 5.3% | |
| HRL Links: Profile News Message Board | |
| Charts:- Daily , Weekly | |
| Add HRL to Watchlist: View: Get Complete HRL Trend Analysis ➞ | |
 | RBLX Roblox Corporation |
| Sector: Services & Goods | |
| SubSector: Electronic Gaming & Multimedia | |
| MarketCap: 25420 Millions | |
| Recent Price: 36.64 Smart Investing & Trading Score: 0 | |
| Day Percent Change: -0.05% Day Change: -0.02 | |
| Week Change: -4.51% Year-to-date Change: -20.6% | |
| RBLX Links: Profile News Message Board | |
| Charts:- Daily , Weekly | |
| Add RBLX to Watchlist: View: Get Complete RBLX Trend Analysis ➞ | |
 | PSX Phillips 66 |
| Sector: Energy | |
| SubSector: Oil & Gas Refining & Marketing | |
| MarketCap: 25253.6 Millions | |
| Recent Price: 157.88 Smart Investing & Trading Score: 36 | |
| Day Percent Change: -1.83% Day Change: -2.94 | |
| Week Change: -2.84% Year-to-date Change: 18.6% | |
| PSX Links: Profile News Message Board | |
| Charts:- Daily , Weekly | |
| Add PSX to Watchlist: View: Get Complete PSX Trend Analysis ➞ | |
 | ED Consolidated Edison, Inc. |
| Sector: Utilities | |
| SubSector: Electric Utilities | |
| MarketCap: 25012.3 Millions | |
| Recent Price: 87.42 Smart Investing & Trading Score: 18 | |
| Day Percent Change: -2.13% Day Change: -1.90 | |
| Week Change: -1.37% Year-to-date Change: -3.9% | |
| ED Links: Profile News Message Board | |
| Charts:- Daily , Weekly | |
| Add ED to Watchlist: View: Get Complete ED Trend Analysis ➞ | |
 | ROST Ross Stores, Inc. |
| Sector: Services & Goods | |
| SubSector: Apparel Stores | |
| MarketCap: 24938.8 Millions | |
| Recent Price: 133.85 Smart Investing & Trading Score: 10 | |
| Day Percent Change: 0.15% Day Change: 0.20 | |
| Week Change: -1.57% Year-to-date Change: -3.3% | |
| ROST Links: Profile News Message Board | |
| Charts:- Daily , Weekly | |
| Add ROST to Watchlist: View: Get Complete ROST Trend Analysis ➞ | |
 | WEC WEC Energy Group, Inc. |
| Sector: Utilities | |
| SubSector: Electric Utilities | |
| MarketCap: 24852 Millions | |
| Recent Price: 77.80 Smart Investing & Trading Score: 10 | |
| Day Percent Change: -1.38% Day Change: -1.09 | |
| Week Change: -1.48% Year-to-date Change: -7.6% | |
| WEC Links: Profile News Message Board | |
| Charts:- Daily , Weekly | |
| Add WEC to Watchlist: View: Get Complete WEC Trend Analysis ➞ | |
 | TROW T. Rowe Price Group, Inc. |
| Sector: Financials | |
| SubSector: Asset Management | |
| MarketCap: 24530 Millions | |
| Recent Price: 112.11 Smart Investing & Trading Score: 36 | |
| Day Percent Change: -1.87% Day Change: -2.14 | |
| Week Change: -2.67% Year-to-date Change: 4.1% | |
| TROW Links: Profile News Message Board | |
| Charts:- Daily , Weekly | |
| Add TROW to Watchlist: View: Get Complete TROW Trend Analysis ➞ | |
 | SPOT Spotify Technology S.A. |
| Sector: Services & Goods | |
| SubSector: Broadcasting - Radio | |
| MarketCap: 24379.5 Millions | |
| Recent Price: 299.96 Smart Investing & Trading Score: 51 | |
| Day Percent Change: 3.25% Day Change: 9.44 | |
| Week Change: -0.16% Year-to-date Change: 59.6% | |
| SPOT Links: Profile News Message Board | |
| Charts:- Daily , Weekly | |
| Add SPOT to Watchlist: View: Get Complete SPOT Trend Analysis ➞ | |
 | FOX Twenty-First Century Fox, Inc. |
| Sector: Services & Goods | |
| SubSector: Entertainment - Diversified | |
| MarketCap: 24211.2 Millions | |
| Recent Price: 27.95 Smart Investing & Trading Score: 35 | |
| Day Percent Change: 0.11% Day Change: 0.03 | |
| Week Change: -1.03% Year-to-date Change: 1.1% | |
| FOX Links: Profile News Message Board | |
| Charts:- Daily , Weekly | |
| Add FOX to Watchlist: View: Get Complete FOX Trend Analysis ➞ | |
 | ES Eversource Energy |
| Sector: Utilities | |
| SubSector: Diversified Utilities | |
| MarketCap: 23963.4 Millions | |
| Recent Price: 57.20 Smart Investing & Trading Score: 36 | |
| Day Percent Change: -1.79% Day Change: -1.04 | |
| Week Change: -2.7% Year-to-date Change: -7.3% | |
| ES Links: Profile News Message Board | |
| Charts:- Daily , Weekly | |
| Add ES to Watchlist: View: Get Complete ES Trend Analysis ➞ | |
| For tabular summary view of above stock list: Summary View ➞ 0 - 25 , 25 - 50 , 50 - 75 , 75 - 100 , 100 - 125 , 125 - 150 , 150 - 175 , 175 - 200 , 200 - 225 , 225 - 250 , 250 - 275 , 275 - 300 , 300 - 325 , 325 - 350 , 350 - 375 , 375 - 400 , 400 - 425 , 425 - 450 , 450 - 475 , 475 - 500 , 500 - 525 , 525 - 550 , 550 - 575 , 575 - 600 , 600 - 625 , 625 - 650 , 650 - 675 , 675 - 700 , 700 - 725 , 725 - 750 , 750 - 775 | ||
| Click To Change The Sort Order: By Market Cap or Company Size Performance: Year-to-date, Week and Day | |
| Select Chart Type: | ||
|
Best Stocks Today 12Stocks.com |
© 2024 12Stocks.com Terms & Conditions Privacy Contact Us
All Information Provided Only For Education And Not To Be Used For Investing or Trading. See Terms & Conditions


One More Thing ... Get Best Stocks Delivered Daily!
Never Ever Miss A Move With Our Top Ten Stocks Lists
Find Best Stocks In Any Market - Bull or Bear Market
Take A Peek At Our Top Ten Stocks Lists: Daily, Weekly, Year-to-Date & Top Trends
Find Best Stocks In Any Market - Bull or Bear Market
Take A Peek At Our Top Ten Stocks Lists: Daily, Weekly, Year-to-Date & Top Trends
Midcap Stocks With Best Up Trends [0-bearish to 100-bullish]: Coupang [100], HEICO [100], Etsy [86], Medical Properties[85], Flowers Foods[80], BioMarin Pharmaceutical[76], NRG Energy[71], SYNNEX [71], Murphy USA[71], Church & Dwight Co[70], Conagra [70]
Best Midcap Stocks Year-to-Date:
AppLovin [81.76%], Vistra Energy[75.49%], ShockWave Medical[71.86%], EMCOR [60.26%], Spotify [59.63%], Constellation Energy[59.39%], Pure Storage[49.5%], CAVA [44.57%], Wingstop [44.47%], NRG Energy[44.14%], Natera [44.14%] Best Midcap Stocks This Week:
Medical Properties[15.79%], Coupang [5.93%], V.F [3.8%], HEICO [3.43%], Envista [3.13%], Coty [3.04%], Lamb Weston[2.87%], New York[2.82%], Churchill Downs[2.77%], AMC Entertainment[2.64%], Alcoa [2.53%] Best Midcap Stocks Daily:
AMC Entertainment[10.12%], Globe Life[7.45%], Coupang [3.97%], Ardagh Metal[3.90%], Lumentum [3.59%], Rivian Automotive[3.57%], Tandem Diabetes[3.48%], V.F [3.46%], Envista [3.34%], Wingstop [3.30%], Spotify [3.25%]