
 Login Sign Up


| |||||
 |  | ||||

| 12Stocks.com Market Intelligence |
Best MidCap Stocks
|
| In a hurry? Mid Cap Stocks Lists: Performance Trends Table, Stock Charts
Sort midcap stocks: Daily, Weekly, Year-to-Date, Market Cap & Trends. Filter midcap stocks list by sector: Show all, Tech, Finance, Energy, Staples, Retail, Industrial, Materials, Utilities and HealthCare Filter midcap stocks list by size:All MidCap Large Mid-Range Small |
| 12Stocks.com Mid Cap Stocks Performances & Trends Daily | |||||||||
|
|  The overall Smart Investing & Trading Score is 36 (0-bearish to 100-bullish) which puts Mid Cap index in short term bearish to neutral trend. The Smart Investing & Trading Score from previous trading session is 26 and hence an improvement of trend.
| ||||||||
Here are the Smart Investing & Trading Scores of the most requested mid cap stocks at 12Stocks.com (click stock name for detailed review):
|


| 12Stocks.com: Top Performing Mid Cap Index Stocks | ||||||||||||||||||||||||||||||||||||||||||||||||
 The top performing Mid Cap Index stocks year to date are
Now, more recently, over last week, the top performing Mid Cap Index stocks on the move are


|
||||||||||||||||||||||||||||||||||||||||||||||||
| 12Stocks.com: Investing in Midcap Index with Stocks | |
|
The following table helps investors and traders sort through current performance and trends (as measured by Smart Investing & Trading Score) of various
stocks in the Midcap Index. Quick View: Move mouse or cursor over stock symbol (ticker) to view short-term technical chart and over stock name to view long term chart. Click on  to add stock symbol to your watchlist and to add stock symbol to your watchlist and  to view watchlist. Click on any ticker or stock name for detailed market intelligence report for that stock. to view watchlist. Click on any ticker or stock name for detailed market intelligence report for that stock. |
12Stocks.com Performance of Stocks in Midcap Index
| Ticker | Stock Name | Watchlist | Category | Recent Price | Smart Investing & Trading Score | Change % | YTD Change% |
| BXP | Boston Properties |   | Financials | 58.69 | 18 | 1.28% | -16.36% |
| EFX | Equifax | | Financials | 217.51 | 0 | -8.49% | -12.04% |
| ESS | Essex Property | | Financials | 233.88 | 41 | 0.53% | -5.67% |
| CINF | Cinnati Financial | | Financials | 117.50 | 61 | 1.91% | 13.57% |
| FOXA | Fox | | Services & Goods | 30.77 | 47 | 1.02% | 3.71% |
| DHI | D.R. Horton | | Industrials | 145.88 | 43 | 0.10% | -4.01% |
| AMP | Ameriprise Financial | | Financials | 412.63 | 51 | 0.21% | 8.64% |
| WY | Weyerhaeuser | | Industrials | 31.35 | 10 | -0.54% | -9.84% |
| QS | QuantumScape | | Services & Goods | 5.46 | 30 | -1.80% | -21.44% |
| TWLO | Twilio | | Technology | 58.42 | 33 | -0.54% | -23.00% |
| APTV | Aptiv | | Consumer Staples | 69.32 | 10 | -0.04% | -22.74% |
| PAYC | Paycom Software | | Technology | 184.87 | 10 | -1.06% | -10.57% |
| IP | Paper | | Consumer Staples | 35.26 | 10 | 0.57% | -2.46% |
| XP | XP | | Financials | 21.07 | 10 | -2.27% | -19.18% |
| TFX | Teleflex | | Health Care | 207.38 | 0 | -0.44% | -16.83% |
| LCID | Lucid | | Services & Goods | 2.46 | 42 | 1.23% | -41.08% |
| HPE | Hewlett Packard | | Technology | 17.04 | 46 | 0.06% | 0.35% |
| ROL | Rollins | | Services & Goods | 42.44 | 0 | -1.33% | -2.82% |
| ALGN | Align | | Health Care | 301.35 | 54 | 0.40% | 9.98% |
| CBRE | CBRE | | Financials | 85.14 | 10 | 0.00% | -8.54% |
| GWW | W.W. Grainger | | Services & Goods | 937.54 | 36 | -1.30% | 13.14% |
| ALNY | Alnylam | | Health Care | 145.04 | 10 | -0.19% | -24.22% |
| CDW | CDW | | Technology | 235.69 | 36 | -0.46% | 3.68% |
| APO | Apollo Global | | Financials | 107.30 | 51 | -0.18% | 15.14% |
| SJM | J. M. | | Consumer Staples | 111.10 | 25 | 1.18% | -12.09% |
| For chart view version of above stock list: Chart View ➞ 0 - 25 , 25 - 50 , 50 - 75 , 75 - 100 , 100 - 125 , 125 - 150 , 150 - 175 , 175 - 200 , 200 - 225 , 225 - 250 , 250 - 275 , 275 - 300 , 300 - 325 , 325 - 350 , 350 - 375 , 375 - 400 , 400 - 425 , 425 - 450 , 450 - 475 , 475 - 500 , 500 - 525 , 525 - 550 , 550 - 575 , 575 - 600 , 600 - 625 , 625 - 650 , 650 - 675 , 675 - 700 , 700 - 725 , 725 - 750 , 750 - 775 | ||
 | Click To Change The Sort Order: By Market Cap or Company Size Performance: Year-to-date, Week and Day |  |
|
Get the most comprehensive stock market coverage daily at 12Stocks.com ➞ Best Stocks Today ➞ Best Stocks Weekly ➞ Best Stocks Year-to-Date ➞ Best Stocks Trends ➞  Best Stocks Today 12Stocks.com Best Nasdaq Stocks ➞ Best S&P 500 Stocks ➞ Best Tech Stocks ➞ Best Biotech Stocks ➞ |
| Detailed Overview of Midcap Stocks |
| Midcap Technical Overview, Leaders & Laggards, Top Midcap ETF Funds & Detailed Midcap Stocks List, Charts, Trends & More |
| Midcap: Technical Analysis, Trends & YTD Performance | |
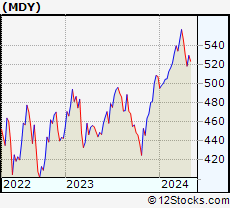
| MidCap segment as represented by
MDY, an exchange-traded fund [ETF], holds basket of about four hundred midcap stocks from across all major sectors of the US stock market. The midcap index (contains stocks like Green Mountain Coffee Roasters and Tractor Supply Company) is up by 1.83% and is currently underperforming the overall market by -2.36% year-to-date. Below is a quick view of technical charts and trends: | |
 MDY Weekly Chart |
|
| Long Term Trend: Good | |
| Medium Term Trend: Not Good | |
 MDY Daily Chart |
|
| Short Term Trend: Not Good | |
| Overall Trend Score: 36 | |
| YTD Performance: 1.83% | |
| **Trend Scores & Views Are Only For Educational Purposes And Not For Investing | |
| 12Stocks.com: Investing in Midcap Index using Exchange Traded Funds | |
|
The following table shows list of key exchange traded funds (ETF) that
help investors track Midcap index. The following list also includes leveraged ETF funds that track twice or thrice the daily returns of Midcap indices. Short or inverse ETF funds move in the opposite direction to the index they track and are useful during market pullbacks or during bear markets. Quick View: Move mouse or cursor over ETF symbol (ticker) to view short-term technical chart and over ETF name to view long term chart. Click on ticker or stock name for detailed view. Click on to add stock symbol to your watchlist and to view watchlist. |
12Stocks.com List of ETFs that track Midcap Index
| Ticker | ETF Name | Watchlist | Recent Price | Smart Investing & Trading Score | Change % | Week % | Year-to-date % |
| IJH | iShares Core S&P Mid-Cap | | 56.43 | 41 | -0.14 | -2.52 | 1.8% |
| IWR | iShares Russell Mid-Cap | | 78.68 | 36 | -0.18 | -2.41 | 1.22% |
| MDY | SPDR S&P MidCap 400 ETF | | 516.64 | 36 | -0.12 | -2.51 | 1.83% |
| IWP | iShares Russell Mid-Cap Growth | | 106.51 | 36 | -0.48 | -3.03 | 1.96% |
| IWS | iShares Russell Mid-Cap Value | | 117.34 | 41 | -0.06 | -2.13 | 0.9% |
| IJK | iShares S&P Mid-Cap 400 Growth | | 84.97 | 41 | -0.43 | -2.87 | 7.26% |
| IJJ | iShares S&P Mid-Cap 400 Value | | 109.51 | 23 | 0.06 | -2.21 | -3.97% |
| XMLV | PowerShares S&P MidCap Low Volatil ETF | | 53.64 | 54 | 0.50 | -1.13 | 0.86% |
| UMDD | ProShares UltraPro MidCap400 | | 22.75 | 36 | 1.34 | -5.88 | 1.93% |
| MVV | ProShares Ultra MidCap400 | | 58.42 | 36 | -0.70 | -5.36 | 0.92% |
| SMDD | ProShares UltraPro Short MidCap400 | | 12.75 | 64 | 1.67 | 8.51 | -5.3% |
| MYY | ProShares Short MidCap400 | | 21.26 | 69 | 0.24 | 2.7 | -0.91% |
| MZZ | ProShares UltraShort MidCap400 | | 12.23 | 34 | 1.37 | 5.43 | -2.71% |
| 12Stocks.com: Charts, Trends, Fundamental Data and Performances of MidCap Stocks | |
|
We now take in-depth look at all MidCap stocks including charts, multi-period performances and overall trends (as measured by Smart Investing & Trading Score). One can sort MidCap stocks (click link to choose) by Daily, Weekly and by Year-to-Date performances. Also, one can sort by size of the company or by market capitalization. |
| Select Your Default Chart Type: | |||||
| |||||
| Click on stock symbol or name for detailed view. Click on to add stock symbol to your watchlist and to view watchlist. Quick View: Move mouse or cursor over "Daily" to quickly view daily technical stock chart and over "Weekly" to view weekly technical stock chart. | |||||

 | BXP Boston Properties, Inc. |
| Sector: Financials | |
| SubSector: REIT - Office | |
| MarketCap: 13788.6 Millions | |
| Recent Price: 58.69 Smart Investing & Trading Score: 18 | |
| Day Percent Change: 1.28% Day Change: 0.74 | |
| Week Change: -3.17% Year-to-date Change: -16.4% | |
| BXP Links: Profile News Message Board | |
| Charts:- Daily , Weekly | |
| Add BXP to Watchlist: View: Get Complete BXP Trend Analysis ➞ | |
 | EFX Equifax Inc. |
| Sector: Financials | |
| SubSector: Credit Services | |
| MarketCap: 13754.6 Millions | |
| Recent Price: 217.51 Smart Investing & Trading Score: 0 | |
| Day Percent Change: -8.49% Day Change: -20.17 | |
| Week Change: -11.94% Year-to-date Change: -12.0% | |
| EFX Links: Profile News Message Board | |
| Charts:- Daily , Weekly | |
| Add EFX to Watchlist: View: Get Complete EFX Trend Analysis ➞ | |
 | ESS Essex Property Trust, Inc. |
| Sector: Financials | |
| SubSector: REIT - Residential | |
| MarketCap: 13725.5 Millions | |
| Recent Price: 233.88 Smart Investing & Trading Score: 41 | |
| Day Percent Change: 0.53% Day Change: 1.23 | |
| Week Change: -2.26% Year-to-date Change: -5.7% | |
| ESS Links: Profile News Message Board | |
| Charts:- Daily , Weekly | |
| Add ESS to Watchlist: View: Get Complete ESS Trend Analysis ➞ | |
 | CINF Cincinnati Financial Corporation |
| Sector: Financials | |
| SubSector: Property & Casualty Insurance | |
| MarketCap: 13637 Millions | |
| Recent Price: 117.50 Smart Investing & Trading Score: 61 | |
| Day Percent Change: 1.91% Day Change: 2.20 | |
| Week Change: -0.94% Year-to-date Change: 13.6% | |
| CINF Links: Profile News Message Board | |
| Charts:- Daily , Weekly | |
| Add CINF to Watchlist: View: Get Complete CINF Trend Analysis ➞ | |
 | FOXA Fox Corporation |
| Sector: Services & Goods | |
| SubSector: Entertainment - Diversified | |
| MarketCap: 13440.7 Millions | |
| Recent Price: 30.77 Smart Investing & Trading Score: 47 | |
| Day Percent Change: 1.02% Day Change: 0.31 | |
| Week Change: 0.1% Year-to-date Change: 3.7% | |
| FOXA Links: Profile News Message Board | |
| Charts:- Daily , Weekly | |
| Add FOXA to Watchlist: View: Get Complete FOXA Trend Analysis ➞ | |
 | DHI D.R. Horton, Inc. |
| Sector: Industrials | |
| SubSector: Residential Construction | |
| MarketCap: 13372.6 Millions | |
| Recent Price: 145.88 Smart Investing & Trading Score: 43 | |
| Day Percent Change: 0.10% Day Change: 0.14 | |
| Week Change: -3.84% Year-to-date Change: -4.0% | |
| DHI Links: Profile News Message Board | |
| Charts:- Daily , Weekly | |
| Add DHI to Watchlist: View: Get Complete DHI Trend Analysis ➞ | |
 | AMP Ameriprise Financial, Inc. |
| Sector: Financials | |
| SubSector: Asset Management | |
| MarketCap: 13270.5 Millions | |
| Recent Price: 412.63 Smart Investing & Trading Score: 51 | |
| Day Percent Change: 0.21% Day Change: 0.86 | |
| Week Change: -0.26% Year-to-date Change: 8.6% | |
| AMP Links: Profile News Message Board | |
| Charts:- Daily , Weekly | |
| Add AMP to Watchlist: View: Get Complete AMP Trend Analysis ➞ | |
 | WY Weyerhaeuser Company |
| Sector: Industrials | |
| SubSector: Lumber, Wood Production | |
| MarketCap: 13244.8 Millions | |
| Recent Price: 31.35 Smart Investing & Trading Score: 10 | |
| Day Percent Change: -0.54% Day Change: -0.17 | |
| Week Change: -5.69% Year-to-date Change: -9.8% | |
| WY Links: Profile News Message Board | |
| Charts:- Daily , Weekly | |
| Add WY to Watchlist: View: Get Complete WY Trend Analysis ➞ | |
 | QS QuantumScape Corporation |
| Sector: Services & Goods | |
| SubSector: Auto Parts | |
| MarketCap: 13137 Millions | |
| Recent Price: 5.46 Smart Investing & Trading Score: 30 | |
| Day Percent Change: -1.80% Day Change: -0.10 | |
| Week Change: -6.02% Year-to-date Change: -21.4% | |
| QS Links: Profile News Message Board | |
| Charts:- Daily , Weekly | |
| Add QS to Watchlist: View: Get Complete QS Trend Analysis ➞ | |
 | TWLO Twilio Inc. |
| Sector: Technology | |
| SubSector: Application Software | |
| MarketCap: 13055.8 Millions | |
| Recent Price: 58.42 Smart Investing & Trading Score: 33 | |
| Day Percent Change: -0.54% Day Change: -0.32 | |
| Week Change: -3.99% Year-to-date Change: -23.0% | |
| TWLO Links: Profile News Message Board | |
| Charts:- Daily , Weekly | |
| Add TWLO to Watchlist: View: Get Complete TWLO Trend Analysis ➞ | |
 | APTV Aptiv PLC |
| Sector: Consumer Staples | |
| SubSector: Auto Parts | |
| MarketCap: 13047.9 Millions | |
| Recent Price: 69.32 Smart Investing & Trading Score: 10 | |
| Day Percent Change: -0.04% Day Change: -0.03 | |
| Week Change: -6.56% Year-to-date Change: -22.7% | |
| APTV Links: Profile News Message Board | |
| Charts:- Daily , Weekly | |
| Add APTV to Watchlist: View: Get Complete APTV Trend Analysis ➞ | |
 | PAYC Paycom Software, Inc. |
| Sector: Technology | |
| SubSector: Application Software | |
| MarketCap: 13041.6 Millions | |
| Recent Price: 184.87 Smart Investing & Trading Score: 10 | |
| Day Percent Change: -1.06% Day Change: -1.99 | |
| Week Change: -6.63% Year-to-date Change: -10.6% | |
| PAYC Links: Profile News Message Board | |
| Charts:- Daily , Weekly | |
| Add PAYC to Watchlist: View: Get Complete PAYC Trend Analysis ➞ | |
 | IP International Paper Company |
| Sector: Consumer Staples | |
| SubSector: Packaging & Containers | |
| MarketCap: 13031.3 Millions | |
| Recent Price: 35.26 Smart Investing & Trading Score: 10 | |
| Day Percent Change: 0.57% Day Change: 0.20 | |
| Week Change: -5.06% Year-to-date Change: -2.5% | |
| IP Links: Profile News Message Board | |
| Charts:- Daily , Weekly | |
| Add IP to Watchlist: View: Get Complete IP Trend Analysis ➞ | |
 | XP XP Inc. |
| Sector: Financials | |
| SubSector: Asset Management | |
| MarketCap: 12990.3 Millions | |
| Recent Price: 21.07 Smart Investing & Trading Score: 10 | |
| Day Percent Change: -2.27% Day Change: -0.49 | |
| Week Change: -9.8% Year-to-date Change: -19.2% | |
| XP Links: Profile News Message Board | |
| Charts:- Daily , Weekly | |
| Add XP to Watchlist: View: Get Complete XP Trend Analysis ➞ | |
 | TFX Teleflex Incorporated |
| Sector: Health Care | |
| SubSector: Medical Instruments & Supplies | |
| MarketCap: 12989.3 Millions | |
| Recent Price: 207.38 Smart Investing & Trading Score: 0 | |
| Day Percent Change: -0.44% Day Change: -0.92 | |
| Week Change: -3.29% Year-to-date Change: -16.8% | |
| TFX Links: Profile News Message Board | |
| Charts:- Daily , Weekly | |
| Add TFX to Watchlist: View: Get Complete TFX Trend Analysis ➞ | |
 | LCID Lucid Group, Inc. |
| Sector: Services & Goods | |
| SubSector: Auto Manufacturers | |
| MarketCap: 12910 Millions | |
| Recent Price: 2.46 Smart Investing & Trading Score: 42 | |
| Day Percent Change: 1.23% Day Change: 0.03 | |
| Week Change: -1.2% Year-to-date Change: -41.1% | |
| LCID Links: Profile News Message Board | |
| Charts:- Daily , Weekly | |
| Add LCID to Watchlist: View: Get Complete LCID Trend Analysis ➞ | |
 | HPE Hewlett Packard Enterprise Company |
| Sector: Technology | |
| SubSector: Communication Equipment | |
| MarketCap: 12886.1 Millions | |
| Recent Price: 17.04 Smart Investing & Trading Score: 46 | |
| Day Percent Change: 0.06% Day Change: 0.01 | |
| Week Change: -2.18% Year-to-date Change: 0.4% | |
| HPE Links: Profile News Message Board | |
| Charts:- Daily , Weekly | |
| Add HPE to Watchlist: View: Get Complete HPE Trend Analysis ➞ | |
 | ROL Rollins, Inc. |
| Sector: Services & Goods | |
| SubSector: Business Services | |
| MarketCap: 12827.4 Millions | |
| Recent Price: 42.44 Smart Investing & Trading Score: 0 | |
| Day Percent Change: -1.33% Day Change: -0.57 | |
| Week Change: -4.31% Year-to-date Change: -2.8% | |
| ROL Links: Profile News Message Board | |
| Charts:- Daily , Weekly | |
| Add ROL to Watchlist: View: Get Complete ROL Trend Analysis ➞ | |
 | ALGN Align Technology, Inc. |
| Sector: Health Care | |
| SubSector: Medical Appliances & Equipment | |
| MarketCap: 12802 Millions | |
| Recent Price: 301.35 Smart Investing & Trading Score: 54 | |
| Day Percent Change: 0.40% Day Change: 1.21 | |
| Week Change: -4.32% Year-to-date Change: 10.0% | |
| ALGN Links: Profile News Message Board | |
| Charts:- Daily , Weekly | |
| Add ALGN to Watchlist: View: Get Complete ALGN Trend Analysis ➞ | |
 | CBRE CBRE Group, Inc. |
| Sector: Financials | |
| SubSector: Property Management | |
| MarketCap: 12799.2 Millions | |
| Recent Price: 85.14 Smart Investing & Trading Score: 10 | |
| Day Percent Change: 0.00% Day Change: 0.00 | |
| Week Change: -4.75% Year-to-date Change: -8.5% | |
| CBRE Links: Profile News Message Board | |
| Charts:- Daily , Weekly | |
| Add CBRE to Watchlist: View: Get Complete CBRE Trend Analysis ➞ | |
 | GWW W.W. Grainger, Inc. |
| Sector: Services & Goods | |
| SubSector: Industrial Equipment Wholesale | |
| MarketCap: 12794.8 Millions | |
| Recent Price: 937.54 Smart Investing & Trading Score: 36 | |
| Day Percent Change: -1.30% Day Change: -12.38 | |
| Week Change: -2.84% Year-to-date Change: 13.1% | |
| GWW Links: Profile News Message Board | |
| Charts:- Daily , Weekly | |
| Add GWW to Watchlist: View: Get Complete GWW Trend Analysis ➞ | |
 | ALNY Alnylam Pharmaceuticals, Inc. |
| Sector: Health Care | |
| SubSector: Biotechnology | |
| MarketCap: 12793.2 Millions | |
| Recent Price: 145.04 Smart Investing & Trading Score: 10 | |
| Day Percent Change: -0.19% Day Change: -0.28 | |
| Week Change: -2.33% Year-to-date Change: -24.2% | |
| ALNY Links: Profile News Message Board | |
| Charts:- Daily , Weekly | |
| Add ALNY to Watchlist: View: Get Complete ALNY Trend Analysis ➞ | |
 | CDW CDW Corporation |
| Sector: Technology | |
| SubSector: Information Technology Services | |
| MarketCap: 12775 Millions | |
| Recent Price: 235.69 Smart Investing & Trading Score: 36 | |
| Day Percent Change: -0.46% Day Change: -1.09 | |
| Week Change: -2.97% Year-to-date Change: 3.7% | |
| CDW Links: Profile News Message Board | |
| Charts:- Daily , Weekly | |
| Add CDW to Watchlist: View: Get Complete CDW Trend Analysis ➞ | |
 | APO Apollo Global Management, Inc. |
| Sector: Financials | |
| SubSector: Diversified Investments | |
| MarketCap: 12706 Millions | |
| Recent Price: 107.30 Smart Investing & Trading Score: 51 | |
| Day Percent Change: -0.18% Day Change: -0.19 | |
| Week Change: -2.57% Year-to-date Change: 15.1% | |
| APO Links: Profile News Message Board | |
| Charts:- Daily , Weekly | |
| Add APO to Watchlist: View: Get Complete APO Trend Analysis ➞ | |
 | SJM The J. M. Smucker Company |
| Sector: Consumer Staples | |
| SubSector: Processed & Packaged Goods | |
| MarketCap: 12635.8 Millions | |
| Recent Price: 111.10 Smart Investing & Trading Score: 25 | |
| Day Percent Change: 1.18% Day Change: 1.30 | |
| Week Change: 1.36% Year-to-date Change: -12.1% | |
| SJM Links: Profile News Message Board | |
| Charts:- Daily , Weekly | |
| Add SJM to Watchlist: View: Get Complete SJM Trend Analysis ➞ | |
| For tabular summary view of above stock list: Summary View ➞ 0 - 25 , 25 - 50 , 50 - 75 , 75 - 100 , 100 - 125 , 125 - 150 , 150 - 175 , 175 - 200 , 200 - 225 , 225 - 250 , 250 - 275 , 275 - 300 , 300 - 325 , 325 - 350 , 350 - 375 , 375 - 400 , 400 - 425 , 425 - 450 , 450 - 475 , 475 - 500 , 500 - 525 , 525 - 550 , 550 - 575 , 575 - 600 , 600 - 625 , 625 - 650 , 650 - 675 , 675 - 700 , 700 - 725 , 725 - 750 , 750 - 775 | ||
| Click To Change The Sort Order: By Market Cap or Company Size Performance: Year-to-date, Week and Day | |
| Select Chart Type: | ||
|
Best Stocks Today 12Stocks.com |
© 2024 12Stocks.com Terms & Conditions Privacy Contact Us
All Information Provided Only For Education And Not To Be Used For Investing or Trading. See Terms & Conditions


One More Thing ... Get Best Stocks Delivered Daily!
Never Ever Miss A Move With Our Top Ten Stocks Lists
Find Best Stocks In Any Market - Bull or Bear Market
Take A Peek At Our Top Ten Stocks Lists: Daily, Weekly, Year-to-Date & Top Trends
Find Best Stocks In Any Market - Bull or Bear Market
Take A Peek At Our Top Ten Stocks Lists: Daily, Weekly, Year-to-Date & Top Trends
Midcap Stocks With Best Up Trends [0-bearish to 100-bullish]: Genuine Parts[100], United Airlines[100], Medical Properties[100], Alaska Air[100], HEICO [100], Generac [93], Bunge [93], Flowers Foods[93], Pilgrim s[90], Coupang [90], DT Midstream[88]
Best Midcap Stocks Year-to-Date:
AppLovin [77.99%], ShockWave Medical[71.82%], Vistra Energy[71.03%], Constellation Energy[59.78%], EMCOR [55.99%], Spotify [53.9%], Pure Storage[45.37%], CAVA [44.09%], Natera [39.19%], Wingstop [38.93%], Williams-Sonoma [38.53%] Best Midcap Stocks This Week:
Medical Properties[25.06%], United Airlines[22.99%], AMC Entertainment[10.38%], Genuine Parts[10.21%], Globe Life[10%], Advance Auto[9.5%], Bentley [8.14%], Alaska Air[7.63%], American Airlines[6.69%], Flowers Foods[6.32%], agilon health[5.96%] Best Midcap Stocks Daily:
Genuine Parts[11.22%], Ally Financial[6.73%], Coinbase Global[5.90%], Manpower [5.65%], United Airlines[5.48%], Iridium [5.46%], Ginkgo Bioworks[5.13%], Bank OZK[4.73%], agilon health[4.69%], Medical Properties[4.61%], Kohl s[4.53%]