
 Login Sign Up


| |||||
 |  | ||||

| 12Stocks.com Market Intelligence |
Best Latin America Stocks
|
|
| Quick Read: Top Latin America Stocks By Performances & Trends: Daily, Weekly, Year-to-Date, Market Cap (Size) & Technical Trends | |||
| Best Latin America Views: Quick Browse View, Summary & Slide Show | |||
| 12Stocks.com Latin America Stocks Performances & Trends Daily | |||||||||
|
|  The overall market intelligence score is 0 (0-bearish to 100-bullish) which puts Latin America index in short term bearish trend. The market intelligence score from previous trading session is 7 and hence a deterioration of trend.
| ||||||||
| Here are the market intelligence trend scores of the most requested Latin America stocks at 12Stocks.com (click stock name for detailed review): | |
| Scroll down this page for most comprehensive review of Latin America stocks by performance, trends, technical analysis, charts, fund plays & more | |


| 12Stocks.com: Top Performing Latin America Index Stocks | ||||||||||||||||||||||||||||||||||||||||||||||||
 The top performing Latin America Index stocks year to date are
Now, more recently, over last week, the top performing Latin America Index stocks on the move are


|
||||||||||||||||||||||||||||||||||||||||||||||||
| 12Stocks.com: Investing in Latin America Index with Stocks | |
|
The following table helps investors and traders sort through current performance and trends (as measured by market intelligence score) of various
stocks in the Latin America Index. Quick View: Move mouse or cursor over stock symbol (ticker) to view short-term technical chart and over stock name to view long term chart. Click on  to add stock symbol to your watchlist and to add stock symbol to your watchlist and  to view watchlist. Click on any ticker or stock name for detailed market intelligence report for that stock. to view watchlist. Click on any ticker or stock name for detailed market intelligence report for that stock. |
12Stocks.com Performance of Stocks in Latin America Index
| Ticker | Stock Name | Watchlist | Category | Recent Price | Market Intelligence Score | Change % | YTD Change% |
| CIG | Companhia Energetica |   | Utilities | 2.44 | 43 | 0.83% | 5.17% |
| CX | CEMEX S.A.B. | | Industrials | 8.08 | 0 | -1.22% | 4.26% |
| STN | Stantec | | Services & Goods | 79.22 | 18 | -0.43% | -1.21% |
| PAAS | Pan American | | Materials | 19.06 | 83 | 0.85% | 16.72% |
| DSGX | Descartes Systems | | Technology | 90.13 | 63 | -0.45% | 7.22% |
| FSV | FirstService | | Financials | 149.40 | 10 | -0.47% | -7.83% |
| BTG | B2Gold | | Materials | 2.61 | 10 | -1.51% | -17.41% |
| ASR | Grupo Aeroportuario | | Transports | 307.14 | 46 | 1.12% | 4.37% |
| CCJ | Cameco | | Materials | 48.17 | 69 | -0.50% | 11.76% |
| BAK | Braskem S.A | | Materials | 8.64 | 15 | 0.82% | -2.04% |
| BRFS | BRF S.A | | Consumer Staples | 3.27 | 38 | 0.31% | 17.63% |
| NG | NovaGold Resources | | Materials | 3.07 | 61 | -1.92% | -17.91% |
| CEF | Sprott Physical | | Financials | 22.23 | 83 | 0.05% | 16.08% |
| GIL | Gildan Activewear | | Consumer Staples | 35.12 | 39 | -0.26% | 6.23% |
| CVE | Cenovus Energy | | Energy | 20.66 | 59 | -0.19% | 24.08% |
| PHYS | Sprott Physical | | Financials | 18.44 | 68 | 0.22% | 15.76% |
| YPF | YPF Sociedad | | Energy | 19.07 | 26 | -2.05% | 10.94% |
| VTMX | Vesta Financials | | Financials | 35.23 | 32 | 0.44% | -11.39% |
| KOF | Coca-Cola FEMSA | | Consumer Staples | 93.24 | 10 | 1.36% | -1.48% |
| BLDP | Ballard Power | | Industrials | 2.69 | 10 | -1.10% | -27.30% |
| BB | BlackBerry | | Technology | 2.79 | 40 | 1.09% | -21.19% |
| SID | Companhia Siderurgica | | Materials | 2.72 | 10 | -1.09% | -30.79% |
| CRON | Cronos | | Health Care | 2.41 | 31 | -0.41% | 15.31% |
| CIGI | Colliers | | Financials | 106.94 | 10 | -1.84% | -15.48% |
| ABCL | AbCellera Biologics | | Health Care | 3.96 | 12 | 1.02% | -29.91% |
| To view more stocks, click on Next / Previous arrows or select different range: 0 - 25 , 25 - 50 , 50 - 75 , 75 - 100 , 100 - 125 , 125 - 150 , 150 - 175 , 175 - 200 , 200 - 225 | ||
 | Click To Change The Sort Order: By Market Cap or Company Size Performance: Year-to-date, Week and Day |  |
| Detailed Overview Of Latin America Stocks |
| Latin America Technical Overview, Leaders & Laggards, Top Latin America ETF Funds & Detailed Latin America Stocks List, Charts, Trends & More |
| Latin America: Technical Analysis, Trends & YTD Performance | |
 ILF Weekly Chart |
|
| Long Term Trend: Not Good | |
| Medium Term Trend: Not Good | |
 ILF Daily Chart |
|
| Short Term Trend: Not Good | |
| Overall Trend Score: 0 | |
| YTD Performance: -7.95% | |
| **Trend Scores & Views Are Only For Educational Purposes And Not For Investing | |
| 12Stocks.com: Investing in Latin America Index using Exchange Traded Funds | |
|
The following table shows list of key exchange traded funds (ETF) that
help investors play Latin America stock market. For detailed view, check out our ETF Funds section of our website. Quick View: Move mouse or cursor over ETF symbol (ticker) to view short-term technical chart and over ETF name to view long term chart. Click on ticker or stock name for detailed view. Click on to add stock symbol to your watchlist and to view watchlist. |
12Stocks.com List of ETFs that track Latin America Index
| Ticker | ETF Name | Watchlist | Recent Price | Market Intelligence Score | Change % | Week % | Year-to-date % |
| ILF | Latin America 40 | | 26.75 | 0 | -0.22 | -3.25 | -7.95% |
| EWC | Canada | | 36.85 | 56 | 0.22 | -0.81 | 0.46% |
| FLN | Latin America AlphaDEX | | 19.09 | 0 | -0.50 | -6.42 | -8.18% |
| EWZ | Brazil | | 30.11 | 17 | -0.20 | -3.71 | -13.87% |
| EWW | Mexico | | 64.92 | 0 | 0.00 | -3.71 | -4.32% |
| ARGT | Argentina | | 52.91 | 26 | -0.23 | -4.89 | 3.06% |
| EWZS | Brazil Small-Cap | | 12.80 | 10 | -0.62 | -5.5 | -15.01% |
| BRF | Brazil Small-Cap | | 14.63 | 10 | -0.73 | -6.01 | -16.82% |
| BZQ | Short Brazil | | 13.26 | 100 | 0.38 | 7.72 | 32.2% |
| BRZU | Brazil Bull 3X | | 73.72 | 7 | -0.54 | -7.58 | -28.34% |
| FBZ | Brazil AlphaDEX | | 11.03 | 0 | -1.11 | -6.95 | -9.78% |
| 12Stocks.com: Charts, Trends, Fundamental Data and Performances of Latin America Stocks | |
|
We now take in-depth look at all Latin America stocks including charts, multi-period performances and overall trends (as measured by market intelligence score). One can sort Latin America stocks (click link to choose) by Daily, Weekly and by Year-to-Date performances. Also, one can sort by size of the company or by market capitalization. |
| Select Your Default Chart Type: | |||||
| |||||
| Click on stock symbol or name for detailed view. Click on to add stock symbol to your watchlist and to view watchlist. Quick View: Move mouse or cursor over "Daily" to quickly view daily technical stock chart and over "Weekly" to view weekly technical stock chart. | |||||

 | CIG Companhia Energetica de Minas Gerais |
| Sector: Utilities | |
| SubSector: Electric Utilities | |
| MarketCap: 3203.54 Millions | |
| Recent Price: 2.44 Market Intelligence Score: 43 | |
| Day Percent Change: 0.83% Day Change: 0.02 | |
| Week Change: -1.21% Year-to-date Change: 5.2% | |
| CIG Links: Profile News Message Board | |
| Charts:- Daily , Weekly | |
| Add CIG to Watchlist: View: Get Complete CIG Trend Analysis ➞ | |
 | CX CEMEX, S.A.B. de C.V. |
| Sector: Industrials | |
| SubSector: Cement | |
| MarketCap: 2948.23 Millions | |
| Recent Price: 8.08 Market Intelligence Score: 0 | |
| Day Percent Change: -1.22% Day Change: -0.10 | |
| Week Change: -5.61% Year-to-date Change: 4.3% | |
| CX Links: Profile News Message Board | |
| Charts:- Daily , Weekly | |
| Add CX to Watchlist: View: Get Complete CX Trend Analysis ➞ | |
 | STN Stantec Inc. |
| Sector: Services & Goods | |
| SubSector: Business Services | |
| MarketCap: 2855.92 Millions | |
| Recent Price: 79.22 Market Intelligence Score: 18 | |
| Day Percent Change: -0.43% Day Change: -0.34 | |
| Week Change: -1.25% Year-to-date Change: -1.2% | |
| STN Links: Profile News Message Board | |
| Charts:- Daily , Weekly | |
| Add STN to Watchlist: View: Get Complete STN Trend Analysis ➞ | |
 | PAAS Pan American Silver Corp. |
| Sector: Materials | |
| SubSector: Silver | |
| MarketCap: 2832.56 Millions | |
| Recent Price: 19.06 Market Intelligence Score: 83 | |
| Day Percent Change: 0.85% Day Change: 0.16 | |
| Week Change: -2.76% Year-to-date Change: 16.7% | |
| PAAS Links: Profile News Message Board | |
| Charts:- Daily , Weekly | |
| Add PAAS to Watchlist: View: Get Complete PAAS Trend Analysis ➞ | |
 | DSGX The Descartes Systems Group Inc |
| Sector: Technology | |
| SubSector: Business Software & Services | |
| MarketCap: 2830.58 Millions | |
| Recent Price: 90.13 Market Intelligence Score: 63 | |
| Day Percent Change: -0.45% Day Change: -0.41 | |
| Week Change: 0.09% Year-to-date Change: 7.2% | |
| DSGX Links: Profile News Message Board | |
| Charts:- Daily , Weekly | |
| Add DSGX to Watchlist: View: Get Complete DSGX Trend Analysis ➞ | |
 | FSV FirstService Corporation |
| Sector: Financials | |
| SubSector: Property Management | |
| MarketCap: 2793.92 Millions | |
| Recent Price: 149.40 Market Intelligence Score: 10 | |
| Day Percent Change: -0.47% Day Change: -0.70 | |
| Week Change: -3.49% Year-to-date Change: -7.8% | |
| FSV Links: Profile News Message Board | |
| Charts:- Daily , Weekly | |
| Add FSV to Watchlist: View: Get Complete FSV Trend Analysis ➞ | |
 | BTG B2Gold Corp. |
| Sector: Materials | |
| SubSector: Gold | |
| MarketCap: 2792.39 Millions | |
| Recent Price: 2.61 Market Intelligence Score: 10 | |
| Day Percent Change: -1.51% Day Change: -0.04 | |
| Week Change: -9.69% Year-to-date Change: -17.4% | |
| BTG Links: Profile News Message Board | |
| Charts:- Daily , Weekly | |
| Add BTG to Watchlist: View: Get Complete BTG Trend Analysis ➞ | |
 | ASR Grupo Aeroportuario del Sureste, S. A. B. de C. V. |
| Sector: Transports | |
| SubSector: Air Services, Other | |
| MarketCap: 2739.98 Millions | |
| Recent Price: 307.14 Market Intelligence Score: 46 | |
| Day Percent Change: 1.12% Day Change: 3.40 | |
| Week Change: -3.11% Year-to-date Change: 4.4% | |
| ASR Links: Profile News Message Board | |
| Charts:- Daily , Weekly | |
| Add ASR to Watchlist: View: Get Complete ASR Trend Analysis ➞ | |
 | CCJ Cameco Corporation |
| Sector: Materials | |
| SubSector: Industrial Metals & Minerals | |
| MarketCap: 2722.9 Millions | |
| Recent Price: 48.17 Market Intelligence Score: 69 | |
| Day Percent Change: -0.50% Day Change: -0.24 | |
| Week Change: -2.86% Year-to-date Change: 11.8% | |
| CCJ Links: Profile News Message Board | |
| Charts:- Daily , Weekly | |
| Add CCJ to Watchlist: View: Get Complete CCJ Trend Analysis ➞ | |
 | BAK Braskem S.A. |
| Sector: Materials | |
| SubSector: Chemicals - Major Diversified | |
| MarketCap: 2715.86 Millions | |
| Recent Price: 8.64 Market Intelligence Score: 15 | |
| Day Percent Change: 0.82% Day Change: 0.07 | |
| Week Change: -6.8% Year-to-date Change: -2.0% | |
| BAK Links: Profile News Message Board | |
| Charts:- Daily , Weekly | |
| Add BAK to Watchlist: View: Get Complete BAK Trend Analysis ➞ | |
 | BRFS BRF S.A. |
| Sector: Consumer Staples | |
| SubSector: Meat Products | |
| MarketCap: 2635.51 Millions | |
| Recent Price: 3.27 Market Intelligence Score: 38 | |
| Day Percent Change: 0.31% Day Change: 0.01 | |
| Week Change: 2.51% Year-to-date Change: 17.6% | |
| BRFS Links: Profile News Message Board | |
| Charts:- Daily , Weekly | |
| Add BRFS to Watchlist: View: Get Complete BRFS Trend Analysis ➞ | |
 | NG NovaGold Resources Inc. |
| Sector: Materials | |
| SubSector: Gold | |
| MarketCap: 2499.49 Millions | |
| Recent Price: 3.07 Market Intelligence Score: 61 | |
| Day Percent Change: -1.92% Day Change: -0.06 | |
| Week Change: -2.54% Year-to-date Change: -17.9% | |
| NG Links: Profile News Message Board | |
| Charts:- Daily , Weekly | |
| Add NG to Watchlist: View: Get Complete NG Trend Analysis ➞ | |
 | CEF Sprott Physical Gold and Silver Trust |
| Sector: Financials | |
| SubSector: Asset Management | |
| MarketCap: 2485.33 Millions | |
| Recent Price: 22.23 Market Intelligence Score: 83 | |
| Day Percent Change: 0.05% Day Change: 0.01 | |
| Week Change: 1.05% Year-to-date Change: 16.1% | |
| CEF Links: Profile News Message Board | |
| Charts:- Daily , Weekly | |
| Add CEF to Watchlist: View: Get Complete CEF Trend Analysis ➞ | |
 | GIL Gildan Activewear Inc. |
| Sector: Consumer Staples | |
| SubSector: Textile - Apparel Clothing | |
| MarketCap: 2411.65 Millions | |
| Recent Price: 35.12 Market Intelligence Score: 39 | |
| Day Percent Change: -0.26% Day Change: -0.09 | |
| Week Change: -1.32% Year-to-date Change: 6.2% | |
| GIL Links: Profile News Message Board | |
| Charts:- Daily , Weekly | |
| Add GIL to Watchlist: View: Get Complete GIL Trend Analysis ➞ | |
 | CVE Cenovus Energy Inc. |
| Sector: Energy | |
| SubSector: Oil & Gas Drilling & Exploration | |
| MarketCap: 2369.29 Millions | |
| Recent Price: 20.66 Market Intelligence Score: 59 | |
| Day Percent Change: -0.19% Day Change: -0.04 | |
| Week Change: -1.38% Year-to-date Change: 24.1% | |
| CVE Links: Profile News Message Board | |
| Charts:- Daily , Weekly | |
| Add CVE to Watchlist: View: Get Complete CVE Trend Analysis ➞ | |
 | PHYS Sprott Physical Gold Trust |
| Sector: Financials | |
| SubSector: Exchange Traded Fund | |
| MarketCap: 2365.21 Millions | |
| Recent Price: 18.44 Market Intelligence Score: 68 | |
| Day Percent Change: 0.22% Day Change: 0.04 | |
| Week Change: 1.99% Year-to-date Change: 15.8% | |
| PHYS Links: Profile News Message Board | |
| Charts:- Daily , Weekly | |
| Add PHYS to Watchlist: View: Get Complete PHYS Trend Analysis ➞ | |
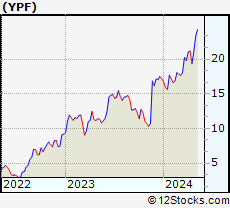 | YPF YPF Sociedad Anonima |
| Sector: Energy | |
| SubSector: Major Integrated Oil & Gas | |
| MarketCap: 2272.35 Millions | |
| Recent Price: 19.07 Market Intelligence Score: 26 | |
| Day Percent Change: -2.05% Day Change: -0.40 | |
| Week Change: -9.92% Year-to-date Change: 10.9% | |
| YPF Links: Profile News Message Board | |
| Charts:- Daily , Weekly | |
| Add YPF to Watchlist: View: Get Complete YPF Trend Analysis ➞ | |
 | VTMX Vesta Financials Corp SAB de CV |
| Sector: Financials | |
| SubSector: REIT - Industrial | |
| MarketCap: 2270 Millions | |
| Recent Price: 35.23 Market Intelligence Score: 32 | |
| Day Percent Change: 0.44% Day Change: 0.16 | |
| Week Change: -1.27% Year-to-date Change: -11.4% | |
| VTMX Links: Profile News Message Board | |
| Charts:- Daily , Weekly | |
| Add VTMX to Watchlist: View: Get Complete VTMX Trend Analysis ➞ | |
 | KOF Coca-Cola FEMSA, S.A.B. de C.V. |
| Sector: Consumer Staples | |
| SubSector: Beverages - Soft Drinks | |
| MarketCap: 2258.9 Millions | |
| Recent Price: 93.24 Market Intelligence Score: 10 | |
| Day Percent Change: 1.36% Day Change: 1.25 | |
| Week Change: -4% Year-to-date Change: -1.5% | |
| KOF Links: Profile News Message Board | |
| Charts:- Daily , Weekly | |
| Add KOF to Watchlist: View: Get Complete KOF Trend Analysis ➞ | |
 | BLDP Ballard Power Systems Inc. |
| Sector: Industrials | |
| SubSector: Industrial Electrical Equipment | |
| MarketCap: 2124.79 Millions | |
| Recent Price: 2.69 Market Intelligence Score: 10 | |
| Day Percent Change: -1.10% Day Change: -0.03 | |
| Week Change: -8.5% Year-to-date Change: -27.3% | |
| BLDP Links: Profile News Message Board | |
| Charts:- Daily , Weekly | |
| Add BLDP to Watchlist: View: Get Complete BLDP Trend Analysis ➞ | |
 | BB BlackBerry Limited |
| Sector: Technology | |
| SubSector: Communication Equipment | |
| MarketCap: 2100.39 Millions | |
| Recent Price: 2.79 Market Intelligence Score: 40 | |
| Day Percent Change: 1.09% Day Change: 0.03 | |
| Week Change: -8.52% Year-to-date Change: -21.2% | |
| BB Links: Profile News Message Board | |
| Charts:- Daily , Weekly | |
| Add BB to Watchlist: View: Get Complete BB Trend Analysis ➞ | |
 | SID Companhia Siderurgica Nacional |
| Sector: Materials | |
| SubSector: Steel & Iron | |
| MarketCap: 2087.58 Millions | |
| Recent Price: 2.72 Market Intelligence Score: 10 | |
| Day Percent Change: -1.09% Day Change: -0.03 | |
| Week Change: -3.2% Year-to-date Change: -30.8% | |
| SID Links: Profile News Message Board | |
| Charts:- Daily , Weekly | |
| Add SID to Watchlist: View: Get Complete SID Trend Analysis ➞ | |
 | CRON Cronos Group Inc. |
| Sector: Health Care | |
| SubSector: Biotechnology | |
| MarketCap: 1935.95 Millions | |
| Recent Price: 2.41 Market Intelligence Score: 31 | |
| Day Percent Change: -0.41% Day Change: -0.01 | |
| Week Change: -5.12% Year-to-date Change: 15.3% | |
| CRON Links: Profile News Message Board | |
| Charts:- Daily , Weekly | |
| Add CRON to Watchlist: View: Get Complete CRON Trend Analysis ➞ | |
 | CIGI Colliers International Group Inc. |
| Sector: Financials | |
| SubSector: Property Management | |
| MarketCap: 1928.42 Millions | |
| Recent Price: 106.94 Market Intelligence Score: 10 | |
| Day Percent Change: -1.84% Day Change: -2.00 | |
| Week Change: -5.5% Year-to-date Change: -15.5% | |
| CIGI Links: Profile News Message Board | |
| Charts:- Daily , Weekly | |
| Add CIGI to Watchlist: View: Get Complete CIGI Trend Analysis ➞ | |
 | ABCL AbCellera Biologics Inc. |
| Sector: Health Care | |
| SubSector: Biotechnology | |
| MarketCap: 1870 Millions | |
| Recent Price: 3.96 Market Intelligence Score: 12 | |
| Day Percent Change: 1.02% Day Change: 0.04 | |
| Week Change: -8.76% Year-to-date Change: -29.9% | |
| ABCL Links: Profile News Message Board | |
| Charts:- Daily , Weekly | |
| Add ABCL to Watchlist: View: Get Complete ABCL Trend Analysis ➞ | |
| To view more stocks, click on Next / Previous arrows or select different range: 0 - 25 , 25 - 50 , 50 - 75 , 75 - 100 , 100 - 125 , 125 - 150 , 150 - 175 , 175 - 200 , 200 - 225 | ||
| Click To Change The Sort Order: By Market Cap or Company Size Performance: Year-to-date, Week and Day | |
| Select Chart Type: | ||
 Best Stocks Today 12Stocks.com |
© 2024 12Stocks.com Terms & Conditions Privacy Contact Us
All Information Provided Only For Education And Not To Be Used For Investing or Trading. See Terms & Conditions


One More Thing ... Get Best Stocks Delivered Daily!
Never Ever Miss A Move With Our Top Ten Stocks Lists
Find Best Stocks In Any Market - Bull or Bear Market
Take A Peek At Our Top Ten Stocks Lists: Daily, Weekly, Year-to-Date & Top Trends
Find Best Stocks In Any Market - Bull or Bear Market
Take A Peek At Our Top Ten Stocks Lists: Daily, Weekly, Year-to-Date & Top Trends
Latin America Stocks With Best Up Trends [0-bearish to 100-bullish]: IMAX [100], SilverCrest Metals[93], Ivanhoe Electric[93], Agnico Eagle[93], Kinross Gold[93], Aurora Cannabis[88], Franco-Nevada [88], Sandstorm Gold[88], Hudbay Minerals[86], Suncor Energy[83], Triple Flag[83]
Best Latin America Stocks Year-to-Date:
Aurora Cannabis[1272.32%], Fusion [121.25%], D-Wave Quantum[100.02%], Banco Macro[68.33%], Grupo Financiero[62.35%], Canopy Growth[53.23%], McEwen Mining[53.12%], Celestica [49.62%], Banco BBVA[48.35%], IAMGOLD [43.87%], OrganiGram [42.75%] Best Latin America Stocks This Week:
Controladora Vuela[11.35%], D-Wave Quantum[7.67%], TransAlta [6.11%], SilverCrest Metals[4.99%], Canada Goose[4.17%], IMAX [4.14%], Hudbay Minerals[3.41%], Lululemon Athletica[3.39%], Agnico Eagle[3.29%], Ivanhoe Electric[3.25%], Franco-Nevada [3.07%] Best Latin America Stocks Daily:
Canopy Growth[20.65%], Aurora Cannabis[12.87%], SilverCrest Metals[6.02%], D-Wave Quantum[5.09%], Controladora Vuela[4.53%], Ivanhoe Electric[3.95%], Hudbay Minerals[3.55%], TransAlta [3.38%], New Found[2.20%], OrganiGram [2.19%], Bausch +[2.03%]