
 Login Sign Up


| |||||
 |  | ||||

| 12Stocks.com Market Intelligence |
Best Latin America Stocks
|
|
| Quick Read: Top Latin America Stocks By Performances & Trends: Daily, Weekly, Year-to-Date, Market Cap (Size) & Technical Trends | |||
| Best Latin America Views: Quick Browse View, Summary & Slide Show | |||
| 12Stocks.com Latin America Stocks Performances & Trends Daily | |||||||||
|
|  The overall market intelligence score is 25 (0-bearish to 100-bullish) which puts Latin America index in short term bearish to neutral trend. The market intelligence score from previous trading session is 42 and hence a deterioration of trend.
| ||||||||
| Here are the market intelligence trend scores of the most requested Latin America stocks at 12Stocks.com (click stock name for detailed review): | |
| Scroll down this page for most comprehensive review of Latin America stocks by performance, trends, technical analysis, charts, fund plays & more | |


| 12Stocks.com: Top Performing Latin America Index Stocks | ||||||||||||||||||||||||||||||||||||||||||||||||
 The top performing Latin America Index stocks year to date are
Now, more recently, over last week, the top performing Latin America Index stocks on the move are


|
||||||||||||||||||||||||||||||||||||||||||||||||
| 12Stocks.com: Investing in Latin America Index with Stocks | |
|
The following table helps investors and traders sort through current performance and trends (as measured by market intelligence score) of various
stocks in the Latin America Index. Quick View: Move mouse or cursor over stock symbol (ticker) to view short-term technical chart and over stock name to view long term chart. Click on  to add stock symbol to your watchlist and to add stock symbol to your watchlist and  to view watchlist. Click on any ticker or stock name for detailed market intelligence report for that stock. to view watchlist. Click on any ticker or stock name for detailed market intelligence report for that stock. |
12Stocks.com Performance of Stocks in Latin America Index
| Ticker | Stock Name | Watchlist | Category | Recent Price | Market Intelligence Score | Change % | YTD Change% |
| TV | Grupo Televisa |   | Services & Goods | 2.94 | 42 | -2.00% | -11.98% |
| RPTX | Repare | | Health Care | 3.30 | 42 | -1.79% | -54.79% |
| KFS | Kingsway Financial | | Financials | 8.70 | 42 | -1.69% | 3.57% |
| QSR | Restaurant Brands | | Services & Goods | 73.62 | 42 | -0.98% | -5.77% |
| CSAN | Cosan S.A | | Energy | 11.16 | 42 | -0.80% | -29.17% |
| ITUB | Itau Unibanco | | Financials | 6.21 | 42 | -0.64% | -10.65% |
| TD | Toronto-Dominion Bank | | Financials | 58.67 | 42 | -0.42% | -9.21% |
| TCX | Tucows | | Technology | 17.92 | 42 | 1.82% | -33.63% |
| BSBR | Banco Santander | | Financials | 5.27 | 42 | -0.38% | -19.54% |
| EMX | EMX Royalty | | Materials | 1.90 | 41 | 0.53% | 17.28% |
| BHC | Bausch Health | | Health Care | 8.56 | 41 | 0.35% | 6.73% |
| PLG | Platinum | | Materials | 1.30 | 41 | -0.76% | 14.04% |
| EDSA | Edesa Biotech | | Health Care | 4.30 | 41 | -3.70% | -7.33% |
| CRESY | Cresud Sociedad | | Consumer Staples | 9.14 | 38 | -3.89% | -3.59% |
| RY | Royal Bank | | Financials | 97.27 | 38 | -2.58% | -3.82% |
| GOOS | Canada Goose | | Consumer Staples | 11.50 | 37 | 1.14% | -2.95% |
| BAM | Brookfield Asset | | Financials | 39.18 | 37 | -1.04% | -2.46% |
| THM | Tower | | Materials | 0.64 | 36 | 0.91% | 9.40% |
| SUZ | Suzano S.A | | Consumer Staples | 11.74 | 36 | 0.00% | 3.35% |
| NGD | New Gold | | Materials | 1.72 | 36 | 0.00% | 17.81% |
| TFII | TFI | | Transports | 140.46 | 36 | -4.68% | 3.29% |
| IE | Ivanhoe Electric | | Materials | 9.37 | 36 | -3.70% | -7.55% |
| NG | NovaGold Resources | | Materials | 2.85 | 36 | -2.73% | -23.80% |
| SVM | Silvercorp Metals | | Materials | 3.47 | 36 | -1.98% | 31.94% |
| EGO | Eldorado Gold | | Materials | 14.34 | 36 | -0.76% | 10.56% |
| To view more stocks, click on Next / Previous arrows or select different range: 0 - 25 , 25 - 50 , 50 - 75 , 75 - 100 , 100 - 125 , 125 - 150 , 150 - 175 , 175 - 200 , 200 - 225 | ||
 | Click To Change The Sort Order: By Market Cap or Company Size Performance: Year-to-date, Week and Day |  |
| Detailed Overview Of Latin America Stocks |
| Latin America Technical Overview, Leaders & Laggards, Top Latin America ETF Funds & Detailed Latin America Stocks List, Charts, Trends & More |
| Latin America: Technical Analysis, Trends & YTD Performance | |
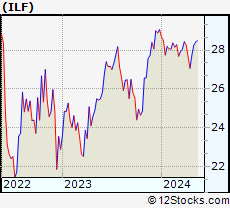
 ILF Weekly Chart |
|
| Long Term Trend: Not Good | |
| Medium Term Trend: Not Good | |
 ILF Daily Chart |
|
| Short Term Trend: Very Good | |
| Overall Trend Score: 25 | |
| YTD Performance: -6.02% | |
| **Trend Scores & Views Are Only For Educational Purposes And Not For Investing | |
| 12Stocks.com: Investing in Latin America Index using Exchange Traded Funds | |
|
The following table shows list of key exchange traded funds (ETF) that
help investors play Latin America stock market. For detailed view, check out our ETF Funds section of our website. Quick View: Move mouse or cursor over ETF symbol (ticker) to view short-term technical chart and over ETF name to view long term chart. Click on ticker or stock name for detailed view. Click on to add stock symbol to your watchlist and to view watchlist. |
12Stocks.com List of ETFs that track Latin America Index
| Ticker | ETF Name | Watchlist | Recent Price | Market Intelligence Score | Change % | Week % | Year-to-date % |
| ILF | Latin America 40 | | 27.31 | 25 | -0.65 | 0.89 | -6.02% |
| EWC | Canada | | 37.36 | 61 | -0.90 | 0.67 | 1.85% |
| FLN | Latin America AlphaDEX | | 19.47 | 31 | -0.99 | 1.3 | -6.35% |
| EWZ | Brazil | | 30.99 | 49 | -0.55 | 0.81 | -11.36% |
| EWW | Mexico | | 65.77 | 25 | -1.08 | 1.36 | -3.07% |
| ARGT | Argentina | | 54.52 | 71 | -2.36 | 1.96 | 6.19% |
| EWZS | Brazil Small-Cap | | 13.17 | 17 | -0.75 | 1.31 | -12.55% |
| BRF | Brazil Small-Cap | | 15.02 | 10 | -0.46 | 1.08 | -14.6% |
| BZQ | Short Brazil | | 12.53 | 74 | 1.13 | -1.63 | 24.88% |
| BRZU | Brazil Bull 3X | | 78.17 | 42 | -1.03 | 1.78 | -24.02% |
| FBZ | Brazil AlphaDEX | | 11.25 | 17 | -0.88 | 0.09 | -7.95% |
| 12Stocks.com: Charts, Trends, Fundamental Data and Performances of Latin America Stocks | |
|
We now take in-depth look at all Latin America stocks including charts, multi-period performances and overall trends (as measured by market intelligence score). One can sort Latin America stocks (click link to choose) by Daily, Weekly and by Year-to-Date performances. Also, one can sort by size of the company or by market capitalization. |
| Select Your Default Chart Type: | |||||
| |||||
| Click on stock symbol or name for detailed view. Click on to add stock symbol to your watchlist and to view watchlist. Quick View: Move mouse or cursor over "Daily" to quickly view daily technical stock chart and over "Weekly" to view weekly technical stock chart. | |||||

 | TV Grupo Televisa, S.A.B. |
| Sector: Services & Goods | |
| SubSector: Broadcasting - TV | |
| MarketCap: 3740.43 Millions | |
| Recent Price: 2.94 Market Intelligence Score: 42 | |
| Day Percent Change: -2.00% Day Change: -0.06 | |
| Week Change: 4.63% Year-to-date Change: -12.0% | |
| TV Links: Profile News Message Board | |
| Charts:- Daily , Weekly | |
| Add TV to Watchlist: View: Get Complete TV Trend Analysis ➞ | |
 | RPTX Repare Therapeutics Inc. |
| Sector: Health Care | |
| SubSector: Biotechnology | |
| MarketCap: 13687 Millions | |
| Recent Price: 3.30 Market Intelligence Score: 42 | |
| Day Percent Change: -1.79% Day Change: -0.06 | |
| Week Change: 9.27% Year-to-date Change: -54.8% | |
| RPTX Links: Profile News Message Board | |
| Charts:- Daily , Weekly | |
| Add RPTX to Watchlist: View: Get Complete RPTX Trend Analysis ➞ | |
 | KFS Kingsway Financial Services Inc. |
| Sector: Financials | |
| SubSector: Property & Casualty Insurance | |
| MarketCap: 47.5812 Millions | |
| Recent Price: 8.70 Market Intelligence Score: 42 | |
| Day Percent Change: -1.69% Day Change: -0.15 | |
| Week Change: 0.81% Year-to-date Change: 3.6% | |
| KFS Links: Profile News Message Board | |
| Charts:- Daily , Weekly | |
| Add KFS to Watchlist: View: Get Complete KFS Trend Analysis ➞ | |
 | QSR Restaurant Brands International Inc. |
| Sector: Services & Goods | |
| SubSector: Restaurants | |
| MarketCap: 9551 Millions | |
| Recent Price: 73.62 Market Intelligence Score: 42 | |
| Day Percent Change: -0.98% Day Change: -0.73 | |
| Week Change: 3.08% Year-to-date Change: -5.8% | |
| QSR Links: Profile News Message Board | |
| Charts:- Daily , Weekly | |
| Add QSR to Watchlist: View: Get Complete QSR Trend Analysis ➞ | |
 | CSAN Cosan S.A. |
| Sector: Energy | |
| SubSector: Oil & Gas Refining & Marketing | |
| MarketCap: 6890 Millions | |
| Recent Price: 11.16 Market Intelligence Score: 42 | |
| Day Percent Change: -0.80% Day Change: -0.09 | |
| Week Change: 0.72% Year-to-date Change: -29.2% | |
| CSAN Links: Profile News Message Board | |
| Charts:- Daily , Weekly | |
| Add CSAN to Watchlist: View: Get Complete CSAN Trend Analysis ➞ | |
 | ITUB Itau Unibanco Holding S.A. |
| Sector: Financials | |
| SubSector: Foreign Regional Banks | |
| MarketCap: 48121 Millions | |
| Recent Price: 6.21 Market Intelligence Score: 42 | |
| Day Percent Change: -0.64% Day Change: -0.04 | |
| Week Change: 2.64% Year-to-date Change: -10.7% | |
| ITUB Links: Profile News Message Board | |
| Charts:- Daily , Weekly | |
| Add ITUB to Watchlist: View: Get Complete ITUB Trend Analysis ➞ | |
 | TD The Toronto-Dominion Bank |
| Sector: Financials | |
| SubSector: Money Center Banks | |
| MarketCap: 75152.4 Millions | |
| Recent Price: 58.67 Market Intelligence Score: 42 | |
| Day Percent Change: -0.42% Day Change: -0.25 | |
| Week Change: 1% Year-to-date Change: -9.2% | |
| TD Links: Profile News Message Board | |
| Charts:- Daily , Weekly | |
| Add TD to Watchlist: View: Get Complete TD Trend Analysis ➞ | |
 | TCX Tucows Inc. |
| Sector: Technology | |
| SubSector: Internet Information Providers | |
| MarketCap: 557.78 Millions | |
| Recent Price: 17.92 Market Intelligence Score: 42 | |
| Day Percent Change: 1.82% Day Change: 0.32 | |
| Week Change: 2.34% Year-to-date Change: -33.6% | |
| TCX Links: Profile News Message Board | |
| Charts:- Daily , Weekly | |
| Add TCX to Watchlist: View: Get Complete TCX Trend Analysis ➞ | |
 | BSBR Banco Santander (Brasil) S.A. |
| Sector: Financials | |
| SubSector: Foreign Regional Banks | |
| MarketCap: 21961.4 Millions | |
| Recent Price: 5.27 Market Intelligence Score: 42 | |
| Day Percent Change: -0.38% Day Change: -0.02 | |
| Week Change: 0.38% Year-to-date Change: -19.5% | |
| BSBR Links: Profile News Message Board | |
| Charts:- Daily , Weekly | |
| Add BSBR to Watchlist: View: Get Complete BSBR Trend Analysis ➞ | |
 | EMX EMX Royalty Corporation |
| Sector: Materials | |
| SubSector: Industrial Metals & Minerals | |
| MarketCap: 103.91 Millions | |
| Recent Price: 1.90 Market Intelligence Score: 41 | |
| Day Percent Change: 0.53% Day Change: 0.01 | |
| Week Change: -2.06% Year-to-date Change: 17.3% | |
| EMX Links: Profile News Message Board | |
| Charts:- Daily , Weekly | |
| Add EMX to Watchlist: View: Get Complete EMX Trend Analysis ➞ | |
 | BHC Bausch Health Companies Inc. |
| Sector: Health Care | |
| SubSector: Drug Delivery | |
| MarketCap: 5485.3 Millions | |
| Recent Price: 8.56 Market Intelligence Score: 41 | |
| Day Percent Change: 0.35% Day Change: 0.03 | |
| Week Change: -1.5% Year-to-date Change: 6.7% | |
| BHC Links: Profile News Message Board | |
| Charts:- Daily , Weekly | |
| Add BHC to Watchlist: View: Get Complete BHC Trend Analysis ➞ | |
 | PLG Platinum Group Metals Ltd. |
| Sector: Materials | |
| SubSector: Industrial Metals & Minerals | |
| MarketCap: 77.591 Millions | |
| Recent Price: 1.30 Market Intelligence Score: 41 | |
| Day Percent Change: -0.76% Day Change: -0.01 | |
| Week Change: -2.99% Year-to-date Change: 14.0% | |
| PLG Links: Profile News Message Board | |
| Charts:- Daily , Weekly | |
| Add PLG to Watchlist: View: Get Complete PLG Trend Analysis ➞ | |
 | EDSA Edesa Biotech, Inc. |
| Sector: Health Care | |
| SubSector: Biotechnology | |
| MarketCap: 19.6785 Millions | |
| Recent Price: 4.30 Market Intelligence Score: 41 | |
| Day Percent Change: -3.70% Day Change: -0.17 | |
| Week Change: -3.8% Year-to-date Change: -7.3% | |
| EDSA Links: Profile News Message Board | |
| Charts:- Daily , Weekly | |
| Add EDSA to Watchlist: View: Get Complete EDSA Trend Analysis ➞ | |
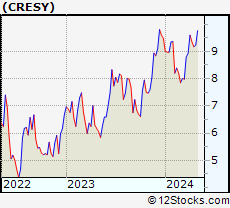 | CRESY Cresud Sociedad Anonima Comercial, Inmobiliaria, Financiera y Agropecuaria |
| Sector: Consumer Staples | |
| SubSector: Farm Products | |
| MarketCap: 224.187 Millions | |
| Recent Price: 9.14 Market Intelligence Score: 38 | |
| Day Percent Change: -3.89% Day Change: -0.37 | |
| Week Change: -0.33% Year-to-date Change: -3.6% | |
| CRESY Links: Profile News Message Board | |
| Charts:- Daily , Weekly | |
| Add CRESY to Watchlist: View: Get Complete CRESY Trend Analysis ➞ | |
 | RY Royal Bank of Canada |
| Sector: Financials | |
| SubSector: Money Center Banks | |
| MarketCap: 87565.4 Millions | |
| Recent Price: 97.27 Market Intelligence Score: 38 | |
| Day Percent Change: -2.58% Day Change: -2.58 | |
| Week Change: -0.6% Year-to-date Change: -3.8% | |
| RY Links: Profile News Message Board | |
| Charts:- Daily , Weekly | |
| Add RY to Watchlist: View: Get Complete RY Trend Analysis ➞ | |
 | GOOS Canada Goose Holdings Inc. |
| Sector: Consumer Staples | |
| SubSector: Textile - Apparel Clothing | |
| MarketCap: 881.465 Millions | |
| Recent Price: 11.50 Market Intelligence Score: 37 | |
| Day Percent Change: 1.14% Day Change: 0.13 | |
| Week Change: 0.7% Year-to-date Change: -3.0% | |
| GOOS Links: Profile News Message Board | |
| Charts:- Daily , Weekly | |
| Add GOOS to Watchlist: View: Get Complete GOOS Trend Analysis ➞ | |
 | BAM Brookfield Asset Management Inc. |
| Sector: Financials | |
| SubSector: Real Estate Development | |
| MarketCap: 47134.9 Millions | |
| Recent Price: 39.18 Market Intelligence Score: 37 | |
| Day Percent Change: -1.04% Day Change: -0.41 | |
| Week Change: 2.24% Year-to-date Change: -2.5% | |
| BAM Links: Profile News Message Board | |
| Charts:- Daily , Weekly | |
| Add BAM to Watchlist: View: Get Complete BAM Trend Analysis ➞ | |
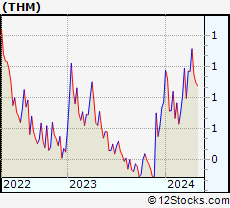 | THM International Tower Hill Mines Ltd. |
| Sector: Materials | |
| SubSector: Gold | |
| MarketCap: 70.4619 Millions | |
| Recent Price: 0.64 Market Intelligence Score: 36 | |
| Day Percent Change: 0.91% Day Change: 0.01 | |
| Week Change: -5.19% Year-to-date Change: 9.4% | |
| THM Links: Profile News Message Board | |
| Charts:- Daily , Weekly | |
| Add THM to Watchlist: View: Get Complete THM Trend Analysis ➞ | |
 | SUZ Suzano S.A. |
| Sector: Consumer Staples | |
| SubSector: Paper & Paper Products | |
| MarketCap: 7042.93 Millions | |
| Recent Price: 11.74 Market Intelligence Score: 36 | |
| Day Percent Change: 0.00% Day Change: 0.00 | |
| Week Change: -0.42% Year-to-date Change: 3.4% | |
| SUZ Links: Profile News Message Board | |
| Charts:- Daily , Weekly | |
| Add SUZ to Watchlist: View: Get Complete SUZ Trend Analysis ➞ | |
 | NGD New Gold Inc. |
| Sector: Materials | |
| SubSector: Gold | |
| MarketCap: 398.119 Millions | |
| Recent Price: 1.72 Market Intelligence Score: 36 | |
| Day Percent Change: 0.00% Day Change: 0.00 | |
| Week Change: -1.71% Year-to-date Change: 17.8% | |
| NGD Links: Profile News Message Board | |
| Charts:- Daily , Weekly | |
| Add NGD to Watchlist: View: Get Complete NGD Trend Analysis ➞ | |
 | TFII TFI International Inc. |
| Sector: Transports | |
| SubSector: Trucking | |
| MarketCap: 1621.25 Millions | |
| Recent Price: 140.46 Market Intelligence Score: 36 | |
| Day Percent Change: -4.68% Day Change: -6.90 | |
| Week Change: -1.75% Year-to-date Change: 3.3% | |
| TFII Links: Profile News Message Board | |
| Charts:- Daily , Weekly | |
| Add TFII to Watchlist: View: Get Complete TFII Trend Analysis ➞ | |
 | IE Ivanhoe Electric Inc. |
| Sector: Materials | |
| SubSector: Copper | |
| MarketCap: 1200 Millions | |
| Recent Price: 9.37 Market Intelligence Score: 36 | |
| Day Percent Change: -3.70% Day Change: -0.36 | |
| Week Change: -11.6% Year-to-date Change: -7.6% | |
| IE Links: Profile News Message Board | |
| Charts:- Daily , Weekly | |
| Add IE to Watchlist: View: Get Complete IE Trend Analysis ➞ | |
 | NG NovaGold Resources Inc. |
| Sector: Materials | |
| SubSector: Gold | |
| MarketCap: 2499.49 Millions | |
| Recent Price: 2.85 Market Intelligence Score: 36 | |
| Day Percent Change: -2.73% Day Change: -0.08 | |
| Week Change: -8.06% Year-to-date Change: -23.8% | |
| NG Links: Profile News Message Board | |
| Charts:- Daily , Weekly | |
| Add NG to Watchlist: View: Get Complete NG Trend Analysis ➞ | |
 | SVM Silvercorp Metals Inc. |
| Sector: Materials | |
| SubSector: Silver | |
| MarketCap: 504.056 Millions | |
| Recent Price: 3.47 Market Intelligence Score: 36 | |
| Day Percent Change: -1.98% Day Change: -0.07 | |
| Week Change: -2.8% Year-to-date Change: 31.9% | |
| SVM Links: Profile News Message Board | |
| Charts:- Daily , Weekly | |
| Add SVM to Watchlist: View: Get Complete SVM Trend Analysis ➞ | |
 | EGO Eldorado Gold Corporation |
| Sector: Materials | |
| SubSector: Gold | |
| MarketCap: 982.519 Millions | |
| Recent Price: 14.34 Market Intelligence Score: 36 | |
| Day Percent Change: -0.76% Day Change: -0.11 | |
| Week Change: -4.65% Year-to-date Change: 10.6% | |
| EGO Links: Profile News Message Board | |
| Charts:- Daily , Weekly | |
| Add EGO to Watchlist: View: Get Complete EGO Trend Analysis ➞ | |
| To view more stocks, click on Next / Previous arrows or select different range: 0 - 25 , 25 - 50 , 50 - 75 , 75 - 100 , 100 - 125 , 125 - 150 , 150 - 175 , 175 - 200 , 200 - 225 | ||
| Click To Change The Sort Order: By Market Cap or Company Size Performance: Year-to-date, Week and Day | |
| Select Chart Type: | ||
 Best Stocks Today 12Stocks.com |
© 2024 12Stocks.com Terms & Conditions Privacy Contact Us
All Information Provided Only For Education And Not To Be Used For Investing or Trading. See Terms & Conditions


One More Thing ... Get Best Stocks Delivered Daily!
Never Ever Miss A Move With Our Top Ten Stocks Lists
Find Best Stocks In Any Market - Bull or Bear Market
Take A Peek At Our Top Ten Stocks Lists: Daily, Weekly, Year-to-Date & Top Trends
Find Best Stocks In Any Market - Bull or Bear Market
Take A Peek At Our Top Ten Stocks Lists: Daily, Weekly, Year-to-Date & Top Trends
Latin America Stocks With Best Up Trends [0-bearish to 100-bullish]: SilverCrest Metals[100], Controladora Vuela[100], SunOpta [100], IMAX [100], Grupo Aeroportuario[100], Descartes Systems[100], Grupo Aeroportuario[100], Mercer [93], Algonquin Power[93], Algonquin Power[93], Despegar.com [90]
Best Latin America Stocks Year-to-Date:
Aurora Cannabis[1411.97%], Fusion [122.92%], Canopy Growth[75.54%], D-Wave Quantum[72.1%], Banco Macro[70.66%], Grupo Financiero[68.38%], Banco BBVA[62.68%], McEwen Mining[51.46%], Celestica [50.61%], OrganiGram [47.33%], IAMGOLD [42.29%] Best Latin America Stocks This Week:
Canopy Growth[12.97%], Grupo Aeroportuario[12.81%], SunOpta [12.08%], Aurora Cannabis[11.46%], Controladora Vuela[11.28%], Grupo Aeroportuario[10.38%], Repare [9.27%], Central Puerto[8.43%], Celestica [8.27%], Despegar.com [8.07%], Grupo Aeroportuario[7.94%] Best Latin America Stocks Daily:
SilverCrest Metals[3.95%], AbCellera Biologics[3.64%], Seabridge Gold[3.62%], Despegar.com [3.03%], Mercer [2.61%], Controladora Vuela[2.36%], TELUS [2.36%], SunOpta [1.98%], SSR Mining[1.96%], Tucows [1.82%], Lion Electric[1.79%]