
 Login Sign Up


| |||||
 |  | ||||

| 12Stocks.com Market Intelligence |
Best Japan Stocks
|
On this page, you will find the most comprehensive analysis of Japanese stocks and ETFs - from latest trends to performances to charts ➞. First, Year-to-Date (YTD) performances of the most requested Japan & other Asia-Pacific stocks at 12Stocks.com (click stock for review):
| Nomura 30% | ||
| Taiwan Semiconductor 27% | ||
| Toyota Motor 26% | ||
| New Oriental 19% | ||
| Sumitomo Mitsui 15% | ||
| Mizuho Financial 12% | ||
| Honda Motor 11% | ||
| ORIX 9% | ||
| NetEase -1% | ||
| Alibaba -11% | ||
| Baidu -20% | ||
| In a hurry? Japan Stocks Lists: Performance Trends Table, Stock Charts
Sort Japan stocks: Daily, Weekly, Year-to-Date, Market Cap & Trends. |
| 12Stocks.com Japan Stocks Performances & Trends Daily | |||||||||
|
|  The overall Smart Investing & Trading Score is 26 (0-bearish to 100-bullish) which puts Japan index in short term bearish to neutral trend. The Smart Investing & Trading Score from previous trading session is 56 and a deterioration of trend continues.
| ||||||||
Here are the Smart Investing & Trading Scores of the most requested Japan stocks at 12Stocks.com (click stock name for detailed review):
|


| 12Stocks.com: Top Performing Japan Index Stocks | ||||||||||||||||||||||||||||||||||||
 The top performing Japan Index stocks year to date are
Now, more recently, over last week, the top performing Japan Index stocks on the move are


|
||||||||||||||||||||||||||||||||||||
| 12Stocks.com: Investing in Japan Index with Stocks | |
|
The following table helps investors and traders sort through current performance and trends (as measured by Smart Investing & Trading Score) of various
stocks in the Japan Index. Quick View: Move mouse or cursor over stock symbol (ticker) to view short-term technical chart and over stock name to view long term chart. Click on  to add stock symbol to your watchlist and to add stock symbol to your watchlist and  to view watchlist. Click on any ticker or stock name for detailed market intelligence report for that stock. to view watchlist. Click on any ticker or stock name for detailed market intelligence report for that stock. |
12Stocks.com Performance of Stocks in Japan Index
| Ticker | Stock Name | Watchlist | Category | Recent Price | Smart Investing & Trading Score | Change % | Weekly Change% |
| SYT | SYLA |   | Technology | 2.94 | 27 | 8.89% | 10.53% |
| TAK | Takeda Pharmaceutical | | Health Care | 13.16 | 25 | 0.08% | -1.57% |
| MFG | Mizuho Financial | | Financials | 3.84 | 33 | 1.05% | -1.79% |
| JOF | Japan Smaller | | Financials | 7.48 | 10 | -0.13% | -2.60% |
| SMFG | Sumitomo Mitsui | | Financials | 11.14 | 43 | 0.36% | -3.21% |
| IX | ORIX | | Financials | 101.75 | 43 | -0.20% | -3.73% |
| NMR | Nomura | | Financials | 5.87 | 48 | 0.17% | -3.93% |
| HMC | Honda Motor | | Consumer Staples | 34.45 | 26 | -0.75% | -4.57% |
| TM | Toyota Motor | | Consumer Staples | 231.84 | 26 | -0.91% | -4.58% |
| For chart view version of above stock list: Chart View ➞ 0 - 25 | ||
 | Click To Change The Sort Order: By Market Cap or Company Size Performance: Year-to-date, Week and Day |  |
|
Get the most comprehensive stock market coverage daily at 12Stocks.com ➞ Best Stocks Today ➞ Best Stocks Weekly ➞ Best Stocks Year-to-Date ➞ Best Stocks Trends ➞  Best Stocks Today 12Stocks.com Best Nasdaq Stocks ➞ Best S&P 500 Stocks ➞ Best Tech Stocks ➞ Best Biotech Stocks ➞ |
| Detailed Overview of Japan Stocks |
| Japan Technical Overview, Leaders & Laggards, Top Japan ETF Funds & Detailed Japan Stocks List, Charts, Trends & More |
| Japan: Technical Analysis, Trends & YTD Performance | |
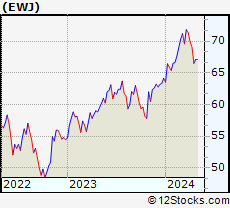
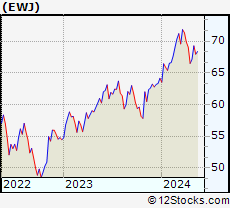
 EWJ Weekly Chart |
|
| Long Term Trend: Good | |
| Medium Term Trend: Not Good | |
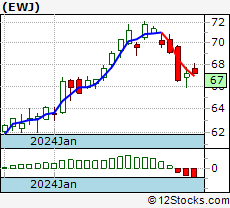
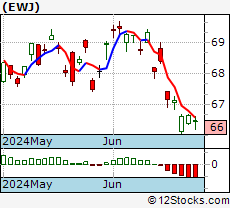 EWJ Daily Chart |
|
| Short Term Trend: Not Good | |
| Overall Trend Score: 26 | |
| YTD Performance: 4.29% | |
| **Trend Scores & Views Are Only For Educational Purposes And Not For Investing | |
| 12Stocks.com: Investing in Japan Index using Exchange Traded Funds | |
|
The following table shows list of key exchange traded funds (ETF) that
help investors play Japan stock market. For detailed view, check out our ETF Funds section of our website. Quick View: Move mouse or cursor over ETF symbol (ticker) to view short-term technical chart and over ETF name to view long term chart. Click on ticker or stock name for detailed view. Click on to add stock symbol to your watchlist and to view watchlist. |
12Stocks.com List of ETFs that track Japan Index
| Ticker | ETF Name | Watchlist | Recent Price | Smart Investing & Trading Score | Change % | Week % | Year-to-date % |
| EWJ | Japan | | 66.89 | 26 | -0.30 | -3.14 | 4.29% |
| SCJ | Japan Small-Cap | | 72.11 | 38 | 0.30 | -2.69 | 0.12% |
| HEWJ | Currency Hedged | | 40.42 | 26 | 0.00 | -2.12 | 15.78% |
| EZJ | Japan | | 38.37 | 13 | -0.36 | -6.53 | 5.6% |
| VPL | Pacific | | 71.74 | 30 | -0.01 | -2.55 | -0.4% |
| DFJ | Japan SmallCap Dividend | | 74.57 | 30 | 0.28 | -2.04 | -0.44% |
| DXJ | Japan Hedged Equity | | 105.72 | 38 | 0.07 | -1.98 | 20.16% |
| DBJP | Japan Hedged Eq | | 72.01 | 26 | 0.08 | -2.11 | 16.07% |
| FXY | Japanese Yen | | 59.89 | 18 | -0.18 | -0.91 | -9% |
| FJP | First Japan | | 52.35 | 20 | -0.03 | -4.23 | 3.89% |
| DXJS | Japan Hedged SmallCap | | 33.15 | 53 | 0.82 | -1.19 | 11.13% |
| GSJY | Goldman Sachs ActiveBeta | | 37.01 | 26 | 0.16 | -2.9 | 5.18% |
| 12Stocks.com: Charts, Trends, Fundamental Data and Performances of Japan Stocks | |
|
We now take in-depth look at all Japan stocks including charts, multi-period performances and overall trends (as measured by Smart Investing & Trading Score). One can sort Japan stocks (click link to choose) by Daily, Weekly and by Year-to-Date performances. Also, one can sort by size of the company or by market capitalization. |
| Select Your Default Chart Type: | |||||
| |||||
| Click on stock symbol or name for detailed view. Click on to add stock symbol to your watchlist and to view watchlist. Quick View: Move mouse or cursor over "Daily" to quickly view daily technical stock chart and over "Weekly" to view weekly technical stock chart. | |||||
 | SYT SYLA Technologies Co., Ltd. |
| Sector: Technology | |
| SubSector: Software - Application | |
| MarketCap: 187 Millions | |
| Recent Price: 2.94 Smart Investing & Trading Score: 27 | |
| Day Percent Change: 8.89% Day Change: 0.24 | |
| Week Change: 10.53% Year-to-date Change: -48.5% | |
| SYT Links: Profile News Message Board | |
| Charts:- Daily , Weekly | |
| Add SYT to Watchlist: View: Get Complete SYT Trend Analysis ➞ | |
 | TAK Takeda Pharmaceutical Company Limited |
| Sector: Health Care | |
| SubSector: Drugs - Generic | |
| MarketCap: 41342.5 Millions | |
| Recent Price: 13.16 Smart Investing & Trading Score: 25 | |
| Day Percent Change: 0.08% Day Change: 0.01 | |
| Week Change: -1.57% Year-to-date Change: -7.8% | |
| TAK Links: Profile News Message Board | |
| Charts:- Daily , Weekly | |
| Add TAK to Watchlist: View: Get Complete TAK Trend Analysis ➞ | |
 | MFG Mizuho Financial Group, Inc. |
| Sector: Financials | |
| SubSector: Foreign Regional Banks | |
| MarketCap: 27893.1 Millions | |
| Recent Price: 3.84 Smart Investing & Trading Score: 33 | |
| Day Percent Change: 1.05% Day Change: 0.04 | |
| Week Change: -1.79% Year-to-date Change: 11.6% | |
| MFG Links: Profile News Message Board | |
| Charts:- Daily , Weekly | |
| Add MFG to Watchlist: View: Get Complete MFG Trend Analysis ➞ | |
 | JOF Japan Smaller Capitalization Fund, Inc. |
| Sector: Financials | |
| SubSector: Closed-End Fund - Foreign | |
| MarketCap: 172.247 Millions | |
| Recent Price: 7.48 Smart Investing & Trading Score: 10 | |
| Day Percent Change: -0.13% Day Change: -0.01 | |
| Week Change: -2.6% Year-to-date Change: -1.5% | |
| JOF Links: Profile News Message Board | |
| Charts:- Daily , Weekly | |
| Add JOF to Watchlist: View: Get Complete JOF Trend Analysis ➞ | |
 | SMFG Sumitomo Mitsui Financial Group, Inc. |
| Sector: Financials | |
| SubSector: Foreign Regional Banks | |
| MarketCap: 36648.5 Millions | |
| Recent Price: 11.14 Smart Investing & Trading Score: 43 | |
| Day Percent Change: 0.36% Day Change: 0.04 | |
| Week Change: -3.21% Year-to-date Change: 15.1% | |
| SMFG Links: Profile News Message Board | |
| Charts:- Daily , Weekly | |
| Add SMFG to Watchlist: View: Get Complete SMFG Trend Analysis ➞ | |
 | IX ORIX Corporation |
| Sector: Financials | |
| SubSector: Credit Services | |
| MarketCap: 15483.4 Millions | |
| Recent Price: 101.75 Smart Investing & Trading Score: 43 | |
| Day Percent Change: -0.20% Day Change: -0.20 | |
| Week Change: -3.73% Year-to-date Change: 9.0% | |
| IX Links: Profile News Message Board | |
| Charts:- Daily , Weekly | |
| Add IX to Watchlist: View: Get Complete IX Trend Analysis ➞ | |
 | NMR Nomura Holdings, Inc. |
| Sector: Financials | |
| SubSector: Investment Brokerage - National | |
| MarketCap: 15277 Millions | |
| Recent Price: 5.87 Smart Investing & Trading Score: 48 | |
| Day Percent Change: 0.17% Day Change: 0.01 | |
| Week Change: -3.93% Year-to-date Change: 30.2% | |
| NMR Links: Profile News Message Board | |
| Charts:- Daily , Weekly | |
| Add NMR to Watchlist: View: Get Complete NMR Trend Analysis ➞ | |
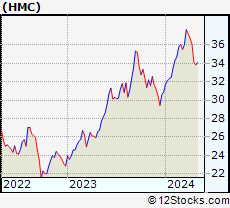 | HMC Honda Motor Co., Ltd. |
| Sector: Consumer Staples | |
| SubSector: Auto Manufacturers - Major | |
| MarketCap: 41585.6 Millions | |
| Recent Price: 34.45 Smart Investing & Trading Score: 26 | |
| Day Percent Change: -0.75% Day Change: -0.26 | |
| Week Change: -4.57% Year-to-date Change: 11.5% | |
| HMC Links: Profile News Message Board | |
| Charts:- Daily , Weekly | |
| Add HMC to Watchlist: View: Get Complete HMC Trend Analysis ➞ | |
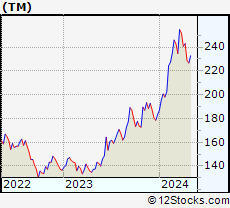 | TM Toyota Motor Corporation |
| Sector: Consumer Staples | |
| SubSector: Auto Manufacturers - Major | |
| MarketCap: 209536 Millions | |
| Recent Price: 231.84 Smart Investing & Trading Score: 26 | |
| Day Percent Change: -0.91% Day Change: -2.13 | |
| Week Change: -4.58% Year-to-date Change: 26.4% | |
| TM Links: Profile News Message Board | |
| Charts:- Daily , Weekly | |
| Add TM to Watchlist: View: Get Complete TM Trend Analysis ➞ | |
| For tabular summary view of above stock list: Summary View ➞ 0 - 25 | ||
| Click To Change The Sort Order: By Market Cap or Company Size Performance: Year-to-date, Week and Day | |
| Select Chart Type: | ||
|
Best Stocks Today 12Stocks.com |
© 2024 12Stocks.com Terms & Conditions Privacy Contact Us
All Information Provided Only For Education And Not To Be Used For Investing or Trading. See Terms & Conditions


One More Thing ... Get Best Stocks Delivered Daily!
Never Ever Miss A Move With Our Top Ten Stocks Lists
Find Best Stocks In Any Market - Bull or Bear Market
Take A Peek At Our Top Ten Stocks Lists: Daily, Weekly, Year-to-Date & Top Trends
Find Best Stocks In Any Market - Bull or Bear Market
Take A Peek At Our Top Ten Stocks Lists: Daily, Weekly, Year-to-Date & Top Trends
Japan Stocks With Best Up Trends [0-bearish to 100-bullish]: Nomura [48], Sumitomo Mitsui[43], ORIX [43], Mizuho Financial[33], SYLA [27], Honda Motor[26], Toyota Motor[26], Takeda Pharmaceutical[25], Japan Smaller[10],
Best Japan Stocks Year-to-Date:
Nomura [30.16%], Toyota Motor[26.43%], Sumitomo Mitsui[15.08%], Mizuho Financial[11.63%], Honda Motor[11.45%], ORIX [8.95%], Japan Smaller[-1.45%], Takeda Pharmaceutical[-7.78%], SYLA [-48.51%], Best Japan Stocks This Week:
SYLA [10.53%], Takeda Pharmaceutical[-1.57%], Mizuho Financial[-1.79%], Japan Smaller[-2.6%], Sumitomo Mitsui[-3.21%], ORIX [-3.73%], Nomura [-3.93%], Honda Motor[-4.57%], Toyota Motor[-4.58%], Best Japan Stocks Daily:
SYLA [8.89%], Mizuho Financial[1.05%], Sumitomo Mitsui[0.36%], Nomura [0.17%], Takeda Pharmaceutical[0.08%], Japan Smaller[-0.13%], ORIX [-0.20%], Honda Motor[-0.75%], Toyota Motor[-0.91%],