
 Login Sign Up


| |||||
 |  | ||||

| 12Stocks.com Market Intelligence |
Best Industrial Stocks
| In a hurry? Industrial Stocks Lists: Performance Trends Table, Stock Charts
Sort Industrial stocks: Daily, Weekly, Year-to-Date, Market Cap & Trends. Filter Industrial stocks list by size:All Industrial Large Mid-Range Small |
| 12Stocks.com Industrial Stocks Performances & Trends Daily | |||||||||
|
|  The overall Smart Investing & Trading Score is 41 (0-bearish to 100-bullish) which puts Industrial sector in short term neutral trend. The Smart Investing & Trading Score from previous trading session is 31 and hence an improvement of trend.
| ||||||||
Here are the Smart Investing & Trading Scores of the most requested Industrial stocks at 12Stocks.com (click stock name for detailed review):
|


| 12Stocks.com: Investing in Industrial sector with Stocks | |
|
The following table helps investors and traders sort through current performance and trends (as measured by Smart Investing & Trading Score) of various
stocks in the Industrial sector. Quick View: Move mouse or cursor over stock symbol (ticker) to view short-term Technical chart and over stock name to view long term chart. Click on  to add stock symbol to your watchlist and to add stock symbol to your watchlist and  to view watchlist. Click on any ticker or stock name for detailed market intelligence report for that stock. to view watchlist. Click on any ticker or stock name for detailed market intelligence report for that stock. |
12Stocks.com Performance of Stocks in Industrial Sector
| Ticker | Stock Name | Watchlist | Category | Recent Price | Smart Investing & Trading Score | Change % | YTD Change% |
| WCN | Waste Connections |   | Waste Mgmt | 165.02 | 56 | 0.40% | 10.55% |
| CMI | Cummins | | Machinery | 287.56 | 36 | -1.32% | 20.03% |
| TDG | TransDigm | | Aerospace/Defense | 1187.70 | 26 | -2.13% | 17.41% |
| AME | AMETEK | | Machinery | 177.70 | 36 | 0.24% | 7.77% |
| ROK | Rockwell Automation | | Machinery | 269.96 | 26 | -1.29% | -13.05% |
| PH | Parker-Hannifin | | Equipment | 534.65 | 31 | -0.64% | 16.05% |
| SWK | Stanley Black | | Machine Tools | 89.32 | 10 | 0.00% | -8.95% |
| DHI | D.R. Horton | | Residential | 142.19 | 13 | -2.53% | -6.44% |
| WY | Weyerhaeuser | | Lumber, Wood | 31.47 | 10 | 0.38% | -9.49% |
| VMC | Vulcan Materials | | Building Materials | 252.06 | 26 | -1.18% | 11.03% |
| XYL | Xylem | | Machinery | 127.84 | 68 | 0.53% | 11.79% |
| LEN | Lennar | | Residential | 150.19 | 23 | -1.51% | 0.77% |
| DOV | Dover | | Machinery | 169.84 | 53 | 0.73% | 10.42% |
| MLM | Martin Marietta | | Building Materials | 575.89 | 26 | -1.91% | 15.43% |
| HEI | HEICO | | Aerospace/Defense | 197.10 | 81 | 0.22% | 10.19% |
| IEP | Icahn Enterprises | | Conglomerates | 17.00 | 18 | 0.65% | -1.11% |
| NVR | NVR | | Residential | 7685.00 | 49 | -0.22% | 9.78% |
| IEX | IDEX | | Machinery | 227.04 | 36 | 0.42% | 4.57% |
| CNHI | CNH | | Machinery | 12.31 | 36 | -0.73% | 1.07% |
| IR | Ingersoll Rand | | Machinery | 88.40 | 26 | -0.64% | 14.30% |
| MAS | Masco | | Building Materials | 71.91 | 36 | -0.43% | 7.36% |
| PINS | | Conglomerates | 32.40 | 0 | -1.55% | -12.53% | |
| GGG | Graco | | Machinery | 88.38 | 36 | 0.33% | 1.87% |
| LII | Lennox | | Machinery | 457.15 | 36 | -0.32% | 2.15% |
| TS | Tenaris S.A | | Fabrication | 37.90 | 54 | 1.42% | 9.03% |
| For chart view version of above stock list: Chart View ➞ 0 - 25 , 25 - 50 , 50 - 75 , 75 - 100 , 100 - 125 , 125 - 150 , 150 - 175 , 175 - 200 , 200 - 225 , 225 - 250 , 250 - 275 , 275 - 300 | ||
 | Click To Change The Sort Order: By Market Cap or Company Size Performance: Year-to-date, Week and Day |  |
|
Get the most comprehensive stock market coverage daily at 12Stocks.com ➞ Best Stocks Today ➞ Best Stocks Weekly ➞ Best Stocks Year-to-Date ➞ Best Stocks Trends ➞  Best Stocks Today 12Stocks.com Best Nasdaq Stocks ➞ Best S&P 500 Stocks ➞ Best Tech Stocks ➞ Best Biotech Stocks ➞ |
| Detailed Overview of Industrial Stocks |
| Industrial Technical Overview, Leaders & Laggards, Top Industrial ETF Funds & Detailed Industrial Stocks List, Charts, Trends & More |
| Industrial Sector: Technical Analysis, Trends & YTD Performance | |
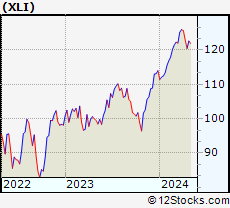
| Industrial sector is composed of stocks
from industrial machinery, aerospace, defense, farm/construction
and industrial services subsectors. Industrial sector, as represented by XLI, an exchange-traded fund [ETF] that holds basket of Industrial stocks (e.g, Caterpillar, Boeing) is up by 5.68% and is currently outperforming the overall market by 2.3% year-to-date. Below is a quick view of Technical charts and trends: |
|
 XLI Weekly Chart |
|
| Long Term Trend: Good | |
| Medium Term Trend: Not Good | |
 XLI Daily Chart |
|
| Short Term Trend: Not Good | |
| Overall Trend Score: 41 | |
| YTD Performance: 5.68% | |
| **Trend Scores & Views Are Only For Educational Purposes And Not For Investing | |
| 12Stocks.com: Top Performing Industrial Sector Stocks | ||||||||||||||||||||||||||||||||||||||||||||||||
 The top performing Industrial sector stocks year to date are
Now, more recently, over last week, the top performing Industrial sector stocks on the move are


|
||||||||||||||||||||||||||||||||||||||||||||||||
| 12Stocks.com: Investing in Industrial Sector using Exchange Traded Funds | |
|
The following table shows list of key exchange traded funds (ETF) that
help investors track Industrial Index. For detailed view, check out our ETF Funds section of our website. Quick View: Move mouse or cursor over ETF symbol (ticker) to view short-term Technical chart and over ETF name to view long term chart. Click on ticker or stock name for detailed view. Click on to add stock symbol to your watchlist and to view watchlist. |
12Stocks.com List of ETFs that track Industrial Index
| Ticker | ETF Name | Watchlist | Recent Price | Smart Investing & Trading Score | Change % | Week % | Year-to-date % |
| XLI | Industrial | | 120.47 | 41 | -0.18 | -1.98 | 5.68% |
| UXI | Industrials | | 31.55 | 41 | -0.35 | -4 | 9.57% |
| PPA | Aerospace & Defense | | 98.31 | 56 | 0.20 | -0.78 | 6.67% |
| ITA | Aerospace & Defense | | 128.00 | 51 | 0.42 | 0.22 | 1.11% |
| ITB | Home Construction | | 102.36 | 36 | -0.62 | -4.57 | 0.62% |
| XHB | Homebuilders | | 100.16 | 36 | -0.54 | -3.91 | 4.7% |
| SIJ | Short Industrials | | 10.23 | 59 | 0.03 | 4.25 | -9.76% |
| IYJ | Industrials | | 119.41 | 36 | 0.09 | -1.91 | 4.42% |
| EXI | Global Industrials | | 133.02 | 36 | -0.46 | -2.09 | 4.39% |
| VIS | Industrials | | 232.20 | 41 | -0.04 | -2.21 | 5.34% |
| PSCI | SmallCap Industrials | | 118.84 | 36 | 0.52 | -2 | 2.49% |
| XAR | Aerospace & Defense | | 132.23 | 44 | 0.10 | -1.13 | -2.36% |
| ARKQ | ARK Industrial Innovation | | 49.86 | 0 | -0.70 | -5.03 | -13.59% |
| 12Stocks.com: Charts, Trends, Fundamental Data and Performances of Industrial Stocks | |
|
We now take in-depth look at all Industrial stocks including charts, multi-period performances and overall trends (as measured by Smart Investing & Trading Score). One can sort Industrial stocks (click link to choose) by Daily, Weekly and by Year-to-Date performances. Also, one can sort by size of the company or by market capitalization. |
| Select Your Default Chart Type: | |||||
| |||||
| Click on stock symbol or name for detailed view. Click on to add stock symbol to your watchlist and to view watchlist. Quick View: Move mouse or cursor over "Daily" to quickly view daily Technical stock chart and over "Weekly" to view weekly Technical stock chart. | |||||

 | WCN Waste Connections, Inc. |
| Sector: Industrials | |
| SubSector: Waste Management | |
| MarketCap: 23055.8 Millions | |
| Recent Price: 165.02 Smart Investing & Trading Score: 56 | |
| Day Percent Change: 0.40% Day Change: 0.66 | |
| Week Change: -1.26% Year-to-date Change: 10.6% | |
| WCN Links: Profile News Message Board | |
| Charts:- Daily , Weekly | |
| Add WCN to Watchlist: View: Get Complete WCN Trend Analysis ➞ | |
 | CMI Cummins Inc. |
| Sector: Industrials | |
| SubSector: Diversified Machinery | |
| MarketCap: 19127.1 Millions | |
| Recent Price: 287.56 Smart Investing & Trading Score: 36 | |
| Day Percent Change: -1.32% Day Change: -3.86 | |
| Week Change: -3.71% Year-to-date Change: 20.0% | |
| CMI Links: Profile News Message Board | |
| Charts:- Daily , Weekly | |
| Add CMI to Watchlist: View: Get Complete CMI Trend Analysis ➞ | |
 | TDG TransDigm Group Incorporated |
| Sector: Industrials | |
| SubSector: Aerospace/Defense Products & Services | |
| MarketCap: 18441 Millions | |
| Recent Price: 1187.70 Smart Investing & Trading Score: 26 | |
| Day Percent Change: -2.13% Day Change: -25.80 | |
| Week Change: -2.68% Year-to-date Change: 17.4% | |
| TDG Links: Profile News Message Board | |
| Charts:- Daily , Weekly | |
| Add TDG to Watchlist: View: Get Complete TDG Trend Analysis ➞ | |
 | AME AMETEK, Inc. |
| Sector: Industrials | |
| SubSector: Diversified Machinery | |
| MarketCap: 16611.8 Millions | |
| Recent Price: 177.70 Smart Investing & Trading Score: 36 | |
| Day Percent Change: 0.24% Day Change: 0.43 | |
| Week Change: -1.12% Year-to-date Change: 7.8% | |
| AME Links: Profile News Message Board | |
| Charts:- Daily , Weekly | |
| Add AME to Watchlist: View: Get Complete AME Trend Analysis ➞ | |
 | ROK Rockwell Automation, Inc. |
| Sector: Industrials | |
| SubSector: Diversified Machinery | |
| MarketCap: 15666.1 Millions | |
| Recent Price: 269.96 Smart Investing & Trading Score: 26 | |
| Day Percent Change: -1.29% Day Change: -3.54 | |
| Week Change: -5.22% Year-to-date Change: -13.1% | |
| ROK Links: Profile News Message Board | |
| Charts:- Daily , Weekly | |
| Add ROK to Watchlist: View: Get Complete ROK Trend Analysis ➞ | |
 | PH Parker-Hannifin Corporation |
| Sector: Industrials | |
| SubSector: Industrial Equipment & Components | |
| MarketCap: 14888.9 Millions | |
| Recent Price: 534.65 Smart Investing & Trading Score: 31 | |
| Day Percent Change: -0.64% Day Change: -3.44 | |
| Week Change: -2.85% Year-to-date Change: 16.1% | |
| PH Links: Profile News Message Board | |
| Charts:- Daily , Weekly | |
| Add PH to Watchlist: View: Get Complete PH Trend Analysis ➞ | |
 | SWK Stanley Black & Decker, Inc. |
| Sector: Industrials | |
| SubSector: Machine Tools & Accessories | |
| MarketCap: 14274.8 Millions | |
| Recent Price: 89.32 Smart Investing & Trading Score: 10 | |
| Day Percent Change: 0.00% Day Change: 0.00 | |
| Week Change: -2.36% Year-to-date Change: -9.0% | |
| SWK Links: Profile News Message Board | |
| Charts:- Daily , Weekly | |
| Add SWK to Watchlist: View: Get Complete SWK Trend Analysis ➞ | |
 | DHI D.R. Horton, Inc. |
| Sector: Industrials | |
| SubSector: Residential Construction | |
| MarketCap: 13372.6 Millions | |
| Recent Price: 142.19 Smart Investing & Trading Score: 13 | |
| Day Percent Change: -2.53% Day Change: -3.69 | |
| Week Change: -6.28% Year-to-date Change: -6.4% | |
| DHI Links: Profile News Message Board | |
| Charts:- Daily , Weekly | |
| Add DHI to Watchlist: View: Get Complete DHI Trend Analysis ➞ | |
 | WY Weyerhaeuser Company |
| Sector: Industrials | |
| SubSector: Lumber, Wood Production | |
| MarketCap: 13244.8 Millions | |
| Recent Price: 31.47 Smart Investing & Trading Score: 10 | |
| Day Percent Change: 0.38% Day Change: 0.12 | |
| Week Change: -5.32% Year-to-date Change: -9.5% | |
| WY Links: Profile News Message Board | |
| Charts:- Daily , Weekly | |
| Add WY to Watchlist: View: Get Complete WY Trend Analysis ➞ | |
 | VMC Vulcan Materials Company |
| Sector: Industrials | |
| SubSector: General Building Materials | |
| MarketCap: 12304.7 Millions | |
| Recent Price: 252.06 Smart Investing & Trading Score: 26 | |
| Day Percent Change: -1.18% Day Change: -3.01 | |
| Week Change: -4.08% Year-to-date Change: 11.0% | |
| VMC Links: Profile News Message Board | |
| Charts:- Daily , Weekly | |
| Add VMC to Watchlist: View: Get Complete VMC Trend Analysis ➞ | |
 | XYL Xylem Inc. |
| Sector: Industrials | |
| SubSector: Diversified Machinery | |
| MarketCap: 12195.1 Millions | |
| Recent Price: 127.84 Smart Investing & Trading Score: 68 | |
| Day Percent Change: 0.53% Day Change: 0.68 | |
| Week Change: -0.21% Year-to-date Change: 11.8% | |
| XYL Links: Profile News Message Board | |
| Charts:- Daily , Weekly | |
| Add XYL to Watchlist: View: Get Complete XYL Trend Analysis ➞ | |
 | LEN Lennar Corporation |
| Sector: Industrials | |
| SubSector: Residential Construction | |
| MarketCap: 11926.6 Millions | |
| Recent Price: 150.19 Smart Investing & Trading Score: 23 | |
| Day Percent Change: -1.51% Day Change: -2.30 | |
| Week Change: -6.07% Year-to-date Change: 0.8% | |
| LEN Links: Profile News Message Board | |
| Charts:- Daily , Weekly | |
| Add LEN to Watchlist: View: Get Complete LEN Trend Analysis ➞ | |
 | DOV Dover Corporation |
| Sector: Industrials | |
| SubSector: Diversified Machinery | |
| MarketCap: 10725.6 Millions | |
| Recent Price: 169.84 Smart Investing & Trading Score: 53 | |
| Day Percent Change: 0.73% Day Change: 1.23 | |
| Week Change: -1.29% Year-to-date Change: 10.4% | |
| DOV Links: Profile News Message Board | |
| Charts:- Daily , Weekly | |
| Add DOV to Watchlist: View: Get Complete DOV Trend Analysis ➞ | |
 | MLM Martin Marietta Materials, Inc. |
| Sector: Industrials | |
| SubSector: General Building Materials | |
| MarketCap: 10624.3 Millions | |
| Recent Price: 575.89 Smart Investing & Trading Score: 26 | |
| Day Percent Change: -1.91% Day Change: -11.24 | |
| Week Change: -4.35% Year-to-date Change: 15.4% | |
| MLM Links: Profile News Message Board | |
| Charts:- Daily , Weekly | |
| Add MLM to Watchlist: View: Get Complete MLM Trend Analysis ➞ | |
 | HEI HEICO Corporation |
| Sector: Industrials | |
| SubSector: Aerospace/Defense Products & Services | |
| MarketCap: 10023.1 Millions | |
| Recent Price: 197.10 Smart Investing & Trading Score: 81 | |
| Day Percent Change: 0.22% Day Change: 0.44 | |
| Week Change: 2.78% Year-to-date Change: 10.2% | |
| HEI Links: Profile News Message Board | |
| Charts:- Daily , Weekly | |
| Add HEI to Watchlist: View: Get Complete HEI Trend Analysis ➞ | |
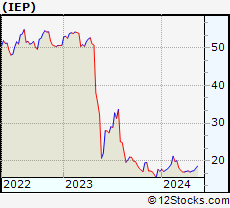 | IEP Icahn Enterprises L.P. |
| Sector: Industrials | |
| SubSector: Conglomerates | |
| MarketCap: 9969.88 Millions | |
| Recent Price: 17.00 Smart Investing & Trading Score: 18 | |
| Day Percent Change: 0.65% Day Change: 0.11 | |
| Week Change: -1.79% Year-to-date Change: -1.1% | |
| IEP Links: Profile News Message Board | |
| Charts:- Daily , Weekly | |
| Add IEP to Watchlist: View: Get Complete IEP Trend Analysis ➞ | |
 | NVR NVR, Inc. |
| Sector: Industrials | |
| SubSector: Residential Construction | |
| MarketCap: 9912.56 Millions | |
| Recent Price: 7685.00 Smart Investing & Trading Score: 49 | |
| Day Percent Change: -0.22% Day Change: -17.26 | |
| Week Change: -1.7% Year-to-date Change: 9.8% | |
| NVR Links: Profile News Message Board | |
| Charts:- Daily , Weekly | |
| Add NVR to Watchlist: View: Get Complete NVR Trend Analysis ➞ | |
 | IEX IDEX Corporation |
| Sector: Industrials | |
| SubSector: Diversified Machinery | |
| MarketCap: 9721.46 Millions | |
| Recent Price: 227.04 Smart Investing & Trading Score: 36 | |
| Day Percent Change: 0.42% Day Change: 0.94 | |
| Week Change: -2.42% Year-to-date Change: 4.6% | |
| IEX Links: Profile News Message Board | |
| Charts:- Daily , Weekly | |
| Add IEX to Watchlist: View: Get Complete IEX Trend Analysis ➞ | |
 | CNHI CNH Industrial N.V. |
| Sector: Industrials | |
| SubSector: Farm & Construction Machinery | |
| MarketCap: 9366.57 Millions | |
| Recent Price: 12.31 Smart Investing & Trading Score: 36 | |
| Day Percent Change: -0.73% Day Change: -0.09 | |
| Week Change: -2.53% Year-to-date Change: 1.1% | |
| CNHI Links: Profile News Message Board | |
| Charts:- Daily , Weekly | |
| Add CNHI to Watchlist: View: Get Complete CNHI Trend Analysis ➞ | |
 | IR Ingersoll Rand Inc. |
| Sector: Industrials | |
| SubSector: Diversified Machinery | |
| MarketCap: 8970.56 Millions | |
| Recent Price: 88.40 Smart Investing & Trading Score: 26 | |
| Day Percent Change: -0.64% Day Change: -0.57 | |
| Week Change: -3.83% Year-to-date Change: 14.3% | |
| IR Links: Profile News Message Board | |
| Charts:- Daily , Weekly | |
| Add IR to Watchlist: View: Get Complete IR Trend Analysis ➞ | |
 | MAS Masco Corporation |
| Sector: Industrials | |
| SubSector: General Building Materials | |
| MarketCap: 8655.63 Millions | |
| Recent Price: 71.91 Smart Investing & Trading Score: 36 | |
| Day Percent Change: -0.43% Day Change: -0.31 | |
| Week Change: -2.23% Year-to-date Change: 7.4% | |
| MAS Links: Profile News Message Board | |
| Charts:- Daily , Weekly | |
| Add MAS to Watchlist: View: Get Complete MAS Trend Analysis ➞ | |
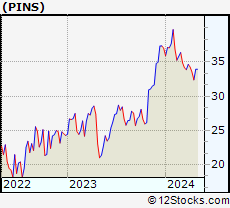 | PINS Pinterest, Inc. |
| Sector: Industrials | |
| SubSector: Conglomerates | |
| MarketCap: 8115.78 Millions | |
| Recent Price: 32.40 Smart Investing & Trading Score: 0 | |
| Day Percent Change: -1.55% Day Change: -0.51 | |
| Week Change: -3.4% Year-to-date Change: -12.5% | |
| PINS Links: Profile News Message Board | |
| Charts:- Daily , Weekly | |
| Add PINS to Watchlist: View: Get Complete PINS Trend Analysis ➞ | |
 | GGG Graco Inc. |
| Sector: Industrials | |
| SubSector: Diversified Machinery | |
| MarketCap: 7739.76 Millions | |
| Recent Price: 88.38 Smart Investing & Trading Score: 36 | |
| Day Percent Change: 0.33% Day Change: 0.29 | |
| Week Change: -1.22% Year-to-date Change: 1.9% | |
| GGG Links: Profile News Message Board | |
| Charts:- Daily , Weekly | |
| Add GGG to Watchlist: View: Get Complete GGG Trend Analysis ➞ | |
 | LII Lennox International Inc. |
| Sector: Industrials | |
| SubSector: Diversified Machinery | |
| MarketCap: 7720.66 Millions | |
| Recent Price: 457.15 Smart Investing & Trading Score: 36 | |
| Day Percent Change: -0.32% Day Change: -1.49 | |
| Week Change: -2.97% Year-to-date Change: 2.2% | |
| LII Links: Profile News Message Board | |
| Charts:- Daily , Weekly | |
| Add LII to Watchlist: View: Get Complete LII Trend Analysis ➞ | |
 | TS Tenaris S.A. |
| Sector: Industrials | |
| SubSector: Metal Fabrication | |
| MarketCap: 7426.8 Millions | |
| Recent Price: 37.90 Smart Investing & Trading Score: 54 | |
| Day Percent Change: 1.42% Day Change: 0.53 | |
| Week Change: -1.64% Year-to-date Change: 9.0% | |
| TS Links: Profile News Message Board | |
| Charts:- Daily , Weekly | |
| Add TS to Watchlist: View: Get Complete TS Trend Analysis ➞ | |
| For tabular summary view of above stock list: Summary View ➞ 0 - 25 , 25 - 50 , 50 - 75 , 75 - 100 , 100 - 125 , 125 - 150 , 150 - 175 , 175 - 200 , 200 - 225 , 225 - 250 , 250 - 275 , 275 - 300 | ||
| Click To Change The Sort Order: By Market Cap or Company Size Performance: Year-to-date, Week and Day | |
| Select Chart Type: | ||
|
Best Stocks Today 12Stocks.com |
© 2024 12Stocks.com Terms & Conditions Privacy Contact Us
All Information Provided Only For Education And Not To Be Used For Investing or Trading. See Terms & Conditions


One More Thing ... Get Best Stocks Delivered Daily!
Never Ever Miss A Move With Our Top Ten Stocks Lists
Find Best Stocks In Any Market - Bull or Bear Market
Take A Peek At Our Top Ten Stocks Lists: Daily, Weekly, Year-to-Date & Top Trends
Find Best Stocks In Any Market - Bull or Bear Market
Take A Peek At Our Top Ten Stocks Lists: Daily, Weekly, Year-to-Date & Top Trends
Industrial Stocks With Best Up Trends [0-bearish to 100-bullish]: Lockheed Martin[100], Argan [95], Generac [93], Himalaya Shipping[90], Caesarstone [90], AAR [90], Sturm Ruger[88], Target Hospitality[86], Mueller Water[85], Select Energy[83], General Dynamics[83]
Best Industrial Stocks Year-to-Date:
Tritium DCFC[497.56%], Intuitive Machines[113.99%], Kaman [92.03%], FTAI Infrastructure[71.47%], Masonite [55.2%], EMCOR [52.55%], Caesarstone [52.14%], ADS-TEC Energy[51.47%], NuScale Power[50.39%], TDCX [47.97%], Graham [47.71%] Best Industrial Stocks This Week:
MingZhu Logistics[17.48%], NET Power[6.5%], Caesarstone [5.76%], AAR [5.48%], Mueller Water[5.27%], Kennametal [4.3%], Sun Country[4.28%], Seaboard [4.11%], Himalaya Shipping[4%], ADS-TEC Energy[3.85%], FTAI Infrastructure[3.73%] Best Industrial Stocks Daily:
MingZhu Logistics[10.31%], Ambipar Emergency[6.09%], Freightos [5.49%], Himalaya Shipping[4.68%], Caesarstone [4.60%], Luxfer [4.15%], Southland [4.10%], ESS Tech[4.03%], Ranpak [3.60%], Preformed Line[3.52%], Darling Ingredients[3.47%]