
 Login Sign Up


| |||||
 |  | ||||

| 12Stocks.com Market Intelligence |
Best Healthcare Stocks
 | "Discover best trending healthcare stocks with 12Stocks.com." |
| - Subu Vdaygiri, Founder, 12Stocks.com |
| In a hurry? Healthcare Stocks Lists: Performance Trends Table, Stock Charts
Sort Healthcare stocks: Daily, Weekly, Year-to-Date, Market Cap & Trends. Filter Healthcare stocks list by size:All Healthcare Large Mid-Range Small |
| 12Stocks.com Healthcare Stocks Performances & Trends Daily | |||||||||
|
|  The overall Smart Investing & Trading Score is 52 (0-bearish to 100-bullish) which puts Healthcare sector in short term neutral trend. The Smart Investing & Trading Score from previous trading session is 38 and an improvement of trend continues.
| ||||||||
Here are the Smart Investing & Trading Scores of the most requested Healthcare stocks at 12Stocks.com (click stock name for detailed review):
|


| 12Stocks.com: Investing in Healthcare sector with Stocks | |
|
The following table helps investors and traders sort through current performance and trends (as measured by Smart Investing & Trading Score) of various
stocks in the Healthcare sector. Quick View: Move mouse or cursor over stock symbol (ticker) to view short-term Technical chart and over stock name to view long term chart. Click on  to add stock symbol to your watchlist and to add stock symbol to your watchlist and  to view watchlist. Click on any ticker or stock name for detailed market intelligence report for that stock. to view watchlist. Click on any ticker or stock name for detailed market intelligence report for that stock. |
12Stocks.com Performance of Stocks in Healthcare Sector
| Ticker | Stock Name | Watchlist | Category | Recent Price | Smart Investing & Trading Score | Change % | Weekly Change% |
| FOLD | Amicus |   | Biotechnology | 10.54 | 25 | -1.59% | -0.66% |
| CERE | Cerevel | | Biotechnology | 41.87 | 50 | -0.29% | -0.68% |
| BHVN | Biohaven | | Biotechnology | 38.72 | 10 | -2.25% | -0.69% |
| VIGL | Vigil Neuroscience | | Biotechnology | 2.80 | 68 | 5.66% | -0.71% |
| EXAI | Exscientia | | Biotechnology | 4.21 | 10 | -4.10% | -0.71% |
| RAPT | RAPT | | Biotechnology | 7.90 | 10 | -1.25% | -0.75% |
| PSNL | Personalis | | Biotechnology | 1.30 | 22 | -5.80% | -0.76% |
| PCVX | Vaxcyte | | Biotechnology | 60.25 | 25 | -1.03% | -0.76% |
| ARDX | Ardelyx | | Biotechnology | 6.43 | 18 | 0.63% | -0.77% |
| PIII | P3 Health | | Medical Care Facilities | 0.50 | 20 | -3.02% | -0.81% |
| RCEL | Avita | | Equipment | 8.57 | 25 | -4.57% | -0.81% |
| GPCR | Structure | | Biotechnology | 36.05 | 20 | -0.14% | -0.85% |
| GMAB | Genmab A/S | | Biotechnology | 28.47 | 46 | -0.32% | -0.87% |
| APTO | Aptose Biosciences | | Biotechnology | 1.22 | 42 | -0.81% | -0.89% |
| MNPR | Monopar | | Biotechnology | 0.63 | 76 | -3.08% | -0.94% |
| XENE | Xenon | | Biotechnology | 39.50 | 35 | -3.87% | -0.95% |
| USNA | USANA Health | | Pharmaceutical | 43.70 | 17 | -2.35% | -0.97% |
| AURA | Aura Biosciences | | Biotechnology | 7.12 | 43 | -1.66% | -0.97% |
| CDXS | Codexis | | Biotechnology | 2.80 | 63 | -3.45% | -1.06% |
| GLPG | Galapagos NV | | Biotechnology | 28.77 | 20 | -2.31% | -1.07% |
| CYTK | Cytokinetics | | Biotechnology | 66.82 | 10 | 1.91% | -1.08% |
| SCPH | sc | | Biotechnology | 4.50 | 35 | -2.39% | -1.10% |
| MORF | Morphic Holding | | Biotechnology | 27.69 | 18 | -3.69% | -1.11% |
| SDGR | Schrodinger | | Health Information | 24.04 | 18 | -3.10% | -1.11% |
| INCY | yte | | Biotechnology | 51.74 | 10 | 0.17% | -1.17% |
| For chart view version of above stock list: Chart View ➞ 0 - 25 , 25 - 50 , 50 - 75 , 75 - 100 , 100 - 125 , 125 - 150 , 150 - 175 , 175 - 200 , 200 - 225 , 225 - 250 , 250 - 275 , 275 - 300 , 300 - 325 , 325 - 350 , 350 - 375 , 375 - 400 , 400 - 425 , 425 - 450 , 450 - 475 , 475 - 500 , 500 - 525 , 525 - 550 , 550 - 575 , 575 - 600 , 600 - 625 , 625 - 650 , 650 - 675 , 675 - 700 , 700 - 725 | ||
 | Click To Change The Sort Order: By Market Cap or Company Size Performance: Year-to-date, Week and Day |  |
|
Get the most comprehensive stock market coverage daily at 12Stocks.com ➞ Best Stocks Today ➞ Best Stocks Weekly ➞ Best Stocks Year-to-Date ➞ Best Stocks Trends ➞  Best Stocks Today 12Stocks.com Best Nasdaq Stocks ➞ Best S&P 500 Stocks ➞ Best Tech Stocks ➞ Best Biotech Stocks ➞ |
| Detailed Overview of Healthcare Stocks |
| Healthcare Technical Overview, Leaders & Laggards, Top Healthcare ETF Funds & Detailed Healthcare Stocks List, Charts, Trends & More |
| Healthcare Sector: Technical Analysis, Trends & YTD Performance | |
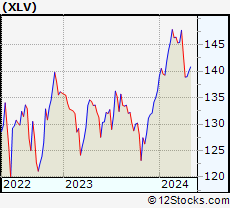
| Healthcare sector is composed of stocks
from pharmaceutical, biotech, diagnostics labs, insurance providers
and healthcare services. Healthcare sector, as represented by XLV, an exchange-traded fund [ETF] that holds basket of Healthcare stocks (e.g, Merck, Amgen) is up by 3.28% and is currently underperforming the overall market by -2.38% year-to-date. Below is a quick view of Technical charts and trends: |
|
 XLV Weekly Chart |
|
| Long Term Trend: Good | |
| Medium Term Trend: Not Good | |
 XLV Daily Chart |
|
| Short Term Trend: Very Good | |
| Overall Trend Score: 52 | |
| YTD Performance: 3.28% | |
| **Trend Scores & Views Are Only For Educational Purposes And Not For Investing | |
| 12Stocks.com: Top Performing Healthcare Sector Stocks | ||||||||||||||||||||||||||||||||||||||||||||||||
 The top performing Healthcare sector stocks year to date are
Now, more recently, over last week, the top performing Healthcare sector stocks on the move are


|
||||||||||||||||||||||||||||||||||||||||||||||||
| 12Stocks.com: Investing in Healthcare Sector using Exchange Traded Funds | |
|
The following table shows list of key exchange traded funds (ETF) that
help investors track Healthcare Index. For detailed view, check out our ETF Funds section of our website. Quick View: Move mouse or cursor over ETF symbol (ticker) to view short-term Technical chart and over ETF name to view long term chart. Click on ticker or stock name for detailed view. Click on to add stock symbol to your watchlist and to view watchlist. |
12Stocks.com List of ETFs that track Healthcare Index
| Ticker | ETF Name | Watchlist | Recent Price | Smart Investing & Trading Score | Change % | Week % | Year-to-date % |
| XLV | Health Care | | 140.86 | 52 | -0.31 | 1.37 | 3.28% |
| XBI | Biotech | | 83.94 | 25 | -0.89 | 1.34 | -5.99% |
| IBB | Biotechnology | | 127.76 | 32 | -0.20 | 2.44 | -5.96% |
| BBH | Biotech | | 157.33 | 49 | 0.03 | 3.26 | -4.83% |
| VHT | Health Care | | 257.26 | 45 | -0.22 | 1.55 | 2.62% |
| IYH | Healthcare | | 59.09 | 45 | -0.20 | 1.6 | 3.22% |
| IHF | Healthcare Providers | | 52.26 | 55 | -0.11 | 0.1 | -0.48% |
| IHI | Medical Devices | | 55.64 | 50 | 0.23 | 2.35 | 3.09% |
| BIB | Biotechnology | | 50.18 | 32 | -0.30 | 4.11 | -12.04% |
| BIS | Short Biotech | | 20.09 | 61 | 0.75 | -3.85 | 11.18% |
| XHE | Health Care Equipment | | 83.21 | 35 | 0.24 | 2.39 | -1.25% |
| CURE | Healthcare Bull 3X | | 107.85 | 32 | -0.25 | 4.37 | 6.01% |
| LABU | Biotech Bull 3X | | 89.40 | 25 | -2.80 | 3.89 | -26.7% |
| LABD | Biotech Bear 3X | | 10.37 | 75 | 2.98 | -3.98 | 7.02% |
| PSCH | SmallCap Health Care | | 41.12 | 41 | -0.23 | 2.35 | -3.92% |
| XHS | Health Care Services | | 88.70 | 53 | -0.06 | 1.85 | -0.28% |
| PTH | DWA Healthcare Momentum | | 39.63 | 46 | -1.34 | 0.25 | 1.25% |
| BTEC | Principal Healthcare Innovators | | 34.20 | 18 | -1.73 | 1.02 | -5.85% |
| RXL | Health Care | | 96.00 | 45 | -0.15 | 2.99 | 5.03% |
| RXD | Short Health Care | | 11.34 | 45 | 0.88 | -2.54 | -4.87% |
| 12Stocks.com: Charts, Trends, Fundamental Data and Performances of Healthcare Stocks | |
|
We now take in-depth look at all Healthcare stocks including charts, multi-period performances and overall trends (as measured by Smart Investing & Trading Score). One can sort Healthcare stocks (click link to choose) by Daily, Weekly and by Year-to-Date performances. Also, one can sort by size of the company or by market capitalization. |
| Select Your Default Chart Type: | |||||
| |||||
| Click on stock symbol or name for detailed view. Click on to add stock symbol to your watchlist and to view watchlist. Quick View: Move mouse or cursor over "Daily" to quickly view daily Technical stock chart and over "Weekly" to view weekly Technical stock chart. | |||||

 | FOLD Amicus Therapeutics, Inc. |
| Sector: Health Care | |
| SubSector: Biotechnology | |
| MarketCap: 2676.75 Millions | |
| Recent Price: 10.54 Smart Investing & Trading Score: 25 | |
| Day Percent Change: -1.59% Day Change: -0.17 | |
| Week Change: -0.66% Year-to-date Change: -25.7% | |
| FOLD Links: Profile News Message Board | |
| Charts:- Daily , Weekly | |
| Add FOLD to Watchlist: View: Get Complete FOLD Trend Analysis ➞ | |
 | CERE Cerevel Therapeutics Holdings, Inc. |
| Sector: Health Care | |
| SubSector: Biotechnology | |
| MarketCap: 21587 Millions | |
| Recent Price: 41.87 Smart Investing & Trading Score: 50 | |
| Day Percent Change: -0.29% Day Change: -0.12 | |
| Week Change: -0.68% Year-to-date Change: -1.2% | |
| CERE Links: Profile News Message Board | |
| Charts:- Daily , Weekly | |
| Add CERE to Watchlist: View: Get Complete CERE Trend Analysis ➞ | |
 | BHVN Biohaven Pharmaceutical Holding Company Ltd. |
| Sector: Health Care | |
| SubSector: Biotechnology | |
| MarketCap: 2024.25 Millions | |
| Recent Price: 38.72 Smart Investing & Trading Score: 10 | |
| Day Percent Change: -2.25% Day Change: -0.89 | |
| Week Change: -0.69% Year-to-date Change: -9.5% | |
| BHVN Links: Profile News Message Board | |
| Charts:- Daily , Weekly | |
| Add BHVN to Watchlist: View: Get Complete BHVN Trend Analysis ➞ | |
 | VIGL Vigil Neuroscience, Inc. |
| Sector: Health Care | |
| SubSector: Biotechnology | |
| MarketCap: 339 Millions | |
| Recent Price: 2.80 Smart Investing & Trading Score: 68 | |
| Day Percent Change: 5.66% Day Change: 0.15 | |
| Week Change: -0.71% Year-to-date Change: -18.4% | |
| VIGL Links: Profile News Message Board | |
| Charts:- Daily , Weekly | |
| Add VIGL to Watchlist: View: Get Complete VIGL Trend Analysis ➞ | |
 | EXAI Exscientia plc |
| Sector: Health Care | |
| SubSector: Biotechnology | |
| MarketCap: 796 Millions | |
| Recent Price: 4.21 Smart Investing & Trading Score: 10 | |
| Day Percent Change: -4.10% Day Change: -0.18 | |
| Week Change: -0.71% Year-to-date Change: -34.9% | |
| EXAI Links: Profile News Message Board | |
| Charts:- Daily , Weekly | |
| Add EXAI to Watchlist: View: Get Complete EXAI Trend Analysis ➞ | |
 | RAPT RAPT Therapeutics, Inc. |
| Sector: Health Care | |
| SubSector: Biotechnology | |
| MarketCap: 368.785 Millions | |
| Recent Price: 7.90 Smart Investing & Trading Score: 10 | |
| Day Percent Change: -1.25% Day Change: -0.10 | |
| Week Change: -0.75% Year-to-date Change: -68.2% | |
| RAPT Links: Profile News Message Board | |
| Charts:- Daily , Weekly | |
| Add RAPT to Watchlist: View: Get Complete RAPT Trend Analysis ➞ | |
 | PSNL Personalis, Inc. |
| Sector: Health Care | |
| SubSector: Biotechnology | |
| MarketCap: 242.385 Millions | |
| Recent Price: 1.30 Smart Investing & Trading Score: 22 | |
| Day Percent Change: -5.80% Day Change: -0.08 | |
| Week Change: -0.76% Year-to-date Change: -38.1% | |
| PSNL Links: Profile News Message Board | |
| Charts:- Daily , Weekly | |
| Add PSNL to Watchlist: View: Get Complete PSNL Trend Analysis ➞ | |
 | PCVX Vaxcyte, Inc. |
| Sector: Health Care | |
| SubSector: Biotechnology | |
| MarketCap: 13887 Millions | |
| Recent Price: 60.25 Smart Investing & Trading Score: 25 | |
| Day Percent Change: -1.03% Day Change: -0.63 | |
| Week Change: -0.76% Year-to-date Change: -4.0% | |
| PCVX Links: Profile News Message Board | |
| Charts:- Daily , Weekly | |
| Add PCVX to Watchlist: View: Get Complete PCVX Trend Analysis ➞ | |
 | ARDX Ardelyx, Inc. |
| Sector: Health Care | |
| SubSector: Biotechnology | |
| MarketCap: 541.985 Millions | |
| Recent Price: 6.43 Smart Investing & Trading Score: 18 | |
| Day Percent Change: 0.63% Day Change: 0.04 | |
| Week Change: -0.77% Year-to-date Change: 3.7% | |
| ARDX Links: Profile News Message Board | |
| Charts:- Daily , Weekly | |
| Add ARDX to Watchlist: View: Get Complete ARDX Trend Analysis ➞ | |
 | PIII P3 Health Partners Inc. |
| Sector: Health Care | |
| SubSector: Medical Care Facilities | |
| MarketCap: 944 Millions | |
| Recent Price: 0.50 Smart Investing & Trading Score: 20 | |
| Day Percent Change: -3.02% Day Change: -0.02 | |
| Week Change: -0.81% Year-to-date Change: -66.1% | |
| PIII Links: Profile News Message Board | |
| Charts:- Daily , Weekly | |
| Add PIII to Watchlist: View: Get Complete PIII Trend Analysis ➞ | |
 | RCEL Avita Medical Limited |
| Sector: Health Care | |
| SubSector: Medical Appliances & Equipment | |
| MarketCap: 481.18 Millions | |
| Recent Price: 8.57 Smart Investing & Trading Score: 25 | |
| Day Percent Change: -4.57% Day Change: -0.41 | |
| Week Change: -0.81% Year-to-date Change: -37.5% | |
| RCEL Links: Profile News Message Board | |
| Charts:- Daily , Weekly | |
| Add RCEL to Watchlist: View: Get Complete RCEL Trend Analysis ➞ | |
 | GPCR Structure Therapeutics Inc. |
| Sector: Health Care | |
| SubSector: Biotechnology | |
| MarketCap: 1530 Millions | |
| Recent Price: 36.05 Smart Investing & Trading Score: 20 | |
| Day Percent Change: -0.14% Day Change: -0.05 | |
| Week Change: -0.85% Year-to-date Change: -5.3% | |
| GPCR Links: Profile News Message Board | |
| Charts:- Daily , Weekly | |
| Add GPCR to Watchlist: View: Get Complete GPCR Trend Analysis ➞ | |
 | GMAB Genmab A/S |
| Sector: Health Care | |
| SubSector: Biotechnology | |
| MarketCap: 12482.3 Millions | |
| Recent Price: 28.47 Smart Investing & Trading Score: 46 | |
| Day Percent Change: -0.32% Day Change: -0.09 | |
| Week Change: -0.87% Year-to-date Change: -10.6% | |
| GMAB Links: Profile News Message Board | |
| Charts:- Daily , Weekly | |
| Add GMAB to Watchlist: View: Get Complete GMAB Trend Analysis ➞ | |
 | APTO Aptose Biosciences Inc. |
| Sector: Health Care | |
| SubSector: Biotechnology | |
| MarketCap: 484.585 Millions | |
| Recent Price: 1.22 Smart Investing & Trading Score: 42 | |
| Day Percent Change: -0.81% Day Change: -0.01 | |
| Week Change: -0.89% Year-to-date Change: -52.0% | |
| APTO Links: Profile News Message Board | |
| Charts:- Daily , Weekly | |
| Add APTO to Watchlist: View: Get Complete APTO Trend Analysis ➞ | |
 | MNPR Monopar Therapeutics Inc. |
| Sector: Health Care | |
| SubSector: Biotechnology | |
| MarketCap: 71487 Millions | |
| Recent Price: 0.63 Smart Investing & Trading Score: 76 | |
| Day Percent Change: -3.08% Day Change: -0.02 | |
| Week Change: -0.94% Year-to-date Change: 83.1% | |
| MNPR Links: Profile News Message Board | |
| Charts:- Daily , Weekly | |
| Add MNPR to Watchlist: View: Get Complete MNPR Trend Analysis ➞ | |
 | XENE Xenon Pharmaceuticals Inc. |
| Sector: Health Care | |
| SubSector: Biotechnology | |
| MarketCap: 388.585 Millions | |
| Recent Price: 39.50 Smart Investing & Trading Score: 35 | |
| Day Percent Change: -3.87% Day Change: -1.59 | |
| Week Change: -0.95% Year-to-date Change: -14.2% | |
| XENE Links: Profile News Message Board | |
| Charts:- Daily , Weekly | |
| Add XENE to Watchlist: View: Get Complete XENE Trend Analysis ➞ | |
 | USNA USANA Health Sciences, Inc. |
| Sector: Health Care | |
| SubSector: Drug Related Products | |
| MarketCap: 1185.13 Millions | |
| Recent Price: 43.70 Smart Investing & Trading Score: 17 | |
| Day Percent Change: -2.35% Day Change: -1.05 | |
| Week Change: -0.97% Year-to-date Change: -18.5% | |
| USNA Links: Profile News Message Board | |
| Charts:- Daily , Weekly | |
| Add USNA to Watchlist: View: Get Complete USNA Trend Analysis ➞ | |
 | AURA Aura Biosciences, Inc. |
| Sector: Health Care | |
| SubSector: Biotechnology | |
| MarketCap: 469 Millions | |
| Recent Price: 7.12 Smart Investing & Trading Score: 43 | |
| Day Percent Change: -1.66% Day Change: -0.12 | |
| Week Change: -0.97% Year-to-date Change: -19.6% | |
| AURA Links: Profile News Message Board | |
| Charts:- Daily , Weekly | |
| Add AURA to Watchlist: View: Get Complete AURA Trend Analysis ➞ | |
 | CDXS Codexis, Inc. |
| Sector: Health Care | |
| SubSector: Biotechnology | |
| MarketCap: 592.185 Millions | |
| Recent Price: 2.80 Smart Investing & Trading Score: 63 | |
| Day Percent Change: -3.45% Day Change: -0.10 | |
| Week Change: -1.06% Year-to-date Change: -8.2% | |
| CDXS Links: Profile News Message Board | |
| Charts:- Daily , Weekly | |
| Add CDXS to Watchlist: View: Get Complete CDXS Trend Analysis ➞ | |
 | GLPG Galapagos NV |
| Sector: Health Care | |
| SubSector: Biotechnology | |
| MarketCap: 9541.55 Millions | |
| Recent Price: 28.77 Smart Investing & Trading Score: 20 | |
| Day Percent Change: -2.31% Day Change: -0.68 | |
| Week Change: -1.07% Year-to-date Change: -29.2% | |
| GLPG Links: Profile News Message Board | |
| Charts:- Daily , Weekly | |
| Add GLPG to Watchlist: View: Get Complete GLPG Trend Analysis ➞ | |
 | CYTK Cytokinetics, Incorporated |
| Sector: Health Care | |
| SubSector: Biotechnology | |
| MarketCap: 654.285 Millions | |
| Recent Price: 66.82 Smart Investing & Trading Score: 10 | |
| Day Percent Change: 1.91% Day Change: 1.25 | |
| Week Change: -1.08% Year-to-date Change: -20.0% | |
| CYTK Links: Profile News Message Board | |
| Charts:- Daily , Weekly | |
| Add CYTK to Watchlist: View: Get Complete CYTK Trend Analysis ➞ | |
 | SCPH scPharmaceuticals Inc. |
| Sector: Health Care | |
| SubSector: Biotechnology | |
| MarketCap: 136.185 Millions | |
| Recent Price: 4.50 Smart Investing & Trading Score: 35 | |
| Day Percent Change: -2.39% Day Change: -0.11 | |
| Week Change: -1.1% Year-to-date Change: -28.2% | |
| SCPH Links: Profile News Message Board | |
| Charts:- Daily , Weekly | |
| Add SCPH to Watchlist: View: Get Complete SCPH Trend Analysis ➞ | |
 | MORF Morphic Holding, Inc. |
| Sector: Health Care | |
| SubSector: Biotechnology | |
| MarketCap: 484.885 Millions | |
| Recent Price: 27.69 Smart Investing & Trading Score: 18 | |
| Day Percent Change: -3.69% Day Change: -1.06 | |
| Week Change: -1.11% Year-to-date Change: -4.1% | |
| MORF Links: Profile News Message Board | |
| Charts:- Daily , Weekly | |
| Add MORF to Watchlist: View: Get Complete MORF Trend Analysis ➞ | |
 | SDGR Schrodinger, Inc. |
| Sector: Health Care | |
| SubSector: Health Information Services | |
| MarketCap: 47287 Millions | |
| Recent Price: 24.04 Smart Investing & Trading Score: 18 | |
| Day Percent Change: -3.10% Day Change: -0.77 | |
| Week Change: -1.11% Year-to-date Change: -32.9% | |
| SDGR Links: Profile News Message Board | |
| Charts:- Daily , Weekly | |
| Add SDGR to Watchlist: View: Get Complete SDGR Trend Analysis ➞ | |
 | INCY Incyte Corporation |
| Sector: Health Care | |
| SubSector: Biotechnology | |
| MarketCap: 15343.2 Millions | |
| Recent Price: 51.74 Smart Investing & Trading Score: 10 | |
| Day Percent Change: 0.17% Day Change: 0.09 | |
| Week Change: -1.17% Year-to-date Change: -17.6% | |
| INCY Links: Profile News Message Board | |
| Charts:- Daily , Weekly | |
| Add INCY to Watchlist: View: Get Complete INCY Trend Analysis ➞ | |
| For tabular summary view of above stock list: Summary View ➞ 0 - 25 , 25 - 50 , 50 - 75 , 75 - 100 , 100 - 125 , 125 - 150 , 150 - 175 , 175 - 200 , 200 - 225 , 225 - 250 , 250 - 275 , 275 - 300 , 300 - 325 , 325 - 350 , 350 - 375 , 375 - 400 , 400 - 425 , 425 - 450 , 450 - 475 , 475 - 500 , 500 - 525 , 525 - 550 , 550 - 575 , 575 - 600 , 600 - 625 , 625 - 650 , 650 - 675 , 675 - 700 , 700 - 725 | ||
| Click To Change The Sort Order: By Market Cap or Company Size Performance: Year-to-date, Week and Day | |
| Select Chart Type: | ||
|
Best Stocks Today 12Stocks.com |
© 2024 12Stocks.com Terms & Conditions Privacy Contact Us
All Information Provided Only For Education And Not To Be Used For Investing or Trading. See Terms & Conditions


One More Thing ... Get Best Stocks Delivered Daily!
Never Ever Miss A Move With Our Top Ten Stocks Lists
Find Best Stocks In Any Market - Bull or Bear Market
Take A Peek At Our Top Ten Stocks Lists: Daily, Weekly, Year-to-Date & Top Trends
Find Best Stocks In Any Market - Bull or Bear Market
Take A Peek At Our Top Ten Stocks Lists: Daily, Weekly, Year-to-Date & Top Trends
Healthcare Stocks With Best Up Trends [0-bearish to 100-bullish]: Annovis Bio[100], Boston Scientific[100], Integer [100], Haemonetics [100], Quest Diagnostics[100], AstraZeneca [100], Oscar Health[100], PureTech Health[100], Glaukos [100], Agios [100], Pieris [100]
Best Healthcare Stocks Year-to-Date:
Pieris [6427.47%], Precision BioSciences[2590.41%], Inovio [1892.16%], Assembly Biosciences[1543.7%], Aurora Cannabis[1411.97%], Adverum Biotechnologies[1253.61%], NuCana [1198.17%], Agenus [796.24%], Affimed N.V[680.8%], CareMax [574.23%], Corbus [488.41%] Best Healthcare Stocks This Week:
Pieris [8093.1%], Aesthetic [53.58%], Agenus [39.74%], BeyondSpring [35%], Seres [30.29%], VolitionRx [29.87%], Annovis Bio[27.4%], CareMax [27.24%], ProKidney [23.28%], GeneDx [22.61%], Cullinan Oncology[20.69%] Best Healthcare Stocks Daily:
Aesthetic [44.75%], Agenus [14.86%], Apyx [13.64%], Cullinan Oncology[13.55%], Amneal [12.04%], HOOKIPA Pharma[11.11%], Gritstone Oncology[10.06%], DURECT [9.75%], Sage [8.11%], Relay [7.46%], Annovis Bio[7.24%]