
 Login Sign Up


| |||||
 |  | ||||

| 12Stocks.com Market Intelligence |
Best Healthcare Stocks
 | "Discover best trending healthcare stocks with 12Stocks.com." |
| - Subu Vdaygiri, Founder, 12Stocks.com |
| In a hurry? Healthcare Stocks Lists: Performance Trends Table, Stock Charts
Sort Healthcare stocks: Daily, Weekly, Year-to-Date, Market Cap & Trends. Filter Healthcare stocks list by size:All Healthcare Large Mid-Range Small |
| 12Stocks.com Healthcare Stocks Performances & Trends Daily | |||||||||
|
|  The overall Smart Investing & Trading Score is 38 (0-bearish to 100-bullish) which puts Healthcare sector in short term bearish to neutral trend. The Smart Investing & Trading Score from previous trading session is 52 and hence a deterioration of trend.
| ||||||||
Here are the Smart Investing & Trading Scores of the most requested Healthcare stocks at 12Stocks.com (click stock name for detailed review):
|


| 12Stocks.com: Investing in Healthcare sector with Stocks | |
|
The following table helps investors and traders sort through current performance and trends (as measured by Smart Investing & Trading Score) of various
stocks in the Healthcare sector. Quick View: Move mouse or cursor over stock symbol (ticker) to view short-term Technical chart and over stock name to view long term chart. Click on  to add stock symbol to your watchlist and to add stock symbol to your watchlist and  to view watchlist. Click on any ticker or stock name for detailed market intelligence report for that stock. to view watchlist. Click on any ticker or stock name for detailed market intelligence report for that stock. |
12Stocks.com Performance of Stocks in Healthcare Sector
| Ticker | Stock Name | Watchlist | Category | Recent Price | Smart Investing & Trading Score | Change % | YTD Change% |
| GERN | Geron |   | Biotechnology | 3.55 | 68 | -0.84% | 68.25% |
| RLYB | Rallybio | | Biotechnology | 1.60 | 43 | 0.63% | -32.20% |
| MASS | 908 Devices | | Medical Devices | 5.62 | 25 | 0.36% | -49.82% |
| ABEO | Abeona | | Biotechnology | 3.16 | 0 | -0.32% | -36.93% |
| MRSN | Mersana | | Biotechnology | 2.75 | 10 | -4.34% | 18.75% |
| VOR | Vor Biopharma | | Biotechnology | 1.67 | 30 | -4.30% | -24.77% |
| NERV | Minerva Neurosciences | | Biotechnology | 2.52 | 30 | 0.00% | -59.02% |
| FLGT | Fulgent Genetics | | Laboratories | 20.40 | 45 | -1.64% | -29.44% |
| CABA | Cabaletta Bio | | Biotechnology | 11.98 | 18 | -7.56% | -47.22% |
| MCRB | Seres | | Biotechnology | 0.75 | 59 | 3.08% | -46.29% |
| XOMAO | XOMA | | Biotechnology | 25.00 | 35 | 0.00% | 0.04% |
| PEPG | PepGen | | Biotechnology | 11.83 | 68 | 1.11% | 72.95% |
| MOLN | Molecular Partners | | Biotechnology | 3.61 | 40 | -6.96% | -10.09% |
| BCYC | Bicycle | | Biotechnology | 22.24 | 54 | -1.90% | 23.01% |
| TALK | Talkspace | | Health Information | 3.00 | 36 | -1.96% | 18.31% |
| AIH | Aesthetic | | Specialized | 0.46 | 54 | -20.90% | -33.58% |
| RFL | Rafael | | Biotechnology | 1.75 | 40 | 2.05% | -4.64% |
| CDMO | Avid Bioservices | | Biotechnology | 7.01 | 75 | 2.64% | 7.85% |
| OCEA | Ocean Bio | | Biotechnology | 1.42 | 46 | 0.00% | 112.69% |
| RANI | Rani | | Biotechnology | 6.99 | 68 | 1.75% | 111.82% |
| AUGX | Augmedix | | Health Information | 2.67 | 10 | -5.99% | -54.20% |
| ABOS | Acumen | | Biotechnology | 3.09 | 25 | -2.52% | -19.53% |
| VERU | Veru | | Pharmaceutical | 1.25 | 71 | -5.30% | 73.61% |
| SLN | Silence | | Biotechnology | 21.64 | 38 | -3.09% | 23.27% |
| STRO | Sutro Biopharma | | Biotechnology | 3.35 | 20 | -3.60% | -22.03% |
| For chart view version of above stock list: Chart View ➞ 0 - 25 , 25 - 50 , 50 - 75 , 75 - 100 , 100 - 125 , 125 - 150 , 150 - 175 , 175 - 200 , 200 - 225 , 225 - 250 , 250 - 275 , 275 - 300 , 300 - 325 , 325 - 350 , 350 - 375 , 375 - 400 , 400 - 425 , 425 - 450 , 450 - 475 , 475 - 500 , 500 - 525 , 525 - 550 , 550 - 575 , 575 - 600 , 600 - 625 , 625 - 650 | ||
 | Click To Change The Sort Order: By Market Cap or Company Size Performance: Year-to-date, Week and Day |  |
|
Get the most comprehensive stock market coverage daily at 12Stocks.com ➞ Best Stocks Today ➞ Best Stocks Weekly ➞ Best Stocks Year-to-Date ➞ Best Stocks Trends ➞  Best Stocks Today 12Stocks.com Best Nasdaq Stocks ➞ Best S&P 500 Stocks ➞ Best Tech Stocks ➞ Best Biotech Stocks ➞ |
| Detailed Overview of Healthcare Stocks |
| Healthcare Technical Overview, Leaders & Laggards, Top Healthcare ETF Funds & Detailed Healthcare Stocks List, Charts, Trends & More |
| Healthcare Sector: Technical Analysis, Trends & YTD Performance | |
| Healthcare sector is composed of stocks
from pharmaceutical, biotech, diagnostics labs, insurance providers
and healthcare services. Healthcare sector, as represented by XLV, an exchange-traded fund [ETF] that holds basket of Healthcare stocks (e.g, Merck, Amgen) is up by 2.63% and is currently underperforming the overall market by -1.29% year-to-date. Below is a quick view of Technical charts and trends: |
|
 XLV Weekly Chart |
|
| Long Term Trend: Not Good | |
| Medium Term Trend: Not Good | |
 XLV Daily Chart |
|
| Short Term Trend: Very Good | |
| Overall Trend Score: 38 | |
| YTD Performance: 2.63% | |
| **Trend Scores & Views Are Only For Educational Purposes And Not For Investing | |
| 12Stocks.com: Top Performing Healthcare Sector Stocks | ||||||||||||||||||||||||||||||||||||||||||||||||
 The top performing Healthcare sector stocks year to date are
Now, more recently, over last week, the top performing Healthcare sector stocks on the move are


|
||||||||||||||||||||||||||||||||||||||||||||||||
| 12Stocks.com: Investing in Healthcare Sector using Exchange Traded Funds | |
|
The following table shows list of key exchange traded funds (ETF) that
help investors track Healthcare Index. For detailed view, check out our ETF Funds section of our website. Quick View: Move mouse or cursor over ETF symbol (ticker) to view short-term Technical chart and over ETF name to view long term chart. Click on ticker or stock name for detailed view. Click on to add stock symbol to your watchlist and to view watchlist. |
12Stocks.com List of ETFs that track Healthcare Index
| Ticker | ETF Name | Watchlist | Recent Price | Smart Investing & Trading Score | Change % | Week % | Year-to-date % |
| XLV | Health Care | | 139.97 | 38 | -0.63 | 0.73 | 2.63% |
| IBB | Biotechnology | | 125.12 | 10 | -2.07 | 0.32 | -7.9% |
| BBH | Biotech | | 157.33 | 49 | 0.00 | 3.26 | -4.83% |
| IHF | Healthcare Providers | | 52.08 | 43 | -0.34 | -0.25 | -0.82% |
| PSCH | SmallCap Health Care | | 41.08 | 35 | -0.10 | 2.24 | -4.02% |
| XHS | Health Care Services | | 87.93 | 68 | -0.87 | 0.97 | -1.15% |
| PTH | DWA Healthcare Momentum | | 39.60 | 46 | -0.08 | 0.18 | 1.18% |
| BTEC | Principal Healthcare Innovators | | 34.21 | 32 | 0.02 | 1.04 | -5.83% |
| RXL | Health Care | | 95.94 | 38 | -0.07 | 2.91 | 4.96% |
| RXD | Short Health Care | | 11.37 | 45 | 0.19 | -2.36 | -4.7% |
| 12Stocks.com: Charts, Trends, Fundamental Data and Performances of Healthcare Stocks | |
|
We now take in-depth look at all Healthcare stocks including charts, multi-period performances and overall trends (as measured by Smart Investing & Trading Score). One can sort Healthcare stocks (click link to choose) by Daily, Weekly and by Year-to-Date performances. Also, one can sort by size of the company or by market capitalization. |
| Select Your Default Chart Type: | |||||
| |||||
| Click on stock symbol or name for detailed view. Click on to add stock symbol to your watchlist and to view watchlist. Quick View: Move mouse or cursor over "Daily" to quickly view daily Technical stock chart and over "Weekly" to view weekly Technical stock chart. | |||||

 | GERN Geron Corporation |
| Sector: Health Care | |
| SubSector: Biotechnology | |
| MarketCap: 228.685 Millions | |
| Recent Price: 3.55 Smart Investing & Trading Score: 68 | |
| Day Percent Change: -0.84% Day Change: -0.03 | |
| Week Change: -3.79% Year-to-date Change: 68.3% | |
| GERN Links: Profile News Message Board | |
| Charts:- Daily , Weekly | |
| Add GERN to Watchlist: View: Get Complete GERN Trend Analysis ➞ | |
 | RLYB Rallybio Corporation |
| Sector: Health Care | |
| SubSector: Biotechnology | |
| MarketCap: 226 Millions | |
| Recent Price: 1.60 Smart Investing & Trading Score: 43 | |
| Day Percent Change: 0.63% Day Change: 0.01 | |
| Week Change: -9.09% Year-to-date Change: -32.2% | |
| RLYB Links: Profile News Message Board | |
| Charts:- Daily , Weekly | |
| Add RLYB to Watchlist: View: Get Complete RLYB Trend Analysis ➞ | |
 | MASS 908 Devices Inc. |
| Sector: Health Care | |
| SubSector: Medical Devices | |
| MarketCap: 225 Millions | |
| Recent Price: 5.62 Smart Investing & Trading Score: 25 | |
| Day Percent Change: 0.36% Day Change: 0.02 | |
| Week Change: 0.72% Year-to-date Change: -49.8% | |
| MASS Links: Profile News Message Board | |
| Charts:- Daily , Weekly | |
| Add MASS to Watchlist: View: Get Complete MASS Trend Analysis ➞ | |
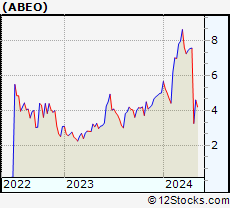 | ABEO Abeona Therapeutics Inc. |
| Sector: Health Care | |
| SubSector: Biotechnology | |
| MarketCap: 224.985 Millions | |
| Recent Price: 3.16 Smart Investing & Trading Score: 0 | |
| Day Percent Change: -0.32% Day Change: -0.01 | |
| Week Change: -58.26% Year-to-date Change: -36.9% | |
| ABEO Links: Profile News Message Board | |
| Charts:- Daily , Weekly | |
| Add ABEO to Watchlist: View: Get Complete ABEO Trend Analysis ➞ | |
 | MRSN Mersana Therapeutics, Inc. |
| Sector: Health Care | |
| SubSector: Biotechnology | |
| MarketCap: 224.385 Millions | |
| Recent Price: 2.75 Smart Investing & Trading Score: 10 | |
| Day Percent Change: -4.34% Day Change: -0.13 | |
| Week Change: -15.36% Year-to-date Change: 18.8% | |
| MRSN Links: Profile News Message Board | |
| Charts:- Daily , Weekly | |
| Add MRSN to Watchlist: View: Get Complete MRSN Trend Analysis ➞ | |
 | VOR Vor Biopharma Inc. |
| Sector: Health Care | |
| SubSector: Biotechnology | |
| MarketCap: 224 Millions | |
| Recent Price: 1.67 Smart Investing & Trading Score: 30 | |
| Day Percent Change: -4.30% Day Change: -0.08 | |
| Week Change: -2.34% Year-to-date Change: -24.8% | |
| VOR Links: Profile News Message Board | |
| Charts:- Daily , Weekly | |
| Add VOR to Watchlist: View: Get Complete VOR Trend Analysis ➞ | |
 | NERV Minerva Neurosciences, Inc. |
| Sector: Health Care | |
| SubSector: Biotechnology | |
| MarketCap: 223.385 Millions | |
| Recent Price: 2.52 Smart Investing & Trading Score: 30 | |
| Day Percent Change: 0.00% Day Change: 0.00 | |
| Week Change: 1.61% Year-to-date Change: -59.0% | |
| NERV Links: Profile News Message Board | |
| Charts:- Daily , Weekly | |
| Add NERV to Watchlist: View: Get Complete NERV Trend Analysis ➞ | |
 | FLGT Fulgent Genetics, Inc. |
| Sector: Health Care | |
| SubSector: Medical Laboratories & Research | |
| MarketCap: 222.2 Millions | |
| Recent Price: 20.40 Smart Investing & Trading Score: 45 | |
| Day Percent Change: -1.64% Day Change: -0.34 | |
| Week Change: 0.29% Year-to-date Change: -29.4% | |
| FLGT Links: Profile News Message Board | |
| Charts:- Daily , Weekly | |
| Add FLGT to Watchlist: View: Get Complete FLGT Trend Analysis ➞ | |
 | CABA Cabaletta Bio, Inc. |
| Sector: Health Care | |
| SubSector: Biotechnology | |
| MarketCap: 222.085 Millions | |
| Recent Price: 11.98 Smart Investing & Trading Score: 18 | |
| Day Percent Change: -7.56% Day Change: -0.98 | |
| Week Change: -9.99% Year-to-date Change: -47.2% | |
| CABA Links: Profile News Message Board | |
| Charts:- Daily , Weekly | |
| Add CABA to Watchlist: View: Get Complete CABA Trend Analysis ➞ | |
 | MCRB Seres Therapeutics, Inc. |
| Sector: Health Care | |
| SubSector: Biotechnology | |
| MarketCap: 217.585 Millions | |
| Recent Price: 0.75 Smart Investing & Trading Score: 59 | |
| Day Percent Change: 3.08% Day Change: 0.02 | |
| Week Change: 34.31% Year-to-date Change: -46.3% | |
| MCRB Links: Profile News Message Board | |
| Charts:- Daily , Weekly | |
| Add MCRB to Watchlist: View: Get Complete MCRB Trend Analysis ➞ | |
 | XOMAO XOMA Corporation |
| Sector: Health Care | |
| SubSector: Biotechnology | |
| MarketCap: 217 Millions | |
| Recent Price: 25.00 Smart Investing & Trading Score: 35 | |
| Day Percent Change: 0.00% Day Change: 0.00 | |
| Week Change: -0.36% Year-to-date Change: 0.0% | |
| XOMAO Links: Profile News Message Board | |
| Charts:- Daily , Weekly | |
| Add XOMAO to Watchlist: View: Get Complete XOMAO Trend Analysis ➞ | |
 | PEPG PepGen Inc. |
| Sector: Health Care | |
| SubSector: Biotechnology | |
| MarketCap: 216 Millions | |
| Recent Price: 11.83 Smart Investing & Trading Score: 68 | |
| Day Percent Change: 1.11% Day Change: 0.13 | |
| Week Change: 12.29% Year-to-date Change: 73.0% | |
| PEPG Links: Profile News Message Board | |
| Charts:- Daily , Weekly | |
| Add PEPG to Watchlist: View: Get Complete PEPG Trend Analysis ➞ | |
 | MOLN Molecular Partners AG |
| Sector: Health Care | |
| SubSector: Biotechnology | |
| MarketCap: 216 Millions | |
| Recent Price: 3.61 Smart Investing & Trading Score: 40 | |
| Day Percent Change: -6.96% Day Change: -0.27 | |
| Week Change: 8.73% Year-to-date Change: -10.1% | |
| MOLN Links: Profile News Message Board | |
| Charts:- Daily , Weekly | |
| Add MOLN to Watchlist: View: Get Complete MOLN Trend Analysis ➞ | |
 | BCYC Bicycle Therapeutics plc |
| Sector: Health Care | |
| SubSector: Biotechnology | |
| MarketCap: 214.485 Millions | |
| Recent Price: 22.24 Smart Investing & Trading Score: 54 | |
| Day Percent Change: -1.90% Day Change: -0.43 | |
| Week Change: -5% Year-to-date Change: 23.0% | |
| BCYC Links: Profile News Message Board | |
| Charts:- Daily , Weekly | |
| Add BCYC to Watchlist: View: Get Complete BCYC Trend Analysis ➞ | |
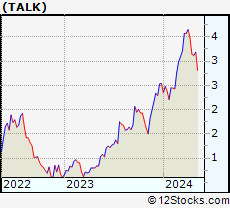 | TALK Talkspace, Inc. |
| Sector: Health Care | |
| SubSector: Health Information Services | |
| MarketCap: 209 Millions | |
| Recent Price: 3.00 Smart Investing & Trading Score: 36 | |
| Day Percent Change: -1.96% Day Change: -0.06 | |
| Week Change: -4.3% Year-to-date Change: 18.3% | |
| TALK Links: Profile News Message Board | |
| Charts:- Daily , Weekly | |
| Add TALK to Watchlist: View: Get Complete TALK Trend Analysis ➞ | |
 | AIH Aesthetic Medical International Holdings Group Limited |
| Sector: Health Care | |
| SubSector: Specialized Health Services | |
| MarketCap: 205.356 Millions | |
| Recent Price: 0.46 Smart Investing & Trading Score: 54 | |
| Day Percent Change: -20.90% Day Change: -0.12 | |
| Week Change: 21.49% Year-to-date Change: -33.6% | |
| AIH Links: Profile News Message Board | |
| Charts:- Daily , Weekly | |
| Add AIH to Watchlist: View: Get Complete AIH Trend Analysis ➞ | |
 | RFL Rafael Holdings, Inc. |
| Sector: Health Care | |
| SubSector: Biotechnology | |
| MarketCap: 203.685 Millions | |
| Recent Price: 1.75 Smart Investing & Trading Score: 40 | |
| Day Percent Change: 2.05% Day Change: 0.04 | |
| Week Change: -0.85% Year-to-date Change: -4.6% | |
| RFL Links: Profile News Message Board | |
| Charts:- Daily , Weekly | |
| Add RFL to Watchlist: View: Get Complete RFL Trend Analysis ➞ | |
 | CDMO Avid Bioservices, Inc. |
| Sector: Health Care | |
| SubSector: Biotechnology | |
| MarketCap: 203.685 Millions | |
| Recent Price: 7.01 Smart Investing & Trading Score: 75 | |
| Day Percent Change: 2.64% Day Change: 0.18 | |
| Week Change: 9.36% Year-to-date Change: 7.9% | |
| CDMO Links: Profile News Message Board | |
| Charts:- Daily , Weekly | |
| Add CDMO to Watchlist: View: Get Complete CDMO Trend Analysis ➞ | |
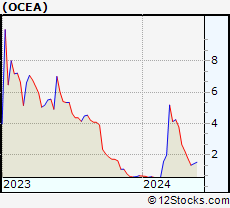 | OCEA Ocean Biomedical, Inc. |
| Sector: Health Care | |
| SubSector: Biotechnology | |
| MarketCap: 203 Millions | |
| Recent Price: 1.42 Smart Investing & Trading Score: 46 | |
| Day Percent Change: 0.00% Day Change: 0.00 | |
| Week Change: -19.6% Year-to-date Change: 112.7% | |
| OCEA Links: Profile News Message Board | |
| Charts:- Daily , Weekly | |
| Add OCEA to Watchlist: View: Get Complete OCEA Trend Analysis ➞ | |
 | RANI Rani Therapeutics Holdings, Inc. |
| Sector: Health Care | |
| SubSector: Biotechnology | |
| MarketCap: 202 Millions | |
| Recent Price: 6.99 Smart Investing & Trading Score: 68 | |
| Day Percent Change: 1.75% Day Change: 0.12 | |
| Week Change: -1.13% Year-to-date Change: 111.8% | |
| RANI Links: Profile News Message Board | |
| Charts:- Daily , Weekly | |
| Add RANI to Watchlist: View: Get Complete RANI Trend Analysis ➞ | |
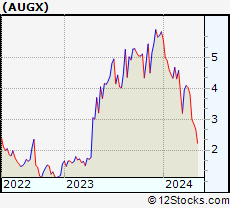 | AUGX Augmedix, Inc. |
| Sector: Health Care | |
| SubSector: Health Information Services | |
| MarketCap: 202 Millions | |
| Recent Price: 2.67 Smart Investing & Trading Score: 10 | |
| Day Percent Change: -5.99% Day Change: -0.17 | |
| Week Change: -10.7% Year-to-date Change: -54.2% | |
| AUGX Links: Profile News Message Board | |
| Charts:- Daily , Weekly | |
| Add AUGX to Watchlist: View: Get Complete AUGX Trend Analysis ➞ | |
 | ABOS Acumen Pharmaceuticals, Inc. |
| Sector: Health Care | |
| SubSector: Biotechnology | |
| MarketCap: 199 Millions | |
| Recent Price: 3.09 Smart Investing & Trading Score: 25 | |
| Day Percent Change: -2.52% Day Change: -0.08 | |
| Week Change: -1.9% Year-to-date Change: -19.5% | |
| ABOS Links: Profile News Message Board | |
| Charts:- Daily , Weekly | |
| Add ABOS to Watchlist: View: Get Complete ABOS Trend Analysis ➞ | |
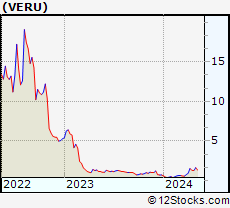 | VERU Veru Inc. |
| Sector: Health Care | |
| SubSector: Drug Manufacturers - Other | |
| MarketCap: 198.833 Millions | |
| Recent Price: 1.25 Smart Investing & Trading Score: 71 | |
| Day Percent Change: -5.30% Day Change: -0.07 | |
| Week Change: -4.21% Year-to-date Change: 73.6% | |
| VERU Links: Profile News Message Board | |
| Charts:- Daily , Weekly | |
| Add VERU to Watchlist: View: Get Complete VERU Trend Analysis ➞ | |
 | SLN Silence Therapeutics plc |
| Sector: Health Care | |
| SubSector: Biotechnology | |
| MarketCap: 198 Millions | |
| Recent Price: 21.64 Smart Investing & Trading Score: 38 | |
| Day Percent Change: -3.09% Day Change: -0.69 | |
| Week Change: -4.42% Year-to-date Change: 23.3% | |
| SLN Links: Profile News Message Board | |
| Charts:- Daily , Weekly | |
| Add SLN to Watchlist: View: Get Complete SLN Trend Analysis ➞ | |
 | STRO Sutro Biopharma, Inc. |
| Sector: Health Care | |
| SubSector: Biotechnology | |
| MarketCap: 196.485 Millions | |
| Recent Price: 3.35 Smart Investing & Trading Score: 20 | |
| Day Percent Change: -3.60% Day Change: -0.13 | |
| Week Change: -7.98% Year-to-date Change: -22.0% | |
| STRO Links: Profile News Message Board | |
| Charts:- Daily , Weekly | |
| Add STRO to Watchlist: View: Get Complete STRO Trend Analysis ➞ | |
| For tabular summary view of above stock list: Summary View ➞ 0 - 25 , 25 - 50 , 50 - 75 , 75 - 100 , 100 - 125 , 125 - 150 , 150 - 175 , 175 - 200 , 200 - 225 , 225 - 250 , 250 - 275 , 275 - 300 , 300 - 325 , 325 - 350 , 350 - 375 , 375 - 400 , 400 - 425 , 425 - 450 , 450 - 475 , 475 - 500 , 500 - 525 , 525 - 550 , 550 - 575 , 575 - 600 , 600 - 625 , 625 - 650 | ||
| Click To Change The Sort Order: By Market Cap or Company Size Performance: Year-to-date, Week and Day | |
| Select Chart Type: | ||
|
Best Stocks Today 12Stocks.com |
© 2024 12Stocks.com Terms & Conditions Privacy Contact Us
All Information Provided Only For Education And Not To Be Used For Investing or Trading. See Terms & Conditions


One More Thing ... Get Best Stocks Delivered Daily!
Never Ever Miss A Move With Our Top Ten Stocks Lists
Find Best Stocks In Any Market - Bull or Bear Market
Take A Peek At Our Top Ten Stocks Lists: Daily, Weekly, Year-to-Date & Top Trends
Find Best Stocks In Any Market - Bull or Bear Market
Take A Peek At Our Top Ten Stocks Lists: Daily, Weekly, Year-to-Date & Top Trends
Healthcare Stocks With Best Up Trends [0-bearish to 100-bullish]: AstraZeneca [100], Merck [100], Boston Scientific[100], Annovis Bio[100], Agios [100], Quest Diagnostics[100], Haemonetics [100], Mesoblast [95], Agenus [95], NewAmsterdam Pharma[93], Centene [93]
Best Healthcare Stocks Year-to-Date:
Precision BioSciences[2590.41%], Inovio [1819.61%], Assembly Biosciences[1543.7%], Aurora Cannabis[1356.32%], NuCana [1198.17%], Agenus [773.9%], CareMax [572.16%], Corbus [480.63%], Mesoblast [454.55%], Janux [332.95%], GeneDx [318.57%] Best Healthcare Stocks This Week:
OptiNose [36.3%], Agenus [36.25%], BeyondSpring [35%], Seres [34.31%], Annovis Bio[28.35%], CareMax [26.85%], ProKidney [24.02%], Aesthetic [21.49%], MSP Recovery[19.2%], GeneDx [18.1%], Mesoblast [17.08%] Best Healthcare Stocks Daily:
OptiNose [31.85%], Zura Bio[8.59%], Community Health[7.10%], LENSAR [6.92%], AstraZeneca [5.88%], Sanofi [5.47%], ADiTx [4.41%], Monopar [4.29%], Centessa [3.82%], Dr. Reddy[3.74%], Theratechnologies [3.68%]