
 Login Sign Up


| |||||
 |  | ||||

| 12Stocks.com Market Intelligence |
Best Healthcare Stocks
 | "Discover best trending healthcare stocks with 12Stocks.com." |
| - Subu Vdaygiri, Founder, 12Stocks.com |
| In a hurry? Healthcare Stocks Lists: Performance Trends Table, Stock Charts
Sort Healthcare stocks: Daily, Weekly, Year-to-Date, Market Cap & Trends. Filter Healthcare stocks list by size:All Healthcare Large Mid-Range Small |
| 12Stocks.com Healthcare Stocks Performances & Trends Daily | |||||||||
|
|  The overall Smart Investing & Trading Score is 25 (0-bearish to 100-bullish) which puts Healthcare sector in short term bearish to neutral trend. The Smart Investing & Trading Score from previous trading session is 18 and hence an improvement of trend.
| ||||||||
Here are the Smart Investing & Trading Scores of the most requested Healthcare stocks at 12Stocks.com (click stock name for detailed review):
|


| 12Stocks.com: Investing in Healthcare sector with Stocks | |
|
The following table helps investors and traders sort through current performance and trends (as measured by Smart Investing & Trading Score) of various
stocks in the Healthcare sector. Quick View: Move mouse or cursor over stock symbol (ticker) to view short-term Technical chart and over stock name to view long term chart. Click on  to add stock symbol to your watchlist and to add stock symbol to your watchlist and  to view watchlist. Click on any ticker or stock name for detailed market intelligence report for that stock. to view watchlist. Click on any ticker or stock name for detailed market intelligence report for that stock. |
12Stocks.com Performance of Stocks in Healthcare Sector
| Ticker | Stock Name | Watchlist | Category | Recent Price | Smart Investing & Trading Score | Change % | YTD Change% |
| ARVN | Arvinas |   | Biotechnology | 34.78 | 32 | 1.43% | -15.50% |
| LFST | LifeStance Health | | Medical Care Facilities | 5.71 | 25 | -0.78% | -27.86% |
| BLUE | bluebird bio | | Biotechnology | 1.02 | 32 | 7.03% | -26.09% |
| TNDM | Tandem Diabetes | | Instruments | 30.43 | 36 | -1.62% | 2.87% |
| NEOG | Neogen | | Diagnostic | 11.61 | 10 | -2.68% | -42.27% |
| ALLK | Allakos | | Biotechnology | 1.06 | 23 | 0.47% | -60.99% |
| ARWR | Arrowhead | | Biotechnology | 22.33 | 0 | -1.24% | -27.03% |
| PRVA | Privia Health | | Health Information | 18.08 | 32 | 1.23% | -23.49% |
| BPMC | Blueprint Medicines | | Biotechnology | 86.85 | 56 | -2.31% | -5.84% |
| NKTR | Nektar | | Biotechnology | 1.24 | 53 | -6.06% | 119.47% |
| MEDP | Medpace | | Laboratories | 371.87 | 26 | -0.65% | 21.32% |
| ALLO | Allogene | | Biotechnology | 3.48 | 28 | 0.58% | 8.41% |
| IMCR | Immunocore | | Biotechnology | 55.68 | 32 | 4.33% | -17.98% |
| PTCT | PTC | | Biotechnology | 25.32 | 35 | 2.55% | -8.13% |
| NEO | NeoGenomics | | Laboratories | 13.53 | 10 | -1.74% | -16.38% |
| ALEC | Alector | | Biotechnology | 5.10 | 0 | 0.20% | -36.09% |
| CRSP | CRISPR | | Biotechnology | 55.05 | 10 | -1.98% | -12.06% |
| FOLD | Amicus | | Biotechnology | 10.61 | 35 | 2.71% | -25.23% |
| MLTX | MoonLake Immuno | | Biotechnology | 42.19 | 0 | -2.77% | -32.80% |
| MOR | MorphoSys AG | | Biotechnology | 17.96 | 49 | -0.50% | 81.41% |
| AGIO | Agios | | Biotechnology | 29.53 | 83 | 0.34% | 32.60% |
| FGEN | FibroGen | | Biotechnology | 1.15 | 20 | -1.71% | 29.75% |
| NVRO | Nevro | | Equipment | 12.07 | 17 | -2.03% | -43.91% |
| PROK | ProKidney | | Biotechnology | 2.04 | 68 | -11.69% | 16.91% |
| EBS | Emergent Bio | | Biotechnology | 2.04 | 68 | 9.68% | -15.00% |
| For chart view version of above stock list: Chart View ➞ 0 - 25 , 25 - 50 , 50 - 75 , 75 - 100 , 100 - 125 , 125 - 150 , 150 - 175 , 175 - 200 , 200 - 225 , 225 - 250 , 250 - 275 , 275 - 300 , 300 - 325 , 325 - 350 , 350 - 375 , 375 - 400 , 400 - 425 , 425 - 450 , 450 - 475 , 475 - 500 , 500 - 525 , 525 - 550 , 550 - 575 , 575 - 600 , 600 - 625 , 625 - 650 , 650 - 675 , 675 - 700 , 700 - 725 | ||
 | Click To Change The Sort Order: By Market Cap or Company Size Performance: Year-to-date, Week and Day |  |
|
Get the most comprehensive stock market coverage daily at 12Stocks.com ➞ Best Stocks Today ➞ Best Stocks Weekly ➞ Best Stocks Year-to-Date ➞ Best Stocks Trends ➞  Best Stocks Today 12Stocks.com Best Nasdaq Stocks ➞ Best S&P 500 Stocks ➞ Best Tech Stocks ➞ Best Biotech Stocks ➞ |
| Detailed Overview of Healthcare Stocks |
| Healthcare Technical Overview, Leaders & Laggards, Top Healthcare ETF Funds & Detailed Healthcare Stocks List, Charts, Trends & More |
| Healthcare Sector: Technical Analysis, Trends & YTD Performance | |
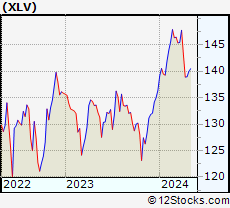
| Healthcare sector is composed of stocks
from pharmaceutical, biotech, diagnostics labs, insurance providers
and healthcare services. Healthcare sector, as represented by XLV, an exchange-traded fund [ETF] that holds basket of Healthcare stocks (e.g, Merck, Amgen) is up by 1.88% and is currently underperforming the overall market by -1.5% year-to-date. Below is a quick view of Technical charts and trends: |
|
 XLV Weekly Chart |
|
| Long Term Trend: Not Good | |
| Medium Term Trend: Not Good | |
 XLV Daily Chart |
|
| Short Term Trend: Very Good | |
| Overall Trend Score: 25 | |
| YTD Performance: 1.88% | |
| **Trend Scores & Views Are Only For Educational Purposes And Not For Investing | |
| 12Stocks.com: Top Performing Healthcare Sector Stocks | ||||||||||||||||||||||||||||||||||||||||||||||||
 The top performing Healthcare sector stocks year to date are
Now, more recently, over last week, the top performing Healthcare sector stocks on the move are


|
||||||||||||||||||||||||||||||||||||||||||||||||
| 12Stocks.com: Investing in Healthcare Sector using Exchange Traded Funds | |
|
The following table shows list of key exchange traded funds (ETF) that
help investors track Healthcare Index. For detailed view, check out our ETF Funds section of our website. Quick View: Move mouse or cursor over ETF symbol (ticker) to view short-term Technical chart and over ETF name to view long term chart. Click on ticker or stock name for detailed view. Click on to add stock symbol to your watchlist and to view watchlist. |
12Stocks.com List of ETFs that track Healthcare Index
| Ticker | ETF Name | Watchlist | Recent Price | Smart Investing & Trading Score | Change % | Week % | Year-to-date % |
| XLV | Health Care | | 138.95 | 25 | 0.38 | 0.03 | 1.88% |
| XBI | Biotech | | 82.83 | 10 | -0.78 | -6.04 | -7.23% |
| IBB | Biotechnology | | 124.72 | 10 | 0.06 | -3.75 | -8.19% |
| BBH | Biotech | | 152.36 | 10 | 0.01 | -3.32 | -7.83% |
| VHT | Health Care | | 253.33 | 18 | 0.20 | -0.57 | 1.05% |
| IYH | Healthcare | | 58.16 | 18 | 0.19 | -0.41 | 1.59% |
| IHF | Healthcare Providers | | 52.21 | 62 | 1.29 | 3.3 | -0.57% |
| IHI | Medical Devices | | 54.36 | 10 | -0.31 | -3.1 | 0.72% |
| BIB | Biotechnology | | 48.20 | 10 | 0.54 | -6.21 | -15.51% |
| BIS | Short Biotech | | 20.90 | 95 | 0.14 | 6.61 | 15.63% |
| XHE | Health Care Equipment | | 81.27 | 10 | -0.20 | -3.13 | -3.55% |
| CURE | Healthcare Bull 3X | | 103.33 | 25 | 1.09 | -0.06 | 1.56% |
| LABU | Biotech Bull 3X | | 86.05 | 10 | -2.26 | -17.54 | -29.45% |
| LABD | Biotech Bear 3X | | 10.80 | 100 | 2.66 | 20.27 | 11.46% |
| PSCH | SmallCap Health Care | | 40.18 | 20 | 0.25 | -3.02 | -6.12% |
| XHS | Health Care Services | | 87.08 | 38 | 1.04 | -1.05 | -2.1% |
| PTH | DWA Healthcare Momentum | | 39.53 | 23 | -0.10 | -5.5 | 1% |
| BTEC | Principal Healthcare Innovators | | 33.86 | 0 | -0.67 | -5.92 | -6.8% |
| RXL | Health Care | | 93.22 | 25 | 0.85 | -0.03 | 1.99% |
| RXD | Short Health Care | | 11.64 | 76 | -0.29 | 0.34 | -2.39% |
| 12Stocks.com: Charts, Trends, Fundamental Data and Performances of Healthcare Stocks | |
|
We now take in-depth look at all Healthcare stocks including charts, multi-period performances and overall trends (as measured by Smart Investing & Trading Score). One can sort Healthcare stocks (click link to choose) by Daily, Weekly and by Year-to-Date performances. Also, one can sort by size of the company or by market capitalization. |
| Select Your Default Chart Type: | |||||
| |||||
| Click on stock symbol or name for detailed view. Click on to add stock symbol to your watchlist and to view watchlist. Quick View: Move mouse or cursor over "Daily" to quickly view daily Technical stock chart and over "Weekly" to view weekly Technical stock chart. | |||||

 | ARVN Arvinas, Inc. |
| Sector: Health Care | |
| SubSector: Biotechnology | |
| MarketCap: 3469.85 Millions | |
| Recent Price: 34.78 Smart Investing & Trading Score: 32 | |
| Day Percent Change: 1.43% Day Change: 0.49 | |
| Week Change: -4.16% Year-to-date Change: -15.5% | |
| ARVN Links: Profile News Message Board | |
| Charts:- Daily , Weekly | |
| Add ARVN to Watchlist: View: Get Complete ARVN Trend Analysis ➞ | |
 | LFST LifeStance Health Group, Inc. |
| Sector: Health Care | |
| SubSector: Medical Care Facilities | |
| MarketCap: 3460 Millions | |
| Recent Price: 5.71 Smart Investing & Trading Score: 25 | |
| Day Percent Change: -0.78% Day Change: -0.04 | |
| Week Change: -5.62% Year-to-date Change: -27.9% | |
| LFST Links: Profile News Message Board | |
| Charts:- Daily , Weekly | |
| Add LFST to Watchlist: View: Get Complete LFST Trend Analysis ➞ | |
 | BLUE bluebird bio, Inc. |
| Sector: Health Care | |
| SubSector: Biotechnology | |
| MarketCap: 3365.05 Millions | |
| Recent Price: 1.02 Smart Investing & Trading Score: 32 | |
| Day Percent Change: 7.03% Day Change: 0.07 | |
| Week Change: -7.27% Year-to-date Change: -26.1% | |
| BLUE Links: Profile News Message Board | |
| Charts:- Daily , Weekly | |
| Add BLUE to Watchlist: View: Get Complete BLUE Trend Analysis ➞ | |
 | TNDM Tandem Diabetes Care, Inc. |
| Sector: Health Care | |
| SubSector: Medical Instruments & Supplies | |
| MarketCap: 3359.1 Millions | |
| Recent Price: 30.43 Smart Investing & Trading Score: 36 | |
| Day Percent Change: -1.62% Day Change: -0.50 | |
| Week Change: -9.16% Year-to-date Change: 2.9% | |
| TNDM Links: Profile News Message Board | |
| Charts:- Daily , Weekly | |
| Add TNDM to Watchlist: View: Get Complete TNDM Trend Analysis ➞ | |
 | NEOG Neogen Corporation |
| Sector: Health Care | |
| SubSector: Diagnostic Substances | |
| MarketCap: 3234.71 Millions | |
| Recent Price: 11.61 Smart Investing & Trading Score: 10 | |
| Day Percent Change: -2.68% Day Change: -0.32 | |
| Week Change: -6.22% Year-to-date Change: -42.3% | |
| NEOG Links: Profile News Message Board | |
| Charts:- Daily , Weekly | |
| Add NEOG to Watchlist: View: Get Complete NEOG Trend Analysis ➞ | |
 | ALLK Allakos Inc. |
| Sector: Health Care | |
| SubSector: Biotechnology | |
| MarketCap: 3233.55 Millions | |
| Recent Price: 1.06 Smart Investing & Trading Score: 23 | |
| Day Percent Change: 0.47% Day Change: 0.00 | |
| Week Change: -4.05% Year-to-date Change: -61.0% | |
| ALLK Links: Profile News Message Board | |
| Charts:- Daily , Weekly | |
| Add ALLK to Watchlist: View: Get Complete ALLK Trend Analysis ➞ | |
 | ARWR Arrowhead Pharmaceuticals, Inc. |
| Sector: Health Care | |
| SubSector: Biotechnology | |
| MarketCap: 3226.15 Millions | |
| Recent Price: 22.33 Smart Investing & Trading Score: 0 | |
| Day Percent Change: -1.24% Day Change: -0.28 | |
| Week Change: -9.67% Year-to-date Change: -27.0% | |
| ARWR Links: Profile News Message Board | |
| Charts:- Daily , Weekly | |
| Add ARWR to Watchlist: View: Get Complete ARWR Trend Analysis ➞ | |
 | PRVA Privia Health Group, Inc. |
| Sector: Health Care | |
| SubSector: Health Information Services | |
| MarketCap: 3130 Millions | |
| Recent Price: 18.08 Smart Investing & Trading Score: 32 | |
| Day Percent Change: 1.23% Day Change: 0.22 | |
| Week Change: -2.48% Year-to-date Change: -23.5% | |
| PRVA Links: Profile News Message Board | |
| Charts:- Daily , Weekly | |
| Add PRVA to Watchlist: View: Get Complete PRVA Trend Analysis ➞ | |
 | BPMC Blueprint Medicines Corporation |
| Sector: Health Care | |
| SubSector: Biotechnology | |
| MarketCap: 3113.55 Millions | |
| Recent Price: 86.85 Smart Investing & Trading Score: 56 | |
| Day Percent Change: -2.31% Day Change: -2.05 | |
| Week Change: -0.46% Year-to-date Change: -5.8% | |
| BPMC Links: Profile News Message Board | |
| Charts:- Daily , Weekly | |
| Add BPMC to Watchlist: View: Get Complete BPMC Trend Analysis ➞ | |
 | NKTR Nektar Therapeutics |
| Sector: Health Care | |
| SubSector: Biotechnology | |
| MarketCap: 2953.45 Millions | |
| Recent Price: 1.24 Smart Investing & Trading Score: 53 | |
| Day Percent Change: -6.06% Day Change: -0.08 | |
| Week Change: -25.75% Year-to-date Change: 119.5% | |
| NKTR Links: Profile News Message Board | |
| Charts:- Daily , Weekly | |
| Add NKTR to Watchlist: View: Get Complete NKTR Trend Analysis ➞ | |
 | MEDP Medpace Holdings, Inc. |
| Sector: Health Care | |
| SubSector: Medical Laboratories & Research | |
| MarketCap: 2888.7 Millions | |
| Recent Price: 371.87 Smart Investing & Trading Score: 26 | |
| Day Percent Change: -0.65% Day Change: -2.45 | |
| Week Change: -5.86% Year-to-date Change: 21.3% | |
| MEDP Links: Profile News Message Board | |
| Charts:- Daily , Weekly | |
| Add MEDP to Watchlist: View: Get Complete MEDP Trend Analysis ➞ | |
 | ALLO Allogene Therapeutics, Inc. |
| Sector: Health Care | |
| SubSector: Biotechnology | |
| MarketCap: 2858.65 Millions | |
| Recent Price: 3.48 Smart Investing & Trading Score: 28 | |
| Day Percent Change: 0.58% Day Change: 0.02 | |
| Week Change: -8.42% Year-to-date Change: 8.4% | |
| ALLO Links: Profile News Message Board | |
| Charts:- Daily , Weekly | |
| Add ALLO to Watchlist: View: Get Complete ALLO Trend Analysis ➞ | |
 | IMCR Immunocore Holdings plc |
| Sector: Health Care | |
| SubSector: Biotechnology | |
| MarketCap: 2830 Millions | |
| Recent Price: 55.68 Smart Investing & Trading Score: 32 | |
| Day Percent Change: 4.33% Day Change: 2.31 | |
| Week Change: -1.5% Year-to-date Change: -18.0% | |
| IMCR Links: Profile News Message Board | |
| Charts:- Daily , Weekly | |
| Add IMCR to Watchlist: View: Get Complete IMCR Trend Analysis ➞ | |
 | PTCT PTC Therapeutics, Inc. |
| Sector: Health Care | |
| SubSector: Biotechnology | |
| MarketCap: 2795.85 Millions | |
| Recent Price: 25.32 Smart Investing & Trading Score: 35 | |
| Day Percent Change: 2.55% Day Change: 0.63 | |
| Week Change: -4.16% Year-to-date Change: -8.1% | |
| PTCT Links: Profile News Message Board | |
| Charts:- Daily , Weekly | |
| Add PTCT to Watchlist: View: Get Complete PTCT Trend Analysis ➞ | |
 | NEO NeoGenomics, Inc. |
| Sector: Health Care | |
| SubSector: Medical Laboratories & Research | |
| MarketCap: 2763.8 Millions | |
| Recent Price: 13.53 Smart Investing & Trading Score: 10 | |
| Day Percent Change: -1.74% Day Change: -0.24 | |
| Week Change: -3.97% Year-to-date Change: -16.4% | |
| NEO Links: Profile News Message Board | |
| Charts:- Daily , Weekly | |
| Add NEO to Watchlist: View: Get Complete NEO Trend Analysis ➞ | |
 | ALEC Alector, Inc. |
| Sector: Health Care | |
| SubSector: Biotechnology | |
| MarketCap: 2719.35 Millions | |
| Recent Price: 5.10 Smart Investing & Trading Score: 0 | |
| Day Percent Change: 0.20% Day Change: 0.01 | |
| Week Change: -15.28% Year-to-date Change: -36.1% | |
| ALEC Links: Profile News Message Board | |
| Charts:- Daily , Weekly | |
| Add ALEC to Watchlist: View: Get Complete ALEC Trend Analysis ➞ | |
 | CRSP CRISPR Therapeutics AG |
| Sector: Health Care | |
| SubSector: Biotechnology | |
| MarketCap: 2691.35 Millions | |
| Recent Price: 55.05 Smart Investing & Trading Score: 10 | |
| Day Percent Change: -1.98% Day Change: -1.11 | |
| Week Change: -9.26% Year-to-date Change: -12.1% | |
| CRSP Links: Profile News Message Board | |
| Charts:- Daily , Weekly | |
| Add CRSP to Watchlist: View: Get Complete CRSP Trend Analysis ➞ | |
 | FOLD Amicus Therapeutics, Inc. |
| Sector: Health Care | |
| SubSector: Biotechnology | |
| MarketCap: 2676.75 Millions | |
| Recent Price: 10.61 Smart Investing & Trading Score: 35 | |
| Day Percent Change: 2.71% Day Change: 0.28 | |
| Week Change: -5.44% Year-to-date Change: -25.2% | |
| FOLD Links: Profile News Message Board | |
| Charts:- Daily , Weekly | |
| Add FOLD to Watchlist: View: Get Complete FOLD Trend Analysis ➞ | |
 | MLTX MoonLake Immunotherapeutics |
| Sector: Health Care | |
| SubSector: Biotechnology | |
| MarketCap: 2670 Millions | |
| Recent Price: 42.19 Smart Investing & Trading Score: 0 | |
| Day Percent Change: -2.77% Day Change: -1.20 | |
| Week Change: -3.92% Year-to-date Change: -32.8% | |
| MLTX Links: Profile News Message Board | |
| Charts:- Daily , Weekly | |
| Add MLTX to Watchlist: View: Get Complete MLTX Trend Analysis ➞ | |
 | MOR MorphoSys AG |
| Sector: Health Care | |
| SubSector: Biotechnology | |
| MarketCap: 2636.85 Millions | |
| Recent Price: 17.96 Smart Investing & Trading Score: 49 | |
| Day Percent Change: -0.50% Day Change: -0.09 | |
| Week Change: -0.55% Year-to-date Change: 81.4% | |
| MOR Links: Profile News Message Board | |
| Charts:- Daily , Weekly | |
| Add MOR to Watchlist: View: Get Complete MOR Trend Analysis ➞ | |
 | AGIO Agios Pharmaceuticals, Inc. |
| Sector: Health Care | |
| SubSector: Biotechnology | |
| MarketCap: 2613.35 Millions | |
| Recent Price: 29.53 Smart Investing & Trading Score: 83 | |
| Day Percent Change: 0.34% Day Change: 0.10 | |
| Week Change: 0.07% Year-to-date Change: 32.6% | |
| AGIO Links: Profile News Message Board | |
| Charts:- Daily , Weekly | |
| Add AGIO to Watchlist: View: Get Complete AGIO Trend Analysis ➞ | |
 | FGEN FibroGen, Inc. |
| Sector: Health Care | |
| SubSector: Biotechnology | |
| MarketCap: 2502.95 Millions | |
| Recent Price: 1.15 Smart Investing & Trading Score: 20 | |
| Day Percent Change: -1.71% Day Change: -0.02 | |
| Week Change: -15.44% Year-to-date Change: 29.8% | |
| FGEN Links: Profile News Message Board | |
| Charts:- Daily , Weekly | |
| Add FGEN to Watchlist: View: Get Complete FGEN Trend Analysis ➞ | |
 | NVRO Nevro Corp. |
| Sector: Health Care | |
| SubSector: Medical Appliances & Equipment | |
| MarketCap: 2489.3 Millions | |
| Recent Price: 12.07 Smart Investing & Trading Score: 17 | |
| Day Percent Change: -2.03% Day Change: -0.25 | |
| Week Change: -8.77% Year-to-date Change: -43.9% | |
| NVRO Links: Profile News Message Board | |
| Charts:- Daily , Weekly | |
| Add NVRO to Watchlist: View: Get Complete NVRO Trend Analysis ➞ | |
 | PROK ProKidney Corp. |
| Sector: Health Care | |
| SubSector: Biotechnology | |
| MarketCap: 2470 Millions | |
| Recent Price: 2.04 Smart Investing & Trading Score: 68 | |
| Day Percent Change: -11.69% Day Change: -0.27 | |
| Week Change: 16.57% Year-to-date Change: 16.9% | |
| PROK Links: Profile News Message Board | |
| Charts:- Daily , Weekly | |
| Add PROK to Watchlist: View: Get Complete PROK Trend Analysis ➞ | |
 | EBS Emergent BioSolutions Inc. |
| Sector: Health Care | |
| SubSector: Biotechnology | |
| MarketCap: 2417.65 Millions | |
| Recent Price: 2.04 Smart Investing & Trading Score: 68 | |
| Day Percent Change: 9.68% Day Change: 0.18 | |
| Week Change: -0.97% Year-to-date Change: -15.0% | |
| EBS Links: Profile News Message Board | |
| Charts:- Daily , Weekly | |
| Add EBS to Watchlist: View: Get Complete EBS Trend Analysis ➞ | |
| For tabular summary view of above stock list: Summary View ➞ 0 - 25 , 25 - 50 , 50 - 75 , 75 - 100 , 100 - 125 , 125 - 150 , 150 - 175 , 175 - 200 , 200 - 225 , 225 - 250 , 250 - 275 , 275 - 300 , 300 - 325 , 325 - 350 , 350 - 375 , 375 - 400 , 400 - 425 , 425 - 450 , 450 - 475 , 475 - 500 , 500 - 525 , 525 - 550 , 550 - 575 , 575 - 600 , 600 - 625 , 625 - 650 , 650 - 675 , 675 - 700 , 700 - 725 | ||
| Click To Change The Sort Order: By Market Cap or Company Size Performance: Year-to-date, Week and Day | |
| Select Chart Type: | ||
|
Best Stocks Today 12Stocks.com |
© 2024 12Stocks.com Terms & Conditions Privacy Contact Us
All Information Provided Only For Education And Not To Be Used For Investing or Trading. See Terms & Conditions


One More Thing ... Get Best Stocks Delivered Daily!
Never Ever Miss A Move With Our Top Ten Stocks Lists
Find Best Stocks In Any Market - Bull or Bear Market
Take A Peek At Our Top Ten Stocks Lists: Daily, Weekly, Year-to-Date & Top Trends
Find Best Stocks In Any Market - Bull or Bear Market
Take A Peek At Our Top Ten Stocks Lists: Daily, Weekly, Year-to-Date & Top Trends
Healthcare Stocks With Best Up Trends [0-bearish to 100-bullish]: Vanda [100], Rani [95], Humacyte [95], Phibro Animal[95], ALX Oncology[95], Fresenius [95], Oscar Health[95], Lantheus [93], United [93], Mesoblast [88], OPKO Health[88]
Best Healthcare Stocks Year-to-Date:
Precision BioSciences[2571.23%], Inovio [1798.04%], Assembly Biosciences[1535.17%], Adverum Biotechnologies[1406.38%], Aurora Cannabis[1256.57%], NuCana [1188.03%], Affimed N.V[724%], Corbus [549.67%], Agenus [541.38%], CareMax [429.9%], Zhongchao [412.19%] Best Healthcare Stocks This Week:
NuCana [1601.65%], Regencell Bioscience[45.67%], Rani [30.93%], Humacyte [28.47%], Venus Concept[25.44%], Vanda [24.03%], ALX Oncology[22.49%], ProKidney [16.57%], Nyxoah S.A[16.22%], Galera [15.36%], UnitedHealth [14.1%] Best Healthcare Stocks Daily:
Rani [15.71%], Genelux [14.25%], Humacyte [14.02%], Accelerate Diagnostics[11.56%], Emergent Bio[9.68%], Venus Concept[8.75%], Adaptimmune [8.72%], BioXcel [8.63%], Corbus [7.42%], RedHill Biopharma[7.41%], DermTech [7.05%]