
 Login Sign Up


| |||||
 |  | ||||

| 12Stocks.com Market Intelligence |
Best Financial Stocks
| In a hurry? Financial Stocks Lists: Performance Trends Table, Stock Charts
Sort Financial stocks: Daily, Weekly, Year-to-Date, Market Cap & Trends. Filter Financial stocks list by size:All Financial Large Mid-Range Small & MicroCap |
| 12Stocks.com Financial Stocks Performances & Trends Daily | |||||||||
|
|  The overall Smart Investing & Trading Score is 70 (0-bearish to 100-bullish) which puts Financial sector in short term neutral to bullish trend. The Smart Investing & Trading Score from previous trading session is 63 and hence an improvement of trend.
| ||||||||
Here are the Smart Investing & Trading Scores of the most requested Financial stocks at 12Stocks.com (click stock name for detailed review):
|


| 12Stocks.com: Investing in Financial sector with Stocks | |
|
The following table helps investors and traders sort through current performance and trends (as measured by Smart Investing & Trading Score) of various
stocks in the Financial sector. Quick View: Move mouse or cursor over stock symbol (ticker) to view short-term Technical chart and over stock name to view long term chart. Click on  to add stock symbol to your watchlist and to add stock symbol to your watchlist and  to view watchlist. Click on any ticker or stock name for detailed market intelligence report for that stock. to view watchlist. Click on any ticker or stock name for detailed market intelligence report for that stock. |
12Stocks.com Performance of Stocks in Financial Sector
| Ticker | Stock Name | Watchlist | Category | Recent Price | Trend Score | Change % | YTD Change% |
| PMAR | Innovator S&P |   | Exchange Traded Fund | 35.98 | 38 | 0.56% | 0.98% |
| PFEB | Innovator S&P | | Exchange Traded Fund | 33.58 | 51 | 0.51% | 2.82% |
| NUSI | Nationwide Risk | | Exchange Traded Fund | 22.71 | 23 | 0.58% | 1.29% |
| NJUL | Innovator Nasdaq | | Exchange Traded Fund | 56.52 | 44 | 0.60% | 2.65% |
| NJAN | Innovator Nasdaq | | Exchange Traded Fund | 42.52 | 30 | 0.76% | 2.02% |
| NAPR | Innovator Nasdaq | | Exchange Traded Fund | 44.26 | 25 | 1.05% | -0.43% |
| MSTB | LHA Market | | Exchange Traded Fund | 30.12 | 36 | 0.05% | 4.55% |
| MSOS | AdvisorShares Pure | | Exchange Traded Fund | 8.57 | 5 | -2.17% | 22.43% |
| MOON | Direxion Moonshot | | Exchange Traded Fund | 8.99 | 25 | 1.01% | -21.00% |
| LRNZ | TrueShares Technology | | Exchange Traded Fund | 35.12 | 10 | 1.70% | -7.99% |
| LDEM | iShares ESG | | Exchange Traded Fund | 42.73 | 68 | 1.12% | -2.68% |
| LCG | Sterling Capital | | Exchange Traded Fund | 28.18 | 17 | 0.67% | -0.95% |
| KRBN | KraneShares Trust | | Exchange Traded Fund | 31.72 | 43 | -1.80% | -12.95% |
| KOKU | Xtrackers MSCI | | Exchange Traded Fund | 88.06 | 36 | 0.00% | 3.38% |
| KJUL | Innovator Russell | | Exchange Traded Fund | 26.90 | 58 | 1.14% | -1.22% |
| KJAN | Innovator Russell | | Exchange Traded Fund | 34.09 | 58 | 0.77% | -0.70% |
| KAPR | Innovator Russell | | Exchange Traded Fund | 29.90 | 68 | 0.71% | 2.33% |
| JOET | Virtus Terranova | | Exchange Traded Fund | 32.45 | 51 | 1.03% | 5.91% |
| JIG | JPMorgan | | Exchange Traded Fund | 60.13 | 51 | 1.17% | 3.04% |
| JEPI | JPMorgan Equity | | Exchange Traded Fund | 55.92 | 38 | 0.85% | 1.66% |
| IQSI | IQ Candriam | | Exchange Traded Fund | 28.60 | 38 | 0.90% | 1.38% |
| IJAN | Innovator MSCI | | Exchange Traded Fund | 30.64 | 51 | 0.38% | 0.66% |
| IBTJ | iShares iBonds | | Exchange Traded Fund | 21.05 | 18 | 0.05% | -3.40% |
| IBTG | iShares iBonds | | Exchange Traded Fund | 22.53 | 25 | 0.06% | -1.47% |
| IBTE | iShares iBonds | | Exchange Traded Fund | 23.93 | 48 | 0.00% | 0.29% |
| For chart view version of above stock list: Chart View ➞ 0 - 25 , 25 - 50 , 50 - 75 , 75 - 100 , 100 - 125 , 125 - 150 , 150 - 175 , 175 - 200 , 200 - 225 , 225 - 250 , 250 - 275 , 275 - 300 , 300 - 325 , 325 - 350 , 350 - 375 , 375 - 400 , 400 - 425 , 425 - 450 , 450 - 475 , 475 - 500 , 500 - 525 , 525 - 550 , 550 - 575 , 575 - 600 , 600 - 625 , 625 - 650 , 650 - 675 , 675 - 700 , 700 - 725 , 725 - 750 , 750 - 775 , 775 - 800 , 800 - 825 , 825 - 850 , 850 - 875 , 875 - 900 , 900 - 925 , 925 - 950 , 950 - 975 , 975 - 1000 , 1000 - 1025 , 1025 - 1050 , 1050 - 1075 , 1075 - 1100 , 1100 - 1125 , 1125 - 1150 , 1150 - 1175 , 1175 - 1200 , 1200 - 1225 , 1225 - 1250 | ||
 | Click To Change The Sort Order: By Market Cap or Company Size Performance: Year-to-date, Week and Day |  |
|
Get the most comprehensive stock market coverage daily at 12Stocks.com ➞ Best Stocks Today ➞ Best Stocks Weekly ➞ Best Stocks Year-to-Date ➞ Best Stocks Trends ➞  Best Stocks Today 12Stocks.com Best Nasdaq Stocks ➞ Best S&P 500 Stocks ➞ Best Tech Stocks ➞ Best Biotech Stocks ➞ |
| Detailed Overview of Financial Stocks |
| Financial Technical Overview, Leaders & Laggards, Top Financial ETF Funds & Detailed Financial Stocks List, Charts, Trends & More |
| Financial Sector: Technical Analysis, Trends & YTD Performance | |
| Financial sector is composed of stocks
from banks, brokers, insurance, REITs
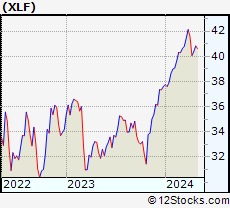
and services subsectors. Financial sector, as represented by XLF, an exchange-traded fund [ETF] that holds basket of Financial stocks (e.g, Bank of America, Goldman Sachs) is up by 8.7% and is currently outperforming the overall market by 4.31% year-to-date. Below is a quick view of Technical charts and trends: |
|
 XLF Weekly Chart |
|
| Long Term Trend: Very Good | |
| Medium Term Trend: Not Good | |
 XLF Daily Chart |
|
| Short Term Trend: Very Good | |
| Overall Trend Score: 70 | |
| YTD Performance: 8.7% | |
| **Trend Scores & Views Are Only For Educational Purposes And Not For Investing | |
| 12Stocks.com: Top Performing Financial Sector Stocks | ||||||||||||||||||||||||||||||||||||||||||||||||
 The top performing Financial sector stocks year to date are
Now, more recently, over last week, the top performing Financial sector stocks on the move are


|
||||||||||||||||||||||||||||||||||||||||||||||||
| 12Stocks.com: Investing in Financial Sector using Exchange Traded Funds | |
|
The following table shows list of key exchange traded funds (ETF) that
help investors track Financial Index. For detailed view, check out our ETF Funds section of our website. Quick View: Move mouse or cursor over ETF symbol (ticker) to view short-term Technical chart and over ETF name to view long term chart. Click on ticker or stock name for detailed view. Click on to add stock symbol to your watchlist and to view watchlist. |
12Stocks.com List of ETFs that track Financial Index
| Ticker | ETF Name | Watchlist | Recent Price | Smart Investing & Trading Score | Change % | Week % | Year-to-date % |
| XLF | Financial | | 40.87 | 70 | 1.21 | 1.21 | 8.7% |
| IAI | Broker-Dealers & Secs | | 112.88 | 75 | 1.67 | 1.67 | 4.01% |
| IYF | Financials | | 92.67 | 75 | 1.50 | 1.5 | 8.5% |
| IYG | Financial Services | | 64.37 | 75 | 1.50 | 1.5 | 7.76% |
| KRE | Regional Banking | | 47.73 | 59 | 0.88 | 0.88 | -8.95% |
| IXG | Global Financials | | 84.00 | 70 | 1.38 | 1.38 | 6.91% |
| VFH | Financials | | 98.31 | 63 | 0.57 | 0.57 | 6.56% |
| KBE | Bank | | 45.17 | 93 | 1.71 | 1.71 | -1.85% |
| FAS | Financial Bull 3X | | 101.59 | 75 | 3.74 | 3.74 | 22.92% |
| FAZ | Financial Bear 3X | | 10.77 | 25 | -3.84 | -3.84 | -21.21% |
| UYG | Financials | | 63.88 | 70 | 2.31 | 2.31 | 15.72% |
| IAT | Regional Banks | | 41.55 | 93 | 1.99 | 1.99 | -0.69% |
| KIE | Insurance | | 49.46 | 65 | 0.77 | 0.77 | 9.38% |
| PSCF | SmallCap Financials | | 46.24 | 59 | 1.69 | 1.69 | -5.98% |
| EUFN | Europe Financials | | 22.16 | 70 | 0.96 | 0.96 | 5.73% |
| PGF | Financial Preferred | | 14.52 | 18 | -0.07 | -0.07 | -0.41% |
| 12Stocks.com: Charts, Trends, Fundamental Data and Performances of Financial Stocks | |
|
We now take in-depth look at all Financial stocks including charts, multi-period performances and overall trends (as measured by Smart Investing & Trading Score). One can sort Financial stocks (click link to choose) by Daily, Weekly and by Year-to-Date performances. Also, one can sort by size of the company or by market capitalization. |
| Select Your Default Chart Type: | |||||
| |||||
| Click on stock symbol or name for detailed view. Click on to add stock symbol to your watchlist and to view watchlist. Quick View: Move mouse or cursor over "Daily" to quickly view daily Technical stock chart and over "Weekly" to view weekly Technical stock chart. | |||||

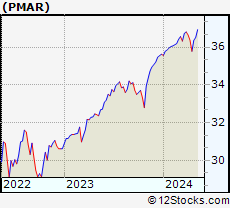 | PMAR Innovator S&P 500 Power Buffer ETF March |
| Sector: Financials | |
| SubSector: Exchange Traded Fund | |
| MarketCap: 60157 Millions | |
| Recent Price: 35.98 Smart Investing & Trading Score: 38 | |
| Day Percent Change: 0.56% Day Change: 0.20 | |
| Week Change: 0.56% Year-to-date Change: 1.0% | |
| PMAR Links: Profile News Message Board | |
| Charts:- Daily , Weekly | |
| Add PMAR to Watchlist: View: Get Complete PMAR Trend Analysis ➞ | |
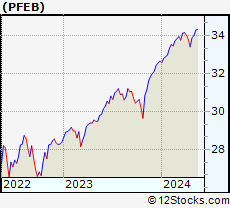 | PFEB Innovator S&P 500 Power Buffer ETF February |
| Sector: Financials | |
| SubSector: Exchange Traded Fund | |
| MarketCap: 60157 Millions | |
| Recent Price: 33.58 Smart Investing & Trading Score: 51 | |
| Day Percent Change: 0.51% Day Change: 0.17 | |
| Week Change: 0.51% Year-to-date Change: 2.8% | |
| PFEB Links: Profile News Message Board | |
| Charts:- Daily , Weekly | |
| Add PFEB to Watchlist: View: Get Complete PFEB Trend Analysis ➞ | |
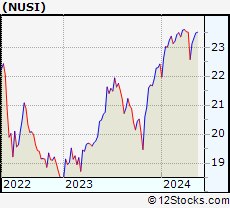 | NUSI Nationwide Risk Managed Income ETF |
| Sector: Financials | |
| SubSector: Exchange Traded Fund | |
| MarketCap: 60157 Millions | |
| Recent Price: 22.71 Smart Investing & Trading Score: 23 | |
| Day Percent Change: 0.58% Day Change: 0.13 | |
| Week Change: 0.58% Year-to-date Change: 1.3% | |
| NUSI Links: Profile News Message Board | |
| Charts:- Daily , Weekly | |
| Add NUSI to Watchlist: View: Get Complete NUSI Trend Analysis ➞ | |
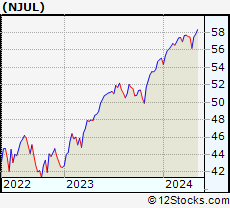 | NJUL Innovator Nasdaq 100 Power Buffer ETF July |
| Sector: Financials | |
| SubSector: Exchange Traded Fund | |
| MarketCap: 60157 Millions | |
| Recent Price: 56.52 Smart Investing & Trading Score: 44 | |
| Day Percent Change: 0.60% Day Change: 0.34 | |
| Week Change: 0.6% Year-to-date Change: 2.7% | |
| NJUL Links: Profile News Message Board | |
| Charts:- Daily , Weekly | |
| Add NJUL to Watchlist: View: Get Complete NJUL Trend Analysis ➞ | |
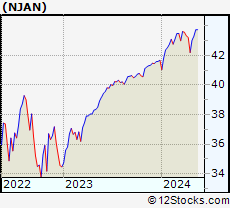 | NJAN Innovator Nasdaq 100 Power Buffer ETF January |
| Sector: Financials | |
| SubSector: Exchange Traded Fund | |
| MarketCap: 60157 Millions | |
| Recent Price: 42.52 Smart Investing & Trading Score: 30 | |
| Day Percent Change: 0.76% Day Change: 0.32 | |
| Week Change: 0.76% Year-to-date Change: 2.0% | |
| NJAN Links: Profile News Message Board | |
| Charts:- Daily , Weekly | |
| Add NJAN to Watchlist: View: Get Complete NJAN Trend Analysis ➞ | |
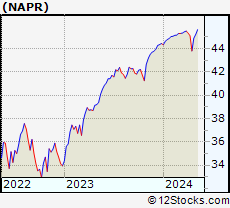 | NAPR Innovator Nasdaq 100 Power Buffer ETF April |
| Sector: Financials | |
| SubSector: Exchange Traded Fund | |
| MarketCap: 60157 Millions | |
| Recent Price: 44.26 Smart Investing & Trading Score: 25 | |
| Day Percent Change: 1.05% Day Change: 0.46 | |
| Week Change: 1.05% Year-to-date Change: -0.4% | |
| NAPR Links: Profile News Message Board | |
| Charts:- Daily , Weekly | |
| Add NAPR to Watchlist: View: Get Complete NAPR Trend Analysis ➞ | |
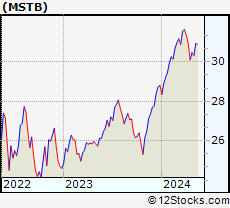 | MSTB LHA Market State Tactical Beta ETF |
| Sector: Financials | |
| SubSector: Exchange Traded Fund | |
| MarketCap: 60157 Millions | |
| Recent Price: 30.12 Smart Investing & Trading Score: 36 | |
| Day Percent Change: 0.05% Day Change: 0.02 | |
| Week Change: 0.05% Year-to-date Change: 4.6% | |
| MSTB Links: Profile News Message Board | |
| Charts:- Daily , Weekly | |
| Add MSTB to Watchlist: View: Get Complete MSTB Trend Analysis ➞ | |
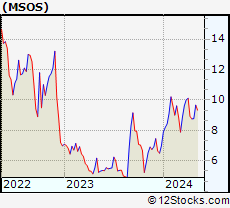 | MSOS AdvisorShares Pure US Cannabis ETF |
| Sector: Financials | |
| SubSector: Exchange Traded Fund | |
| MarketCap: 60157 Millions | |
| Recent Price: 8.57 Smart Investing & Trading Score: 5 | |
| Day Percent Change: -2.17% Day Change: -0.19 | |
| Week Change: -2.17% Year-to-date Change: 22.4% | |
| MSOS Links: Profile News Message Board | |
| Charts:- Daily , Weekly | |
| Add MSOS to Watchlist: View: Get Complete MSOS Trend Analysis ➞ | |
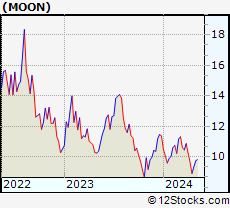 | MOON Direxion Moonshot Innovators ETF |
| Sector: Financials | |
| SubSector: Exchange Traded Fund | |
| MarketCap: 60157 Millions | |
| Recent Price: 8.99 Smart Investing & Trading Score: 25 | |
| Day Percent Change: 1.01% Day Change: 0.09 | |
| Week Change: 1.01% Year-to-date Change: -21.0% | |
| MOON Links: Profile News Message Board | |
| Charts:- Daily , Weekly | |
| Add MOON to Watchlist: View: Get Complete MOON Trend Analysis ➞ | |
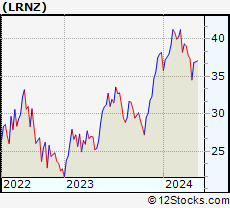 | LRNZ TrueShares Technology, AI and Deep Learning ETF |
| Sector: Financials | |
| SubSector: Exchange Traded Fund | |
| MarketCap: 60157 Millions | |
| Recent Price: 35.12 Smart Investing & Trading Score: 10 | |
| Day Percent Change: 1.70% Day Change: 0.59 | |
| Week Change: 1.7% Year-to-date Change: -8.0% | |
| LRNZ Links: Profile News Message Board | |
| Charts:- Daily , Weekly | |
| Add LRNZ to Watchlist: View: Get Complete LRNZ Trend Analysis ➞ | |
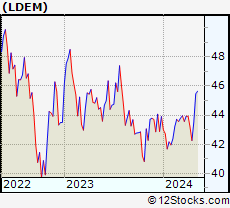 | LDEM iShares ESG MSCI EM Leaders ETF |
| Sector: Financials | |
| SubSector: Exchange Traded Fund | |
| MarketCap: 60157 Millions | |
| Recent Price: 42.73 Smart Investing & Trading Score: 68 | |
| Day Percent Change: 1.12% Day Change: 0.48 | |
| Week Change: 1.12% Year-to-date Change: -2.7% | |
| LDEM Links: Profile News Message Board | |
| Charts:- Daily , Weekly | |
| Add LDEM to Watchlist: View: Get Complete LDEM Trend Analysis ➞ | |
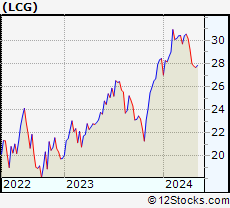 | LCG Sterling Capital Focus Equity ETF |
| Sector: Financials | |
| SubSector: Exchange Traded Fund | |
| MarketCap: 60157 Millions | |
| Recent Price: 28.18 Smart Investing & Trading Score: 17 | |
| Day Percent Change: 0.67% Day Change: 0.19 | |
| Week Change: 0.67% Year-to-date Change: -1.0% | |
| LCG Links: Profile News Message Board | |
| Charts:- Daily , Weekly | |
| Add LCG to Watchlist: View: Get Complete LCG Trend Analysis ➞ | |
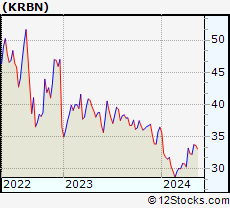 | KRBN KraneShares Trust KFA Global Carbon ETF |
| Sector: Financials | |
| SubSector: Exchange Traded Fund | |
| MarketCap: 60157 Millions | |
| Recent Price: 31.72 Smart Investing & Trading Score: 43 | |
| Day Percent Change: -1.80% Day Change: -0.58 | |
| Week Change: -1.8% Year-to-date Change: -13.0% | |
| KRBN Links: Profile News Message Board | |
| Charts:- Daily , Weekly | |
| Add KRBN to Watchlist: View: Get Complete KRBN Trend Analysis ➞ | |
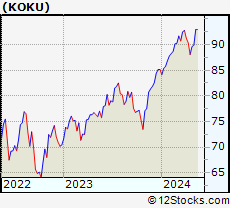 | KOKU Xtrackers MSCI Kokusai Equity ETF |
| Sector: Financials | |
| SubSector: Exchange Traded Fund | |
| MarketCap: 60157 Millions | |
| Recent Price: 88.06 Smart Investing & Trading Score: 36 | |
| Day Percent Change: 0.00% Day Change: 0.00 | |
| Week Change: 0% Year-to-date Change: 3.4% | |
| KOKU Links: Profile News Message Board | |
| Charts:- Daily , Weekly | |
| Add KOKU to Watchlist: View: Get Complete KOKU Trend Analysis ➞ | |
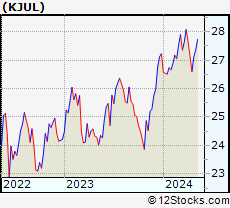 | KJUL Innovator Russell 2000 Power Buffer ETF July |
| Sector: Financials | |
| SubSector: Exchange Traded Fund | |
| MarketCap: 60157 Millions | |
| Recent Price: 26.90 Smart Investing & Trading Score: 58 | |
| Day Percent Change: 1.14% Day Change: 0.30 | |
| Week Change: 1.14% Year-to-date Change: -1.2% | |
| KJUL Links: Profile News Message Board | |
| Charts:- Daily , Weekly | |
| Add KJUL to Watchlist: View: Get Complete KJUL Trend Analysis ➞ | |
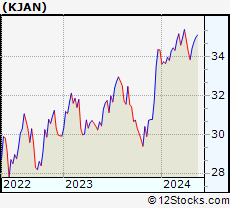 | KJAN Innovator Russell 2000 Power Buffer ETF January |
| Sector: Financials | |
| SubSector: Exchange Traded Fund | |
| MarketCap: 60157 Millions | |
| Recent Price: 34.09 Smart Investing & Trading Score: 58 | |
| Day Percent Change: 0.77% Day Change: 0.26 | |
| Week Change: 0.77% Year-to-date Change: -0.7% | |
| KJAN Links: Profile News Message Board | |
| Charts:- Daily , Weekly | |
| Add KJAN to Watchlist: View: Get Complete KJAN Trend Analysis ➞ | |
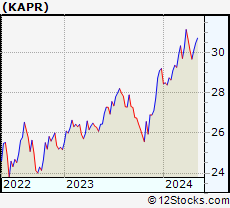 | KAPR Innovator Russell 2000 Power Buffer ETF April |
| Sector: Financials | |
| SubSector: Exchange Traded Fund | |
| MarketCap: 60157 Millions | |
| Recent Price: 29.90 Smart Investing & Trading Score: 68 | |
| Day Percent Change: 0.71% Day Change: 0.21 | |
| Week Change: 0.71% Year-to-date Change: 2.3% | |
| KAPR Links: Profile News Message Board | |
| Charts:- Daily , Weekly | |
| Add KAPR to Watchlist: View: Get Complete KAPR Trend Analysis ➞ | |
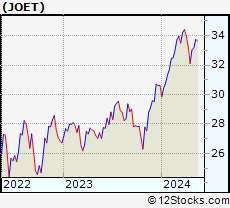 | JOET Virtus Terranova U.S. Quality Momentum ETF |
| Sector: Financials | |
| SubSector: Exchange Traded Fund | |
| MarketCap: 60157 Millions | |
| Recent Price: 32.45 Smart Investing & Trading Score: 51 | |
| Day Percent Change: 1.03% Day Change: 0.33 | |
| Week Change: 1.03% Year-to-date Change: 5.9% | |
| JOET Links: Profile News Message Board | |
| Charts:- Daily , Weekly | |
| Add JOET to Watchlist: View: Get Complete JOET Trend Analysis ➞ | |
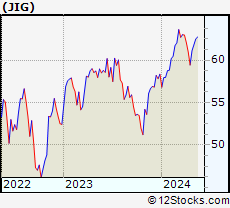 | JIG JPMorgan International Growth ETF |
| Sector: Financials | |
| SubSector: Exchange Traded Fund | |
| MarketCap: 60157 Millions | |
| Recent Price: 60.13 Smart Investing & Trading Score: 51 | |
| Day Percent Change: 1.17% Day Change: 0.69 | |
| Week Change: 1.17% Year-to-date Change: 3.0% | |
| JIG Links: Profile News Message Board | |
| Charts:- Daily , Weekly | |
| Add JIG to Watchlist: View: Get Complete JIG Trend Analysis ➞ | |
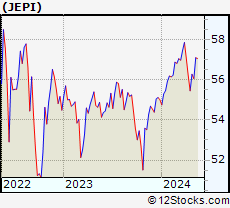 | JEPI JPMorgan Equity Premium Income ETF |
| Sector: Financials | |
| SubSector: Exchange Traded Fund | |
| MarketCap: 60157 Millions | |
| Recent Price: 55.92 Smart Investing & Trading Score: 38 | |
| Day Percent Change: 0.85% Day Change: 0.47 | |
| Week Change: 0.85% Year-to-date Change: 1.7% | |
| JEPI Links: Profile News Message Board | |
| Charts:- Daily , Weekly | |
| Add JEPI to Watchlist: View: Get Complete JEPI Trend Analysis ➞ | |
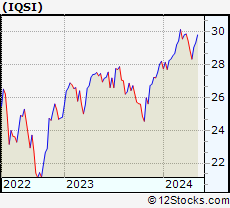 | IQSI IQ Candriam ESG International Equity ETF |
| Sector: Financials | |
| SubSector: Exchange Traded Fund | |
| MarketCap: 60157 Millions | |
| Recent Price: 28.60 Smart Investing & Trading Score: 38 | |
| Day Percent Change: 0.90% Day Change: 0.26 | |
| Week Change: 0.9% Year-to-date Change: 1.4% | |
| IQSI Links: Profile News Message Board | |
| Charts:- Daily , Weekly | |
| Add IQSI to Watchlist: View: Get Complete IQSI Trend Analysis ➞ | |
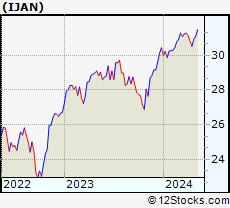 | IJAN Innovator MSCI EAFE Power Buffer ETF January |
| Sector: Financials | |
| SubSector: Exchange Traded Fund | |
| MarketCap: 60157 Millions | |
| Recent Price: 30.64 Smart Investing & Trading Score: 51 | |
| Day Percent Change: 0.38% Day Change: 0.12 | |
| Week Change: 0.38% Year-to-date Change: 0.7% | |
| IJAN Links: Profile News Message Board | |
| Charts:- Daily , Weekly | |
| Add IJAN to Watchlist: View: Get Complete IJAN Trend Analysis ➞ | |
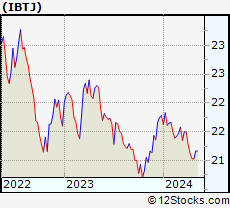 | IBTJ iShares iBonds Dec 2029 Term Treasury ETF |
| Sector: Financials | |
| SubSector: Exchange Traded Fund | |
| MarketCap: 60157 Millions | |
| Recent Price: 21.05 Smart Investing & Trading Score: 18 | |
| Day Percent Change: 0.05% Day Change: 0.01 | |
| Week Change: 0.05% Year-to-date Change: -3.4% | |
| IBTJ Links: Profile News Message Board | |
| Charts:- Daily , Weekly | |
| Add IBTJ to Watchlist: View: Get Complete IBTJ Trend Analysis ➞ | |
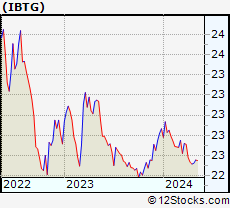 | IBTG iShares iBonds Dec 2026 Term Treasury ETF |
| Sector: Financials | |
| SubSector: Exchange Traded Fund | |
| MarketCap: 60157 Millions | |
| Recent Price: 22.53 Smart Investing & Trading Score: 25 | |
| Day Percent Change: 0.06% Day Change: 0.01 | |
| Week Change: 0.06% Year-to-date Change: -1.5% | |
| IBTG Links: Profile News Message Board | |
| Charts:- Daily , Weekly | |
| Add IBTG to Watchlist: View: Get Complete IBTG Trend Analysis ➞ | |
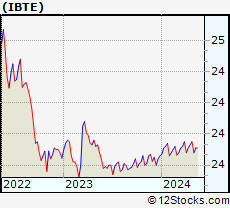 | IBTE iShares iBonds Dec 2024 Term Treasury ETF |
| Sector: Financials | |
| SubSector: Exchange Traded Fund | |
| MarketCap: 60157 Millions | |
| Recent Price: 23.93 Smart Investing & Trading Score: 48 | |
| Day Percent Change: 0.00% Day Change: 0.00 | |
| Week Change: 0% Year-to-date Change: 0.3% | |
| IBTE Links: Profile News Message Board | |
| Charts:- Daily , Weekly | |
| Add IBTE to Watchlist: View: Get Complete IBTE Trend Analysis ➞ | |
| For tabular summary view of above stock list: Summary View ➞ 0 - 25 , 25 - 50 , 50 - 75 , 75 - 100 , 100 - 125 , 125 - 150 , 150 - 175 , 175 - 200 , 200 - 225 , 225 - 250 , 250 - 275 , 275 - 300 , 300 - 325 , 325 - 350 , 350 - 375 , 375 - 400 , 400 - 425 , 425 - 450 , 450 - 475 , 475 - 500 , 500 - 525 , 525 - 550 , 550 - 575 , 575 - 600 , 600 - 625 , 625 - 650 , 650 - 675 , 675 - 700 , 700 - 725 , 725 - 750 , 750 - 775 , 775 - 800 , 800 - 825 , 825 - 850 , 850 - 875 , 875 - 900 , 900 - 925 , 925 - 950 , 950 - 975 , 975 - 1000 , 1000 - 1025 , 1025 - 1050 , 1050 - 1075 , 1075 - 1100 , 1100 - 1125 , 1125 - 1150 , 1150 - 1175 , 1175 - 1200 , 1200 - 1225 , 1225 - 1250 | ||
| Click To Change The Sort Order: By Market Cap or Company Size Performance: Year-to-date, Week and Day | |
| Select Chart Type: | ||
|
Best Stocks Today 12Stocks.com |
© 2024 12Stocks.com Terms & Conditions Privacy Contact Us
All Information Provided Only For Education And Not To Be Used For Investing or Trading. See Terms & Conditions


One More Thing ... Get Best Stocks Delivered Daily!
Never Ever Miss A Move With Our Top Ten Stocks Lists
Find Best Stocks In Any Market - Bull or Bear Market
Take A Peek At Our Top Ten Stocks Lists: Daily, Weekly, Year-to-Date & Top Trends
Find Best Stocks In Any Market - Bull or Bear Market
Take A Peek At Our Top Ten Stocks Lists: Daily, Weekly, Year-to-Date & Top Trends
Financial Stocks With Best Up Trends [0-bearish to 100-bullish]: Grupo Financiero[100], IRSA Inversiones[100], Park National[100], Perella Weinberg[100], Voya Global[100], Goldman Sachs[100], Mercury General[100], Third Coast[100], Capital One[100], Victory Capital[100], HSBC [100]
Best Financial Stocks Year-to-Date:
Root [420.25%], Hippo [125.58%], Gladstone Capital[98.22%], Banco Macro[85.61%], Grupo Financiero[79.67%], Banco BBVA[72.43%], Yiren Digital[59.29%], Grupo Supervielle[52.71%], EverQuote [51.39%], First [51.11%], Fidelis Insurance[50.77%] Best Financial Stocks This Week:
Cipher Mining[18.75%], Grupo Supervielle[12.73%], Iris Energy[11.31%], Banco BBVA[9.45%], Grupo Financiero[9%], Hywin [8.88%], Metropolitan Bank[8.32%], KB [7.94%], B. Riley[7.75%], Fangdd Network[7.74%], Office Properties[7.12%] Best Financial Stocks Daily:
Cipher Mining[18.75%], Grupo Supervielle[12.73%], Iris Energy[11.31%], Banco BBVA[9.45%], Grupo Financiero[9.00%], Hywin [8.88%], Metropolitan Bank[8.32%], KB [7.94%], B. Riley[7.75%], Fangdd Network[7.74%], Office Properties[7.12%]