
 Login Sign Up


| |||||
 |  | ||||

| 12Stocks.com Market Intelligence |
Best Financial Stocks
| In a hurry? Financial Stocks Lists: Performance Trends Table, Stock Charts
Sort Financial stocks: Daily, Weekly, Year-to-Date, Market Cap & Trends. Filter Financial stocks list by size:All Financial Large Mid-Range Small & MicroCap |
| 12Stocks.com Financial Stocks Performances & Trends Daily | |||||||||
|
|  The overall Smart Investing & Trading Score is 70 (0-bearish to 100-bullish) which puts Financial sector in short term neutral to bullish trend. The Smart Investing & Trading Score from previous trading session is 63 and hence an improvement of trend.
| ||||||||
Here are the Smart Investing & Trading Scores of the most requested Financial stocks at 12Stocks.com (click stock name for detailed review):
|


| 12Stocks.com: Investing in Financial sector with Stocks | |
|
The following table helps investors and traders sort through current performance and trends (as measured by Smart Investing & Trading Score) of various
stocks in the Financial sector. Quick View: Move mouse or cursor over stock symbol (ticker) to view short-term Technical chart and over stock name to view long term chart. Click on  to add stock symbol to your watchlist and to add stock symbol to your watchlist and  to view watchlist. Click on any ticker or stock name for detailed market intelligence report for that stock. to view watchlist. Click on any ticker or stock name for detailed market intelligence report for that stock. |
12Stocks.com Performance of Stocks in Financial Sector
| Ticker | Stock Name | Watchlist | Category | Recent Price | Smart Investing & Trading Score | Change % | YTD Change% |
| RMT | Royce Micro-Cap |   | Closed-End Fund - Equity | 8.77 | 32 | 1.50% | -5.09% |
| MCR | MFS Charter | | Closed-End Fund - Debt | 6.13 | 32 | 0.49% | -5.11% |
| USB | U.S. Bancorp | | Regional Banks | 41.05 | 37 | 1.48% | -5.15% |
| MC | Moelis & | | Asset Mgmt | 53.22 | 49 | 3.04% | -5.18% |
| MAA | Mid-America Apartment | | REIT | 127.47 | 76 | 1.10% | -5.20% |
| ECF | Ellsworth Growth | | Asset Mgmt | 7.66 | 25 | 1.19% | -5.20% |
| FHB | First Hawaiian | | Regional Banks | 21.67 | 87 | 3.19% | -5.21% |
| JLL | Jones Lang | | Property Mgmt | 179.02 | 58 | 2.23% | -5.22% |
| SNV | Synovus | | Regional Banks | 35.68 | 22 | 2.21% | -5.23% |
| CNO | CNO | | Insurance | 26.43 | 49 | 0.92% | -5.27% |
| NXP | Nuveen Select | | Closed-End Fund - Debt | 13.99 | 18 | -0.43% | -5.35% |
| NLY | Annaly Capital | | Mortgage | 18.33 | 32 | 0.55% | -5.37% |
| NFJ | AllianzGI NFJ | | Closed-End Fund - Equity | 11.92 | 32 | 1.45% | -5.40% |
| ASGI | Aberdeen Standard | | Exchange Traded Fund | 16.97 | 32 | 0.30% | -5.41% |
| CAF | Morgan Stanley | | Closed-End Fund - Foreign | 12.05 | 45 | 0.17% | -5.42% |
| FUNC | First United | | Regional Banks | 22.23 | 37 | 0.23% | -5.44% |
| VOYA | Voya | | Asset Mgmt | 68.99 | 32 | 0.09% | -5.44% |
| PAGS | PagSeguro Digital | | Credit Services | 11.79 | 32 | 2.70% | -5.45% |
| AAT | American Assets | | REIT - Retail | 21.28 | 74 | 1.38% | -5.46% |
| BTA | BlackRock Long-Term | | Closed-End Fund - Debt | 9.67 | 18 | -0.21% | -5.47% |
| IVR | Invesco Mortgage | | Mortgage | 8.37 | 42 | 1.45% | -5.53% |
| FSD | First Trust | | Closed-End Fund - Debt | 11.42 | 18 | 0.61% | -5.55% |
| PEB | Pebblebrook Hotel | | REIT | 15.08 | 32 | 3.08% | -5.63% |
| AX | Axos | | S&L | 51.51 | 69 | 2.41% | -5.66% |
| AWP | Aberdeen Global | | Closed-End Fund - Foreign | 3.66 | 42 | 1.67% | -5.67% |
| For chart view version of above stock list: Chart View ➞ 0 - 25 , 25 - 50 , 50 - 75 , 75 - 100 , 100 - 125 , 125 - 150 , 150 - 175 , 175 - 200 , 200 - 225 , 225 - 250 , 250 - 275 , 275 - 300 , 300 - 325 , 325 - 350 , 350 - 375 , 375 - 400 , 400 - 425 , 425 - 450 , 450 - 475 , 475 - 500 , 500 - 525 , 525 - 550 , 550 - 575 , 575 - 600 , 600 - 625 , 625 - 650 , 650 - 675 , 675 - 700 , 700 - 725 , 725 - 750 , 750 - 775 , 775 - 800 , 800 - 825 , 825 - 850 , 850 - 875 , 875 - 900 , 900 - 925 , 925 - 950 , 950 - 975 , 975 - 1000 , 1000 - 1025 , 1025 - 1050 , 1050 - 1075 , 1075 - 1100 , 1100 - 1125 , 1125 - 1150 , 1150 - 1175 , 1175 - 1200 , 1200 - 1225 , 1225 - 1250 | ||
 | Click To Change The Sort Order: By Market Cap or Company Size Performance: Year-to-date, Week and Day |  |
|
Get the most comprehensive stock market coverage daily at 12Stocks.com ➞ Best Stocks Today ➞ Best Stocks Weekly ➞ Best Stocks Year-to-Date ➞ Best Stocks Trends ➞  Best Stocks Today 12Stocks.com Best Nasdaq Stocks ➞ Best S&P 500 Stocks ➞ Best Tech Stocks ➞ Best Biotech Stocks ➞ |
| Detailed Overview of Financial Stocks |
| Financial Technical Overview, Leaders & Laggards, Top Financial ETF Funds & Detailed Financial Stocks List, Charts, Trends & More |
| Financial Sector: Technical Analysis, Trends & YTD Performance | |
| Financial sector is composed of stocks
from banks, brokers, insurance, REITs
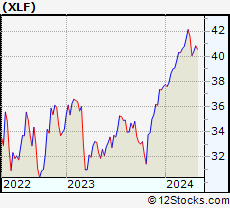
and services subsectors. Financial sector, as represented by XLF, an exchange-traded fund [ETF] that holds basket of Financial stocks (e.g, Bank of America, Goldman Sachs) is up by 8.7% and is currently outperforming the overall market by 4.31% year-to-date. Below is a quick view of Technical charts and trends: |
|
 XLF Weekly Chart |
|
| Long Term Trend: Very Good | |
| Medium Term Trend: Not Good | |
 XLF Daily Chart |
|
| Short Term Trend: Very Good | |
| Overall Trend Score: 70 | |
| YTD Performance: 8.7% | |
| **Trend Scores & Views Are Only For Educational Purposes And Not For Investing | |
| 12Stocks.com: Top Performing Financial Sector Stocks | ||||||||||||||||||||||||||||||||||||||||||||||||
 The top performing Financial sector stocks year to date are
Now, more recently, over last week, the top performing Financial sector stocks on the move are


|
||||||||||||||||||||||||||||||||||||||||||||||||
| 12Stocks.com: Investing in Financial Sector using Exchange Traded Funds | |
|
The following table shows list of key exchange traded funds (ETF) that
help investors track Financial Index. For detailed view, check out our ETF Funds section of our website. Quick View: Move mouse or cursor over ETF symbol (ticker) to view short-term Technical chart and over ETF name to view long term chart. Click on ticker or stock name for detailed view. Click on to add stock symbol to your watchlist and to view watchlist. |
12Stocks.com List of ETFs that track Financial Index
| Ticker | ETF Name | Watchlist | Recent Price | Smart Investing & Trading Score | Change % | Week % | Year-to-date % |
| XLF | Financial | | 40.87 | 70 | 1.21 | 1.21 | 8.7% |
| IAI | Broker-Dealers & Secs | | 112.88 | 75 | 1.67 | 1.67 | 4.01% |
| IYF | Financials | | 92.67 | 75 | 1.50 | 1.5 | 8.5% |
| IYG | Financial Services | | 64.37 | 75 | 1.50 | 1.5 | 7.76% |
| KRE | Regional Banking | | 47.73 | 59 | 0.88 | 0.88 | -8.95% |
| IXG | Global Financials | | 84.00 | 70 | 1.38 | 1.38 | 6.91% |
| VFH | Financials | | 98.31 | 63 | 0.57 | 0.57 | 6.56% |
| KBE | Bank | | 45.17 | 93 | 1.71 | 1.71 | -1.85% |
| FAS | Financial Bull 3X | | 101.59 | 75 | 3.74 | 3.74 | 22.92% |
| FAZ | Financial Bear 3X | | 10.77 | 25 | -3.84 | -3.84 | -21.21% |
| UYG | Financials | | 63.88 | 70 | 2.31 | 2.31 | 15.72% |
| IAT | Regional Banks | | 41.55 | 93 | 1.99 | 1.99 | -0.69% |
| KIE | Insurance | | 49.46 | 65 | 0.77 | 0.77 | 9.38% |
| PSCF | SmallCap Financials | | 46.24 | 59 | 1.69 | 1.69 | -5.98% |
| EUFN | Europe Financials | | 22.16 | 70 | 0.96 | 0.96 | 5.73% |
| PGF | Financial Preferred | | 14.52 | 18 | -0.07 | -0.07 | -0.41% |
| 12Stocks.com: Charts, Trends, Fundamental Data and Performances of Financial Stocks | |
|
We now take in-depth look at all Financial stocks including charts, multi-period performances and overall trends (as measured by Smart Investing & Trading Score). One can sort Financial stocks (click link to choose) by Daily, Weekly and by Year-to-Date performances. Also, one can sort by size of the company or by market capitalization. |
| Select Your Default Chart Type: | |||||
| |||||
| Click on stock symbol or name for detailed view. Click on to add stock symbol to your watchlist and to view watchlist. Quick View: Move mouse or cursor over "Daily" to quickly view daily Technical stock chart and over "Weekly" to view weekly Technical stock chart. | |||||

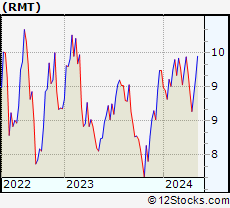 | RMT Royce Micro-Cap Trust, Inc. |
| Sector: Financials | |
| SubSector: Closed-End Fund - Equity | |
| MarketCap: 195.647 Millions | |
| Recent Price: 8.77 Smart Investing & Trading Score: 32 | |
| Day Percent Change: 1.50% Day Change: 0.13 | |
| Week Change: 1.5% Year-to-date Change: -5.1% | |
| RMT Links: Profile News Message Board | |
| Charts:- Daily , Weekly | |
| Add RMT to Watchlist: View: Get Complete RMT Trend Analysis ➞ | |
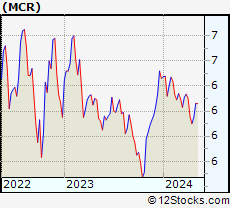 | MCR MFS Charter Income Trust |
| Sector: Financials | |
| SubSector: Closed-End Fund - Debt | |
| MarketCap: 282.807 Millions | |
| Recent Price: 6.13 Smart Investing & Trading Score: 32 | |
| Day Percent Change: 0.49% Day Change: 0.03 | |
| Week Change: 0.49% Year-to-date Change: -5.1% | |
| MCR Links: Profile News Message Board | |
| Charts:- Daily , Weekly | |
| Add MCR to Watchlist: View: Get Complete MCR Trend Analysis ➞ | |
 | USB U.S. Bancorp |
| Sector: Financials | |
| SubSector: Regional - Midwest Banks | |
| MarketCap: 56757.8 Millions | |
| Recent Price: 41.05 Smart Investing & Trading Score: 37 | |
| Day Percent Change: 1.48% Day Change: 0.60 | |
| Week Change: 1.48% Year-to-date Change: -5.2% | |
| USB Links: Profile News Message Board | |
| Charts:- Daily , Weekly | |
| Add USB to Watchlist: View: Get Complete USB Trend Analysis ➞ | |
 | MC Moelis & Company |
| Sector: Financials | |
| SubSector: Asset Management | |
| MarketCap: 1675.93 Millions | |
| Recent Price: 53.22 Smart Investing & Trading Score: 49 | |
| Day Percent Change: 3.04% Day Change: 1.57 | |
| Week Change: 3.04% Year-to-date Change: -5.2% | |
| MC Links: Profile News Message Board | |
| Charts:- Daily , Weekly | |
| Add MC to Watchlist: View: Get Complete MC Trend Analysis ➞ | |
 | MAA Mid-America Apartment Communities, Inc. |
| Sector: Financials | |
| SubSector: REIT - Residential | |
| MarketCap: 11385.5 Millions | |
| Recent Price: 127.47 Smart Investing & Trading Score: 76 | |
| Day Percent Change: 1.10% Day Change: 1.39 | |
| Week Change: 1.1% Year-to-date Change: -5.2% | |
| MAA Links: Profile News Message Board | |
| Charts:- Daily , Weekly | |
| Add MAA to Watchlist: View: Get Complete MAA Trend Analysis ➞ | |
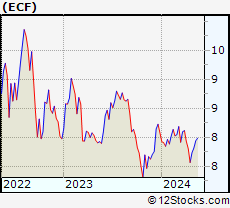 | ECF Ellsworth Growth and Income Fund Ltd. |
| Sector: Financials | |
| SubSector: Asset Management | |
| MarketCap: 102.203 Millions | |
| Recent Price: 7.66 Smart Investing & Trading Score: 25 | |
| Day Percent Change: 1.19% Day Change: 0.09 | |
| Week Change: 1.19% Year-to-date Change: -5.2% | |
| ECF Links: Profile News Message Board | |
| Charts:- Daily , Weekly | |
| Add ECF to Watchlist: View: Get Complete ECF Trend Analysis ➞ | |
 | FHB First Hawaiian, Inc. |
| Sector: Financials | |
| SubSector: Regional - Pacific Banks | |
| MarketCap: 2398.99 Millions | |
| Recent Price: 21.67 Smart Investing & Trading Score: 87 | |
| Day Percent Change: 3.19% Day Change: 0.67 | |
| Week Change: 3.19% Year-to-date Change: -5.2% | |
| FHB Links: Profile News Message Board | |
| Charts:- Daily , Weekly | |
| Add FHB to Watchlist: View: Get Complete FHB Trend Analysis ➞ | |
 | JLL Jones Lang LaSalle Incorporated |
| Sector: Financials | |
| SubSector: Property Management | |
| MarketCap: 5259.32 Millions | |
| Recent Price: 179.02 Smart Investing & Trading Score: 58 | |
| Day Percent Change: 2.23% Day Change: 3.91 | |
| Week Change: 2.23% Year-to-date Change: -5.2% | |
| JLL Links: Profile News Message Board | |
| Charts:- Daily , Weekly | |
| Add JLL to Watchlist: View: Get Complete JLL Trend Analysis ➞ | |
 | SNV Synovus Financial Corp. |
| Sector: Financials | |
| SubSector: Regional - Mid-Atlantic Banks | |
| MarketCap: 2697.29 Millions | |
| Recent Price: 35.68 Smart Investing & Trading Score: 22 | |
| Day Percent Change: 2.21% Day Change: 0.77 | |
| Week Change: 2.21% Year-to-date Change: -5.2% | |
| SNV Links: Profile News Message Board | |
| Charts:- Daily , Weekly | |
| Add SNV to Watchlist: View: Get Complete SNV Trend Analysis ➞ | |
 | CNO CNO Financial Group, Inc. |
| Sector: Financials | |
| SubSector: Accident & Health Insurance | |
| MarketCap: 1746.9 Millions | |
| Recent Price: 26.43 Smart Investing & Trading Score: 49 | |
| Day Percent Change: 0.92% Day Change: 0.24 | |
| Week Change: 0.92% Year-to-date Change: -5.3% | |
| CNO Links: Profile News Message Board | |
| Charts:- Daily , Weekly | |
| Add CNO to Watchlist: View: Get Complete CNO Trend Analysis ➞ | |
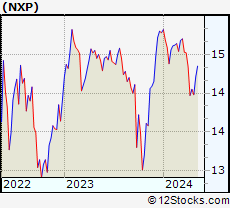 | NXP Nuveen Select Tax-Free Income Portfolio |
| Sector: Financials | |
| SubSector: Closed-End Fund - Debt | |
| MarketCap: 231.907 Millions | |
| Recent Price: 13.99 Smart Investing & Trading Score: 18 | |
| Day Percent Change: -0.43% Day Change: -0.06 | |
| Week Change: -0.43% Year-to-date Change: -5.4% | |
| NXP Links: Profile News Message Board | |
| Charts:- Daily , Weekly | |
| Add NXP to Watchlist: View: Get Complete NXP Trend Analysis ➞ | |
 | NLY Annaly Capital Management, Inc. |
| Sector: Financials | |
| SubSector: Mortgage Investment | |
| MarketCap: 9127.79 Millions | |
| Recent Price: 18.33 Smart Investing & Trading Score: 32 | |
| Day Percent Change: 0.55% Day Change: 0.10 | |
| Week Change: 0.55% Year-to-date Change: -5.4% | |
| NLY Links: Profile News Message Board | |
| Charts:- Daily , Weekly | |
| Add NLY to Watchlist: View: Get Complete NLY Trend Analysis ➞ | |
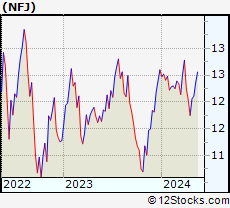 | NFJ AllianzGI NFJ Dividend, Interest & Premium Strategy Fund |
| Sector: Financials | |
| SubSector: Closed-End Fund - Equity | |
| MarketCap: 783.047 Millions | |
| Recent Price: 11.92 Smart Investing & Trading Score: 32 | |
| Day Percent Change: 1.45% Day Change: 0.17 | |
| Week Change: 1.45% Year-to-date Change: -5.4% | |
| NFJ Links: Profile News Message Board | |
| Charts:- Daily , Weekly | |
| Add NFJ to Watchlist: View: Get Complete NFJ Trend Analysis ➞ | |
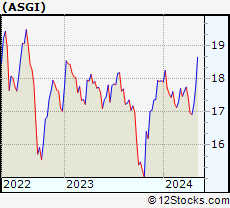 | ASGI Aberdeen Standard Global Infrastructure Income Fund |
| Sector: Financials | |
| SubSector: Exchange Traded Fund | |
| MarketCap: 60157 Millions | |
| Recent Price: 16.97 Smart Investing & Trading Score: 32 | |
| Day Percent Change: 0.30% Day Change: 0.05 | |
| Week Change: 0.3% Year-to-date Change: -5.4% | |
| ASGI Links: Profile News Message Board | |
| Charts:- Daily , Weekly | |
| Add ASGI to Watchlist: View: Get Complete ASGI Trend Analysis ➞ | |
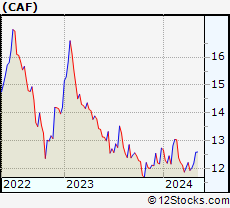 | CAF Morgan Stanley China A Share Fund, Inc. |
| Sector: Financials | |
| SubSector: Closed-End Fund - Foreign | |
| MarketCap: 354.447 Millions | |
| Recent Price: 12.05 Smart Investing & Trading Score: 45 | |
| Day Percent Change: 0.17% Day Change: 0.02 | |
| Week Change: 0.17% Year-to-date Change: -5.4% | |
| CAF Links: Profile News Message Board | |
| Charts:- Daily , Weekly | |
| Add CAF to Watchlist: View: Get Complete CAF Trend Analysis ➞ | |
 | FUNC First United Corporation |
| Sector: Financials | |
| SubSector: Regional - Mid-Atlantic Banks | |
| MarketCap: 106.859 Millions | |
| Recent Price: 22.23 Smart Investing & Trading Score: 37 | |
| Day Percent Change: 0.23% Day Change: 0.05 | |
| Week Change: 0.23% Year-to-date Change: -5.4% | |
| FUNC Links: Profile News Message Board | |
| Charts:- Daily , Weekly | |
| Add FUNC to Watchlist: View: Get Complete FUNC Trend Analysis ➞ | |
 | VOYA Voya Financial, Inc. |
| Sector: Financials | |
| SubSector: Asset Management | |
| MarketCap: 4771.23 Millions | |
| Recent Price: 68.99 Smart Investing & Trading Score: 32 | |
| Day Percent Change: 0.09% Day Change: 0.06 | |
| Week Change: 0.09% Year-to-date Change: -5.4% | |
| VOYA Links: Profile News Message Board | |
| Charts:- Daily , Weekly | |
| Add VOYA to Watchlist: View: Get Complete VOYA Trend Analysis ➞ | |
 | PAGS PagSeguro Digital Ltd. |
| Sector: Financials | |
| SubSector: Credit Services | |
| MarketCap: 6500.78 Millions | |
| Recent Price: 11.79 Smart Investing & Trading Score: 32 | |
| Day Percent Change: 2.70% Day Change: 0.31 | |
| Week Change: 2.7% Year-to-date Change: -5.5% | |
| PAGS Links: Profile News Message Board | |
| Charts:- Daily , Weekly | |
| Add PAGS to Watchlist: View: Get Complete PAGS Trend Analysis ➞ | |
 | AAT American Assets Trust, Inc. |
| Sector: Financials | |
| SubSector: REIT - Retail | |
| MarketCap: 1580.54 Millions | |
| Recent Price: 21.28 Smart Investing & Trading Score: 74 | |
| Day Percent Change: 1.38% Day Change: 0.29 | |
| Week Change: 1.38% Year-to-date Change: -5.5% | |
| AAT Links: Profile News Message Board | |
| Charts:- Daily , Weekly | |
| Add AAT to Watchlist: View: Get Complete AAT Trend Analysis ➞ | |
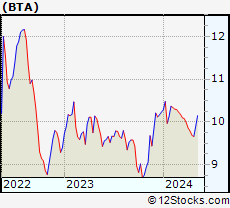 | BTA BlackRock Long-Term Municipal Advantage Trust |
| Sector: Financials | |
| SubSector: Closed-End Fund - Debt | |
| MarketCap: 133.907 Millions | |
| Recent Price: 9.67 Smart Investing & Trading Score: 18 | |
| Day Percent Change: -0.21% Day Change: -0.02 | |
| Week Change: -0.21% Year-to-date Change: -5.5% | |
| BTA Links: Profile News Message Board | |
| Charts:- Daily , Weekly | |
| Add BTA to Watchlist: View: Get Complete BTA Trend Analysis ➞ | |
 | IVR Invesco Mortgage Capital Inc. |
| Sector: Financials | |
| SubSector: Mortgage Investment | |
| MarketCap: 1182.19 Millions | |
| Recent Price: 8.37 Smart Investing & Trading Score: 42 | |
| Day Percent Change: 1.45% Day Change: 0.12 | |
| Week Change: 1.45% Year-to-date Change: -5.5% | |
| IVR Links: Profile News Message Board | |
| Charts:- Daily , Weekly | |
| Add IVR to Watchlist: View: Get Complete IVR Trend Analysis ➞ | |
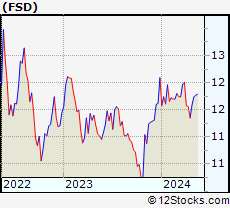 | FSD First Trust High Income Long/Short Fund |
| Sector: Financials | |
| SubSector: Closed-End Fund - Debt | |
| MarketCap: 362.607 Millions | |
| Recent Price: 11.42 Smart Investing & Trading Score: 18 | |
| Day Percent Change: 0.61% Day Change: 0.07 | |
| Week Change: 0.61% Year-to-date Change: -5.6% | |
| FSD Links: Profile News Message Board | |
| Charts:- Daily , Weekly | |
| Add FSD to Watchlist: View: Get Complete FSD Trend Analysis ➞ | |
 | PEB Pebblebrook Hotel Trust |
| Sector: Financials | |
| SubSector: REIT - Hotel/Motel | |
| MarketCap: 1472.84 Millions | |
| Recent Price: 15.08 Smart Investing & Trading Score: 32 | |
| Day Percent Change: 3.08% Day Change: 0.45 | |
| Week Change: 3.08% Year-to-date Change: -5.6% | |
| PEB Links: Profile News Message Board | |
| Charts:- Daily , Weekly | |
| Add PEB to Watchlist: View: Get Complete PEB Trend Analysis ➞ | |
 | AX Axos Financial, Inc. |
| Sector: Financials | |
| SubSector: Savings & Loans | |
| MarketCap: 1037.3 Millions | |
| Recent Price: 51.51 Smart Investing & Trading Score: 69 | |
| Day Percent Change: 2.41% Day Change: 1.21 | |
| Week Change: 2.41% Year-to-date Change: -5.7% | |
| AX Links: Profile News Message Board | |
| Charts:- Daily , Weekly | |
| Add AX to Watchlist: View: Get Complete AX Trend Analysis ➞ | |
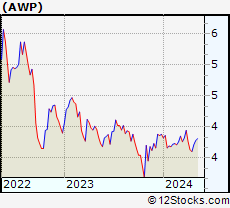 | AWP Aberdeen Global Premier Properties Fund |
| Sector: Financials | |
| SubSector: Closed-End Fund - Foreign | |
| MarketCap: 313.447 Millions | |
| Recent Price: 3.66 Smart Investing & Trading Score: 42 | |
| Day Percent Change: 1.67% Day Change: 0.06 | |
| Week Change: 1.67% Year-to-date Change: -5.7% | |
| AWP Links: Profile News Message Board | |
| Charts:- Daily , Weekly | |
| Add AWP to Watchlist: View: Get Complete AWP Trend Analysis ➞ | |
| For tabular summary view of above stock list: Summary View ➞ 0 - 25 , 25 - 50 , 50 - 75 , 75 - 100 , 100 - 125 , 125 - 150 , 150 - 175 , 175 - 200 , 200 - 225 , 225 - 250 , 250 - 275 , 275 - 300 , 300 - 325 , 325 - 350 , 350 - 375 , 375 - 400 , 400 - 425 , 425 - 450 , 450 - 475 , 475 - 500 , 500 - 525 , 525 - 550 , 550 - 575 , 575 - 600 , 600 - 625 , 625 - 650 , 650 - 675 , 675 - 700 , 700 - 725 , 725 - 750 , 750 - 775 , 775 - 800 , 800 - 825 , 825 - 850 , 850 - 875 , 875 - 900 , 900 - 925 , 925 - 950 , 950 - 975 , 975 - 1000 , 1000 - 1025 , 1025 - 1050 , 1050 - 1075 , 1075 - 1100 , 1100 - 1125 , 1125 - 1150 , 1150 - 1175 , 1175 - 1200 , 1200 - 1225 , 1225 - 1250 | ||
| Click To Change The Sort Order: By Market Cap or Company Size Performance: Year-to-date, Week and Day | |
| Select Chart Type: | ||
|
Best Stocks Today 12Stocks.com |
© 2024 12Stocks.com Terms & Conditions Privacy Contact Us
All Information Provided Only For Education And Not To Be Used For Investing or Trading. See Terms & Conditions


One More Thing ... Get Best Stocks Delivered Daily!
Never Ever Miss A Move With Our Top Ten Stocks Lists
Find Best Stocks In Any Market - Bull or Bear Market
Take A Peek At Our Top Ten Stocks Lists: Daily, Weekly, Year-to-Date & Top Trends
Find Best Stocks In Any Market - Bull or Bear Market
Take A Peek At Our Top Ten Stocks Lists: Daily, Weekly, Year-to-Date & Top Trends
Financial Stocks With Best Up Trends [0-bearish to 100-bullish]: Grupo Financiero[100], IRSA Inversiones[100], Park National[100], Perella Weinberg[100], Voya Global[100], Goldman Sachs[100], Mercury General[100], Third Coast[100], Capital One[100], Victory Capital[100], HSBC [100]
Best Financial Stocks Year-to-Date:
Root [420.25%], Hippo [125.58%], Gladstone Capital[98.22%], Banco Macro[85.61%], Grupo Financiero[79.67%], Banco BBVA[72.43%], Yiren Digital[59.29%], Grupo Supervielle[52.71%], EverQuote [51.39%], First [51.11%], Fidelis Insurance[50.77%] Best Financial Stocks This Week:
Cipher Mining[18.75%], Grupo Supervielle[12.73%], Iris Energy[11.31%], Banco BBVA[9.45%], Grupo Financiero[9%], Hywin [8.88%], Metropolitan Bank[8.32%], KB [7.94%], B. Riley[7.75%], Fangdd Network[7.74%], Office Properties[7.12%] Best Financial Stocks Daily:
Cipher Mining[18.75%], Grupo Supervielle[12.73%], Iris Energy[11.31%], Banco BBVA[9.45%], Grupo Financiero[9.00%], Hywin [8.88%], Metropolitan Bank[8.32%], KB [7.94%], B. Riley[7.75%], Fangdd Network[7.74%], Office Properties[7.12%]