
 Login Sign Up


| |||||
 |  | ||||

| 12Stocks.com Market Intelligence |
Best Financial Stocks
| In a hurry? Financial Stocks Lists: Performance Trends Table, Stock Charts
Sort Financial stocks: Daily, Weekly, Year-to-Date, Market Cap & Trends. Filter Financial stocks list by size:All Financial Large Mid-Range Small & MicroCap |
| 12Stocks.com Financial Stocks Performances & Trends Daily | |||||||||
|
|  The overall Smart Investing & Trading Score is 56 (0-bearish to 100-bullish) which puts Financial sector in short term neutral trend. The Smart Investing & Trading Score from previous trading session is 36 and hence an improvement of trend.
| ||||||||
Here are the Smart Investing & Trading Scores of the most requested Financial stocks at 12Stocks.com (click stock name for detailed review):
|


| 12Stocks.com: Investing in Financial sector with Stocks | |
|
The following table helps investors and traders sort through current performance and trends (as measured by Smart Investing & Trading Score) of various
stocks in the Financial sector. Quick View: Move mouse or cursor over stock symbol (ticker) to view short-term Technical chart and over stock name to view long term chart. Click on  to add stock symbol to your watchlist and to add stock symbol to your watchlist and  to view watchlist. Click on any ticker or stock name for detailed market intelligence report for that stock. to view watchlist. Click on any ticker or stock name for detailed market intelligence report for that stock. |
12Stocks.com Performance of Stocks in Financial Sector
| Ticker | Stock Name | Watchlist | Category | Recent Price | Smart Investing & Trading Score | Change % | Weekly Change% |
| JRI | Nuveen Real |   | Closed-End Fund - Equity | 10.90 | 10 | -0.73% | -1.89% |
| AEF | Aberdeen Emerging | | Asset Mgmt | 4.87 | 36 | -0.39% | -1.89% |
| GHY | PGIM Global | | Closed-End Fund - Debt | 11.16 | 10 | -0.04% | -1.89% |
| USXF | iShares ESG | | Exchange Traded Fund | 42.52 | 51 | 0.45% | -1.89% |
| TEI | Templeton Emerging | | Closed-End Fund - Debt | 5.17 | 15 | 0.39% | -1.90% |
| PFIS | Peoples | | Regional Banks | 36.67 | 18 | -0.99% | -1.91% |
| TCHP | T. Rowe | | Exchange Traded Fund | 34.39 | 44 | 0.31% | -1.92% |
| AIZ | Assurant | | Insurance | 170.84 | 43 | 0.44% | -1.93% |
| OHI | Omega Healthcare | | REIT | 29.91 | 36 | -0.17% | -1.93% |
| BCBP | BCB Bancorp | | Regional Banks | 9.59 | 30 | 3.01% | -1.94% |
| KJUL | Innovator Russell | | Exchange Traded Fund | 26.62 | 23 | -0.11% | -1.94% |
| FBP | First Ban | | Foreign Banks | 16.32 | 25 | 0.21% | -1.95% |
| HTH | Hilltop | | Mortgage | 28.95 | 18 | 1.06% | -1.95% |
| HLI | Houlihan Lokey | | Brokerage | 122.61 | 44 | -0.18% | -1.95% |
| FHI | Federated Hermes | | Asset Mgmt | 35.03 | 33 | -0.14% | -1.96% |
| PMT | PennyMac Mortgage | | Mortgage | 13.29 | 25 | 0.42% | -1.96% |
| LMND | Lemonade | | Insurance Property & Casualty | 16.45 | 63 | 4.51% | -1.97% |
| TRMK | Trustmark | | Regional Banks | 25.68 | 28 | 0.86% | -1.98% |
| BEKE | KE | | Real Estate Services | 12.90 | 25 | 0.16% | -1.98% |
| WABC | Westamerica Ban | | Regional Banks | 45.69 | 40 | 0.42% | -1.99% |
| BWG | Legg Mason | | Closed-End Fund - Debt | 7.98 | 10 | 0.74% | -1.99% |
| NDAQ | Nasdaq | | Investments | 60.29 | 61 | 0.47% | -2.00% |
| GDV | Gabelli Dividend | | Closed-End Fund - Equity | 21.52 | 28 | -0.23% | -2.00% |
| RWT | Redwood Trust | | Mortgage | 5.62 | 25 | 1.91% | -2.01% |
| BEN | Franklin Resources | | Asset Mgmt | 24.90 | 18 | 0.36% | -2.01% |
| For chart view version of above stock list: Chart View ➞ 0 - 25 , 25 - 50 , 50 - 75 , 75 - 100 , 100 - 125 , 125 - 150 , 150 - 175 , 175 - 200 , 200 - 225 , 225 - 250 , 250 - 275 , 275 - 300 , 300 - 325 , 325 - 350 , 350 - 375 , 375 - 400 , 400 - 425 , 425 - 450 , 450 - 475 , 475 - 500 , 500 - 525 , 525 - 550 , 550 - 575 , 575 - 600 , 600 - 625 , 625 - 650 , 650 - 675 , 675 - 700 , 700 - 725 , 725 - 750 , 750 - 775 , 775 - 800 , 800 - 825 , 825 - 850 , 850 - 875 , 875 - 900 , 900 - 925 , 925 - 950 , 950 - 975 , 975 - 1000 , 1000 - 1025 , 1025 - 1050 , 1050 - 1075 , 1075 - 1100 , 1100 - 1125 , 1125 - 1150 , 1150 - 1175 , 1175 - 1200 , 1200 - 1225 , 1225 - 1250 | ||
 | Click To Change The Sort Order: By Market Cap or Company Size Performance: Year-to-date, Week and Day |  |
|
Get the most comprehensive stock market coverage daily at 12Stocks.com ➞ Best Stocks Today ➞ Best Stocks Weekly ➞ Best Stocks Year-to-Date ➞ Best Stocks Trends ➞  Best Stocks Today 12Stocks.com Best Nasdaq Stocks ➞ Best S&P 500 Stocks ➞ Best Tech Stocks ➞ Best Biotech Stocks ➞ |
| Detailed Overview of Financial Stocks |
| Financial Technical Overview, Leaders & Laggards, Top Financial ETF Funds & Detailed Financial Stocks List, Charts, Trends & More |
| Financial Sector: Technical Analysis, Trends & YTD Performance | |
| Financial sector is composed of stocks
from banks, brokers, insurance, REITs
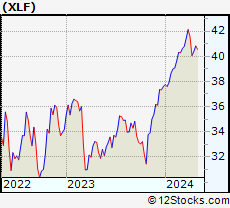
and services subsectors. Financial sector, as represented by XLF, an exchange-traded fund [ETF] that holds basket of Financial stocks (e.g, Bank of America, Goldman Sachs) is up by 5.97% and is currently outperforming the overall market by 1.94% year-to-date. Below is a quick view of Technical charts and trends: |
|
 XLF Weekly Chart |
|
| Long Term Trend: Good | |
| Medium Term Trend: Not Good | |
 XLF Daily Chart |
|
| Short Term Trend: Very Good | |
| Overall Trend Score: 56 | |
| YTD Performance: 5.97% | |
| **Trend Scores & Views Are Only For Educational Purposes And Not For Investing | |
| 12Stocks.com: Top Performing Financial Sector Stocks | ||||||||||||||||||||||||||||||||||||||||||||||||
 The top performing Financial sector stocks year to date are
Now, more recently, over last week, the top performing Financial sector stocks on the move are


|
||||||||||||||||||||||||||||||||||||||||||||||||
| 12Stocks.com: Investing in Financial Sector using Exchange Traded Funds | |
|
The following table shows list of key exchange traded funds (ETF) that
help investors track Financial Index. For detailed view, check out our ETF Funds section of our website. Quick View: Move mouse or cursor over ETF symbol (ticker) to view short-term Technical chart and over ETF name to view long term chart. Click on ticker or stock name for detailed view. Click on to add stock symbol to your watchlist and to view watchlist. |
12Stocks.com List of ETFs that track Financial Index
| Ticker | ETF Name | Watchlist | Recent Price | Smart Investing & Trading Score | Change % | Week % | Year-to-date % |
| XLF | Financial | | 39.84 | 56 | 0.39 | -0.54 | 5.97% |
| IAI | Broker-Dealers & Secs | | 110.49 | 63 | 0.13 | -0.31 | 1.81% |
| IYF | Financials | | 89.95 | 48 | 0.51 | -0.66 | 5.32% |
| IYG | Financial Services | | 62.53 | 49 | 0.08 | -1.08 | 4.68% |
| KRE | Regional Banking | | 45.99 | 28 | 0.35 | -1.14 | -12.28% |
| IXG | Global Financials | | 82.26 | 36 | 0.37 | -0.48 | 4.69% |
| VFH | Financials | | 96.24 | 56 | 0.22 | -0.97 | 4.31% |
| KBE | Bank | | 43.27 | 25 | 0.39 | -1.19 | -5.98% |
| FAS | Financial Bull 3X | | 94.03 | 63 | 0.88 | -2.28 | 13.77% |
| FAZ | Financial Bear 3X | | 11.70 | 32 | -0.51 | 2.54 | -14.41% |
| UYG | Financials | | 60.67 | 63 | 0.57 | -1.29 | 9.92% |
| IAT | Regional Banks | | 39.60 | 20 | -0.08 | -2.08 | -5.35% |
| KIE | Insurance | | 48.11 | 58 | 0.82 | -0.43 | 6.39% |
| PSCF | SmallCap Financials | | 44.94 | 15 | 0.18 | -1.03 | -8.62% |
| EUFN | Europe Financials | | 21.88 | 56 | 0.30 | -0.07 | 4.37% |
| PGF | Financial Preferred | | 14.44 | 18 | -0.38 | -1.67 | -0.99% |
| 12Stocks.com: Charts, Trends, Fundamental Data and Performances of Financial Stocks | |
|
We now take in-depth look at all Financial stocks including charts, multi-period performances and overall trends (as measured by Smart Investing & Trading Score). One can sort Financial stocks (click link to choose) by Daily, Weekly and by Year-to-Date performances. Also, one can sort by size of the company or by market capitalization. |
| Select Your Default Chart Type: | |||||
| |||||
| Click on stock symbol or name for detailed view. Click on to add stock symbol to your watchlist and to view watchlist. Quick View: Move mouse or cursor over "Daily" to quickly view daily Technical stock chart and over "Weekly" to view weekly Technical stock chart. | |||||

 | JRI Nuveen Real Asset Income and Growth Fund |
| Sector: Financials | |
| SubSector: Closed-End Fund - Equity | |
| MarketCap: 239.247 Millions | |
| Recent Price: 10.90 Smart Investing & Trading Score: 10 | |
| Day Percent Change: -0.73% Day Change: -0.08 | |
| Week Change: -1.89% Year-to-date Change: -7.0% | |
| JRI Links: Profile News Message Board | |
| Charts:- Daily , Weekly | |
| Add JRI to Watchlist: View: Get Complete JRI Trend Analysis ➞ | |
 | AEF Aberdeen Emerging Markets Equity Income Fund, Inc. |
| Sector: Financials | |
| SubSector: Asset Management | |
| MarketCap: 245.803 Millions | |
| Recent Price: 4.87 Smart Investing & Trading Score: 36 | |
| Day Percent Change: -0.39% Day Change: -0.02 | |
| Week Change: -1.89% Year-to-date Change: -4.7% | |
| AEF Links: Profile News Message Board | |
| Charts:- Daily , Weekly | |
| Add AEF to Watchlist: View: Get Complete AEF Trend Analysis ➞ | |
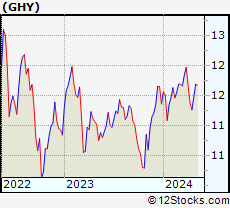 | GHY PGIM Global High Yield Fund, Inc |
| Sector: Financials | |
| SubSector: Closed-End Fund - Debt | |
| MarketCap: 397.307 Millions | |
| Recent Price: 11.16 Smart Investing & Trading Score: 10 | |
| Day Percent Change: -0.04% Day Change: -0.01 | |
| Week Change: -1.89% Year-to-date Change: -1.7% | |
| GHY Links: Profile News Message Board | |
| Charts:- Daily , Weekly | |
| Add GHY to Watchlist: View: Get Complete GHY Trend Analysis ➞ | |
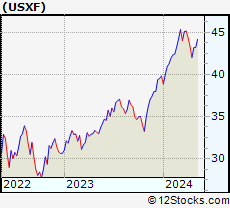 | USXF iShares ESG Advanced MSCI USA ETF |
| Sector: Financials | |
| SubSector: Exchange Traded Fund | |
| MarketCap: 60157 Millions | |
| Recent Price: 42.52 Smart Investing & Trading Score: 51 | |
| Day Percent Change: 0.45% Day Change: 0.19 | |
| Week Change: -1.89% Year-to-date Change: 6.8% | |
| USXF Links: Profile News Message Board | |
| Charts:- Daily , Weekly | |
| Add USXF to Watchlist: View: Get Complete USXF Trend Analysis ➞ | |
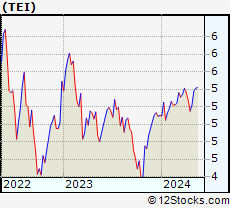 | TEI Templeton Emerging Markets Income Fund |
| Sector: Financials | |
| SubSector: Closed-End Fund - Debt | |
| MarketCap: 337.907 Millions | |
| Recent Price: 5.17 Smart Investing & Trading Score: 15 | |
| Day Percent Change: 0.39% Day Change: 0.02 | |
| Week Change: -1.9% Year-to-date Change: 1.4% | |
| TEI Links: Profile News Message Board | |
| Charts:- Daily , Weekly | |
| Add TEI to Watchlist: View: Get Complete TEI Trend Analysis ➞ | |
 | PFIS Peoples Financial Services Corp. |
| Sector: Financials | |
| SubSector: Regional - Northeast Banks | |
| MarketCap: 305.499 Millions | |
| Recent Price: 36.67 Smart Investing & Trading Score: 18 | |
| Day Percent Change: -0.99% Day Change: -0.37 | |
| Week Change: -1.91% Year-to-date Change: -24.7% | |
| PFIS Links: Profile News Message Board | |
| Charts:- Daily , Weekly | |
| Add PFIS to Watchlist: View: Get Complete PFIS Trend Analysis ➞ | |
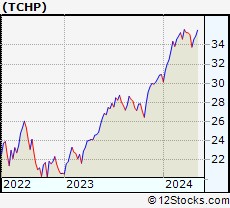 | TCHP T. Rowe Price Blue Chip Growth ETF |
| Sector: Financials | |
| SubSector: Exchange Traded Fund | |
| MarketCap: 60157 Millions | |
| Recent Price: 34.39 Smart Investing & Trading Score: 44 | |
| Day Percent Change: 0.31% Day Change: 0.11 | |
| Week Change: -1.92% Year-to-date Change: 11.3% | |
| TCHP Links: Profile News Message Board | |
| Charts:- Daily , Weekly | |
| Add TCHP to Watchlist: View: Get Complete TCHP Trend Analysis ➞ | |
 | AIZ Assurant, Inc. |
| Sector: Financials | |
| SubSector: Accident & Health Insurance | |
| MarketCap: 6110.3 Millions | |
| Recent Price: 170.84 Smart Investing & Trading Score: 43 | |
| Day Percent Change: 0.44% Day Change: 0.75 | |
| Week Change: -1.93% Year-to-date Change: 1.4% | |
| AIZ Links: Profile News Message Board | |
| Charts:- Daily , Weekly | |
| Add AIZ to Watchlist: View: Get Complete AIZ Trend Analysis ➞ | |
 | OHI Omega Healthcare Investors, Inc. |
| Sector: Financials | |
| SubSector: REIT - Healthcare Facilities | |
| MarketCap: 6433.84 Millions | |
| Recent Price: 29.91 Smart Investing & Trading Score: 36 | |
| Day Percent Change: -0.17% Day Change: -0.05 | |
| Week Change: -1.93% Year-to-date Change: -2.5% | |
| OHI Links: Profile News Message Board | |
| Charts:- Daily , Weekly | |
| Add OHI to Watchlist: View: Get Complete OHI Trend Analysis ➞ | |
 | BCBP BCB Bancorp, Inc. |
| Sector: Financials | |
| SubSector: Regional - Northeast Banks | |
| MarketCap: 196.799 Millions | |
| Recent Price: 9.59 Smart Investing & Trading Score: 30 | |
| Day Percent Change: 3.01% Day Change: 0.28 | |
| Week Change: -1.94% Year-to-date Change: -25.4% | |
| BCBP Links: Profile News Message Board | |
| Charts:- Daily , Weekly | |
| Add BCBP to Watchlist: View: Get Complete BCBP Trend Analysis ➞ | |
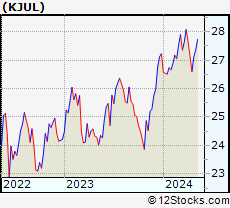 | KJUL Innovator Russell 2000 Power Buffer ETF July |
| Sector: Financials | |
| SubSector: Exchange Traded Fund | |
| MarketCap: 60157 Millions | |
| Recent Price: 26.62 Smart Investing & Trading Score: 23 | |
| Day Percent Change: -0.11% Day Change: -0.03 | |
| Week Change: -1.94% Year-to-date Change: -2.2% | |
| KJUL Links: Profile News Message Board | |
| Charts:- Daily , Weekly | |
| Add KJUL to Watchlist: View: Get Complete KJUL Trend Analysis ➞ | |
 | FBP First BanCorp. |
| Sector: Financials | |
| SubSector: Foreign Regional Banks | |
| MarketCap: 913.079 Millions | |
| Recent Price: 16.32 Smart Investing & Trading Score: 25 | |
| Day Percent Change: 0.21% Day Change: 0.04 | |
| Week Change: -1.95% Year-to-date Change: -0.8% | |
| FBP Links: Profile News Message Board | |
| Charts:- Daily , Weekly | |
| Add FBP to Watchlist: View: Get Complete FBP Trend Analysis ➞ | |
 | HTH Hilltop Holdings Inc. |
| Sector: Financials | |
| SubSector: Mortgage Investment | |
| MarketCap: 1317.89 Millions | |
| Recent Price: 28.95 Smart Investing & Trading Score: 18 | |
| Day Percent Change: 1.06% Day Change: 0.30 | |
| Week Change: -1.95% Year-to-date Change: -17.8% | |
| HTH Links: Profile News Message Board | |
| Charts:- Daily , Weekly | |
| Add HTH to Watchlist: View: Get Complete HTH Trend Analysis ➞ | |
 | HLI Houlihan Lokey, Inc. |
| Sector: Financials | |
| SubSector: Investment Brokerage - National | |
| MarketCap: 3352.65 Millions | |
| Recent Price: 122.61 Smart Investing & Trading Score: 44 | |
| Day Percent Change: -0.18% Day Change: -0.21 | |
| Week Change: -1.95% Year-to-date Change: 2.3% | |
| HLI Links: Profile News Message Board | |
| Charts:- Daily , Weekly | |
| Add HLI to Watchlist: View: Get Complete HLI Trend Analysis ➞ | |
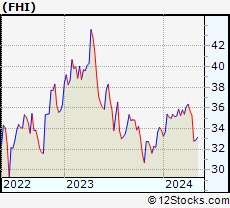 | FHI Federated Hermes, Inc. |
| Sector: Financials | |
| SubSector: Asset Management | |
| MarketCap: 1883.03 Millions | |
| Recent Price: 35.03 Smart Investing & Trading Score: 33 | |
| Day Percent Change: -0.14% Day Change: -0.05 | |
| Week Change: -1.96% Year-to-date Change: 3.5% | |
| FHI Links: Profile News Message Board | |
| Charts:- Daily , Weekly | |
| Add FHI to Watchlist: View: Get Complete FHI Trend Analysis ➞ | |
 | PMT PennyMac Mortgage Investment Trust |
| Sector: Financials | |
| SubSector: Mortgage Investment | |
| MarketCap: 917.639 Millions | |
| Recent Price: 13.29 Smart Investing & Trading Score: 25 | |
| Day Percent Change: 0.42% Day Change: 0.05 | |
| Week Change: -1.96% Year-to-date Change: -11.1% | |
| PMT Links: Profile News Message Board | |
| Charts:- Daily , Weekly | |
| Add PMT to Watchlist: View: Get Complete PMT Trend Analysis ➞ | |
 | LMND Lemonade, Inc. |
| Sector: Financials | |
| SubSector: Insurance Property & Casualty | |
| MarketCap: 56457 Millions | |
| Recent Price: 16.45 Smart Investing & Trading Score: 63 | |
| Day Percent Change: 4.51% Day Change: 0.71 | |
| Week Change: -1.97% Year-to-date Change: 2.0% | |
| LMND Links: Profile News Message Board | |
| Charts:- Daily , Weekly | |
| Add LMND to Watchlist: View: Get Complete LMND Trend Analysis ➞ | |
 | TRMK Trustmark Corporation |
| Sector: Financials | |
| SubSector: Regional - Southeast Banks | |
| MarketCap: 1630.15 Millions | |
| Recent Price: 25.68 Smart Investing & Trading Score: 28 | |
| Day Percent Change: 0.86% Day Change: 0.22 | |
| Week Change: -1.98% Year-to-date Change: -7.9% | |
| TRMK Links: Profile News Message Board | |
| Charts:- Daily , Weekly | |
| Add TRMK to Watchlist: View: Get Complete TRMK Trend Analysis ➞ | |
 | BEKE KE Holdings Inc. |
| Sector: Financials | |
| SubSector: Real Estate Services | |
| MarketCap: 80167 Millions | |
| Recent Price: 12.90 Smart Investing & Trading Score: 25 | |
| Day Percent Change: 0.16% Day Change: 0.02 | |
| Week Change: -1.98% Year-to-date Change: -20.4% | |
| BEKE Links: Profile News Message Board | |
| Charts:- Daily , Weekly | |
| Add BEKE to Watchlist: View: Get Complete BEKE Trend Analysis ➞ | |
 | WABC Westamerica Bancorporation |
| Sector: Financials | |
| SubSector: Regional - Pacific Banks | |
| MarketCap: 1557.69 Millions | |
| Recent Price: 45.69 Smart Investing & Trading Score: 40 | |
| Day Percent Change: 0.42% Day Change: 0.19 | |
| Week Change: -1.99% Year-to-date Change: -19.0% | |
| WABC Links: Profile News Message Board | |
| Charts:- Daily , Weekly | |
| Add WABC to Watchlist: View: Get Complete WABC Trend Analysis ➞ | |
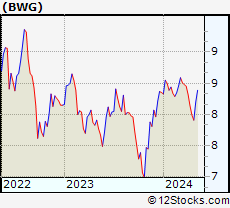 | BWG Legg Mason BW Global Income Opportunities Fund Inc. |
| Sector: Financials | |
| SubSector: Closed-End Fund - Debt | |
| MarketCap: 204.607 Millions | |
| Recent Price: 7.98 Smart Investing & Trading Score: 10 | |
| Day Percent Change: 0.74% Day Change: 0.06 | |
| Week Change: -1.99% Year-to-date Change: -4.5% | |
| BWG Links: Profile News Message Board | |
| Charts:- Daily , Weekly | |
| Add BWG to Watchlist: View: Get Complete BWG Trend Analysis ➞ | |
 | NDAQ Nasdaq, Inc. |
| Sector: Financials | |
| SubSector: Diversified Investments | |
| MarketCap: 14885.2 Millions | |
| Recent Price: 60.29 Smart Investing & Trading Score: 61 | |
| Day Percent Change: 0.47% Day Change: 0.28 | |
| Week Change: -2% Year-to-date Change: 3.7% | |
| NDAQ Links: Profile News Message Board | |
| Charts:- Daily , Weekly | |
| Add NDAQ to Watchlist: View: Get Complete NDAQ Trend Analysis ➞ | |
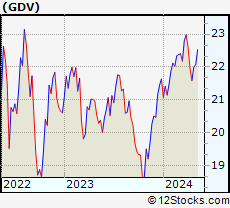 | GDV The Gabelli Dividend & Income Trust |
| Sector: Financials | |
| SubSector: Closed-End Fund - Equity | |
| MarketCap: 1079.97 Millions | |
| Recent Price: 21.52 Smart Investing & Trading Score: 28 | |
| Day Percent Change: -0.23% Day Change: -0.05 | |
| Week Change: -2% Year-to-date Change: -0.6% | |
| GDV Links: Profile News Message Board | |
| Charts:- Daily , Weekly | |
| Add GDV to Watchlist: View: Get Complete GDV Trend Analysis ➞ | |
 | RWT Redwood Trust, Inc. |
| Sector: Financials | |
| SubSector: Mortgage Investment | |
| MarketCap: 674.739 Millions | |
| Recent Price: 5.62 Smart Investing & Trading Score: 25 | |
| Day Percent Change: 1.91% Day Change: 0.11 | |
| Week Change: -2.01% Year-to-date Change: -24.2% | |
| RWT Links: Profile News Message Board | |
| Charts:- Daily , Weekly | |
| Add RWT to Watchlist: View: Get Complete RWT Trend Analysis ➞ | |
 | BEN Franklin Resources, Inc. |
| Sector: Financials | |
| SubSector: Asset Management | |
| MarketCap: 9419.73 Millions | |
| Recent Price: 24.90 Smart Investing & Trading Score: 18 | |
| Day Percent Change: 0.36% Day Change: 0.09 | |
| Week Change: -2.01% Year-to-date Change: -16.4% | |
| BEN Links: Profile News Message Board | |
| Charts:- Daily , Weekly | |
| Add BEN to Watchlist: View: Get Complete BEN Trend Analysis ➞ | |
| For tabular summary view of above stock list: Summary View ➞ 0 - 25 , 25 - 50 , 50 - 75 , 75 - 100 , 100 - 125 , 125 - 150 , 150 - 175 , 175 - 200 , 200 - 225 , 225 - 250 , 250 - 275 , 275 - 300 , 300 - 325 , 325 - 350 , 350 - 375 , 375 - 400 , 400 - 425 , 425 - 450 , 450 - 475 , 475 - 500 , 500 - 525 , 525 - 550 , 550 - 575 , 575 - 600 , 600 - 625 , 625 - 650 , 650 - 675 , 675 - 700 , 700 - 725 , 725 - 750 , 750 - 775 , 775 - 800 , 800 - 825 , 825 - 850 , 850 - 875 , 875 - 900 , 900 - 925 , 925 - 950 , 950 - 975 , 975 - 1000 , 1000 - 1025 , 1025 - 1050 , 1050 - 1075 , 1075 - 1100 , 1100 - 1125 , 1125 - 1150 , 1150 - 1175 , 1175 - 1200 , 1200 - 1225 , 1225 - 1250 | ||
| Click To Change The Sort Order: By Market Cap or Company Size Performance: Year-to-date, Week and Day | |
| Select Chart Type: | ||
|
Best Stocks Today 12Stocks.com |
© 2024 12Stocks.com Terms & Conditions Privacy Contact Us
All Information Provided Only For Education And Not To Be Used For Investing or Trading. See Terms & Conditions


One More Thing ... Get Best Stocks Delivered Daily!
Never Ever Miss A Move With Our Top Ten Stocks Lists
Find Best Stocks In Any Market - Bull or Bear Market
Take A Peek At Our Top Ten Stocks Lists: Daily, Weekly, Year-to-Date & Top Trends
Find Best Stocks In Any Market - Bull or Bear Market
Take A Peek At Our Top Ten Stocks Lists: Daily, Weekly, Year-to-Date & Top Trends
Financial Stocks With Best Up Trends [0-bearish to 100-bullish]: Medical Properties[100], Macatawa Bank[100], Regional Management[100], Stellus Capital[100], Mercury General[95], Kernel [95], HDFC Bank[93], Charles Schwab[93], Fidus [93], BlackRock MuniYield[93], Old Second[93]
Best Financial Stocks Year-to-Date:
Root [430.42%], Hippo [128.32%], Gladstone Capital[92.8%], Banco Macro[69.51%], Grupo Financiero[62.87%], Yiren Digital[55.45%], Fidelis Insurance[53.3%], First [51.56%], Banco BBVA[48.16%], EverQuote [47.88%], Heritage Insurance[44.79%] Best Financial Stocks This Week:
Macatawa Bank[44.47%], Medical Properties[23.68%], Globe Life[11.66%], James River[9.1%], Huize Holding[6.65%], GoHealth [6.51%], Victory Capital[6.22%], AdvisorShares Pure[6.05%], Citizens [5.73%], Green Dot[5.44%], Bancorp [5.42%] Best Financial Stocks Daily:
Oportun [11.27%], Cipher Mining[8.65%], Iris Energy[7.35%], Ally [6.98%], Coinbase Global[5.90%], James River[5.85%], eHealth [5.76%], SelectQuote [5.69%], Tejon Ranch[5.44%], C&F [5.02%], Claros Mortgage[4.52%]