
 Login Sign Up


| |||||
 |  | ||||

| 12Stocks.com Market Intelligence |
Best Financial Stocks
| In a hurry? Financial Stocks Lists: Performance Trends Table, Stock Charts
Sort Financial stocks: Daily, Weekly, Year-to-Date, Market Cap & Trends. Filter Financial stocks list by size:All Financial Large Mid-Range Small & MicroCap |
| 12Stocks.com Financial Stocks Performances & Trends Daily | |||||||||
|
|  The overall Smart Investing & Trading Score is 63 (0-bearish to 100-bullish) which puts Financial sector in short term neutral to bullish trend. The Smart Investing & Trading Score from previous trading session is 56 and hence an improvement of trend.
| ||||||||
Here are the Smart Investing & Trading Scores of the most requested Financial stocks at 12Stocks.com (click stock name for detailed review):
|


| 12Stocks.com: Investing in Financial sector with Stocks | |
|
The following table helps investors and traders sort through current performance and trends (as measured by Smart Investing & Trading Score) of various
stocks in the Financial sector. Quick View: Move mouse or cursor over stock symbol (ticker) to view short-term Technical chart and over stock name to view long term chart. Click on  to add stock symbol to your watchlist and to add stock symbol to your watchlist and  to view watchlist. Click on any ticker or stock name for detailed market intelligence report for that stock. to view watchlist. Click on any ticker or stock name for detailed market intelligence report for that stock. |
12Stocks.com Performance of Stocks in Financial Sector
| Ticker | Stock Name | Watchlist | Category | Recent Price | Smart Investing & Trading Score | Change % | Weekly Change% |
| VTR | Ventas |   | REIT | 43.13 | 42 | 1.15% | 0.70% |
| NXRT | NexPoint Residential | | REIT | 32.11 | 86 | 2.49% | 0.69% |
| MRCC | Monroe Capital | | Mortgage | 7.17 | 47 | 1.54% | 0.69% |
| AFCG | AFC Gamma | | REIT - Specialty | 11.65 | 68 | 1.57% | 0.69% |
| SHBI | Shore Bancshares | | Regional Banks | 10.43 | 52 | 2.66% | 0.68% |
| PB | Prosperity Bancshares | | Regional - Southwest Banks | 60.77 | 42 | 1.81% | 0.68% |
| EBMT | Eagle Bancorp | | Regional Banks | 12.49 | 42 | 0.81% | 0.64% |
| SIXH | 6 Meridian | | Exchange Traded Fund | 35.34 | 76 | 0.21% | 0.63% |
| SVIIU | Spring Valley | | SPAC | 11.18 | 61 | 0.00% | 0.63% |
| CMA | Comerica | | Banks | 51.56 | 42 | 1.78% | 0.62% |
| PWOD | Penns Woods | | Regional Banks | 17.96 | 52 | 3.28% | 0.62% |
| FNB | F.N.B | | Regional Banks | 13.13 | 55 | 2.90% | 0.61% |
| ACT | Enact | | Insurance - Specialty | 29.77 | 58 | 0.20% | 0.61% |
| ADC | Agree Realty | | Property Mgmt | 56.56 | 52 | 1.31% | 0.60% |
| GBDC | Golub Capital | | Asset Mgmt | 16.80 | 100 | 1.27% | 0.60% |
| BLX | Banco Latinoamericano | | Foreign Banks | 29.59 | 63 | 0.10% | 0.58% |
| LTC | LTC Properties | | REIT | 31.80 | 61 | 0.38% | 0.57% |
| CBAN | Colony Bankcorp | | Regional Banks | 10.63 | 35 | 1.72% | 0.57% |
| NXP | Nuveen Select | | Closed-End Fund - Debt | 14.05 | 25 | 0.21% | 0.57% |
| PSEC | Prospect Capital | | Asset Mgmt | 5.41 | 35 | -1.28% | 0.56% |
| NIM | Nuveen Select | | Closed-End Fund - Debt | 8.92 | 50 | 1.13% | 0.56% |
| LPLA | LPL | | Brokerage | 262.59 | 83 | 1.09% | 0.56% |
| KIM | Kimco Realty | | REIT - Retail | 18.20 | 42 | 2.59% | 0.55% |
| PDO | Pimco Dynamic | | Closed-End Fund - Debt | 12.70 | 42 | 0.55% | 0.55% |
| UNB | Union Bankshares | | Regional Banks | 27.60 | 17 | 1.96% | 0.55% |
| For chart view version of above stock list: Chart View ➞ 0 - 25 , 25 - 50 , 50 - 75 , 75 - 100 , 100 - 125 , 125 - 150 , 150 - 175 , 175 - 200 , 200 - 225 , 225 - 250 , 250 - 275 , 275 - 300 , 300 - 325 , 325 - 350 , 350 - 375 , 375 - 400 , 400 - 425 , 425 - 450 , 450 - 475 , 475 - 500 , 500 - 525 , 525 - 550 , 550 - 575 , 575 - 600 , 600 - 625 , 625 - 650 , 650 - 675 , 675 - 700 , 700 - 725 , 725 - 750 , 750 - 775 , 775 - 800 , 800 - 825 , 825 - 850 , 850 - 875 , 875 - 900 , 900 - 925 , 925 - 950 , 950 - 975 , 975 - 1000 , 1000 - 1025 , 1025 - 1050 , 1050 - 1075 , 1075 - 1100 , 1100 - 1125 , 1125 - 1150 , 1150 - 1175 , 1175 - 1200 , 1200 - 1225 , 1225 - 1250 | ||
 | Click To Change The Sort Order: By Market Cap or Company Size Performance: Year-to-date, Week and Day |  |
|
Get the most comprehensive stock market coverage daily at 12Stocks.com ➞ Best Stocks Today ➞ Best Stocks Weekly ➞ Best Stocks Year-to-Date ➞ Best Stocks Trends ➞  Best Stocks Today 12Stocks.com Best Nasdaq Stocks ➞ Best S&P 500 Stocks ➞ Best Tech Stocks ➞ Best Biotech Stocks ➞ |
| Detailed Overview of Financial Stocks |
| Financial Technical Overview, Leaders & Laggards, Top Financial ETF Funds & Detailed Financial Stocks List, Charts, Trends & More |
| Financial Sector: Technical Analysis, Trends & YTD Performance | |
| Financial sector is composed of stocks
from banks, brokers, insurance, REITs
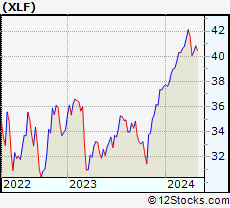
and services subsectors. Financial sector, as represented by XLF, an exchange-traded fund [ETF] that holds basket of Financial stocks (e.g, Bank of America, Goldman Sachs) is up by 7.39% and is currently outperforming the overall market by 4.01% year-to-date. Below is a quick view of Technical charts and trends: |
|
 XLF Weekly Chart |
|
| Long Term Trend: Very Good | |
| Medium Term Trend: Not Good | |
 XLF Daily Chart |
|
| Short Term Trend: Very Good | |
| Overall Trend Score: 63 | |
| YTD Performance: 7.39% | |
| **Trend Scores & Views Are Only For Educational Purposes And Not For Investing | |
| 12Stocks.com: Top Performing Financial Sector Stocks | ||||||||||||||||||||||||||||||||||||||||||||||||
 The top performing Financial sector stocks year to date are
Now, more recently, over last week, the top performing Financial sector stocks on the move are


|
||||||||||||||||||||||||||||||||||||||||||||||||
| 12Stocks.com: Investing in Financial Sector using Exchange Traded Funds | |
|
The following table shows list of key exchange traded funds (ETF) that
help investors track Financial Index. For detailed view, check out our ETF Funds section of our website. Quick View: Move mouse or cursor over ETF symbol (ticker) to view short-term Technical chart and over ETF name to view long term chart. Click on ticker or stock name for detailed view. Click on to add stock symbol to your watchlist and to view watchlist. |
12Stocks.com List of ETFs that track Financial Index
| Ticker | ETF Name | Watchlist | Recent Price | Smart Investing & Trading Score | Change % | Week % | Year-to-date % |
| XLF | Financial | | 40.38 | 63 | 1.38 | 0.8 | 7.39% |
| IAI | Broker-Dealers & Secs | | 111.03 | 63 | 0.47 | 0.18 | 2.3% |
| IYF | Financials | | 91.30 | 48 | 1.40 | 0.83 | 6.9% |
| IYG | Financial Services | | 63.42 | 48 | 1.20 | 0.33 | 6.17% |
| KRE | Regional Banking | | 47.32 | 27 | 2.62 | 1.72 | -9.75% |
| IXG | Global Financials | | 82.86 | 48 | 0.64 | 0.24 | 5.45% |
| VFH | Financials | | 97.75 | 48 | 1.40 | 0.59 | 5.95% |
| KBE | Bank | | 44.41 | 42 | 2.33 | 1.42 | -3.5% |
| FAS | Financial Bull 3X | | 97.93 | 63 | 4.03 | 1.78 | 18.49% |
| FAZ | Financial Bear 3X | | 11.20 | 32 | -3.95 | -1.84 | -18.07% |
| UYG | Financials | | 62.44 | 63 | 2.78 | 1.58 | 13.12% |
| IAT | Regional Banks | | 40.74 | 27 | 2.52 | 0.74 | -2.63% |
| KIE | Insurance | | 49.08 | 58 | 1.66 | 1.57 | 8.54% |
| PSCF | SmallCap Financials | | 45.47 | 22 | 1.59 | 0.13 | -7.54% |
| EUFN | Europe Financials | | 21.98 | 48 | 0.50 | 0.41 | 4.87% |
| PGF | Financial Preferred | | 14.53 | 17 | 0.55 | -1.02 | -0.34% |
| 12Stocks.com: Charts, Trends, Fundamental Data and Performances of Financial Stocks | |
|
We now take in-depth look at all Financial stocks including charts, multi-period performances and overall trends (as measured by Smart Investing & Trading Score). One can sort Financial stocks (click link to choose) by Daily, Weekly and by Year-to-Date performances. Also, one can sort by size of the company or by market capitalization. |
| Select Your Default Chart Type: | |||||
| |||||
| Click on stock symbol or name for detailed view. Click on to add stock symbol to your watchlist and to view watchlist. Quick View: Move mouse or cursor over "Daily" to quickly view daily Technical stock chart and over "Weekly" to view weekly Technical stock chart. | |||||

 | VTR Ventas, Inc. |
| Sector: Financials | |
| SubSector: REIT - Healthcare Facilities | |
| MarketCap: 11180.4 Millions | |
| Recent Price: 43.13 Smart Investing & Trading Score: 42 | |
| Day Percent Change: 1.15% Day Change: 0.49 | |
| Week Change: 0.7% Year-to-date Change: -13.5% | |
| VTR Links: Profile News Message Board | |
| Charts:- Daily , Weekly | |
| Add VTR to Watchlist: View: Get Complete VTR Trend Analysis ➞ | |
 | NXRT NexPoint Residential Trust, Inc. |
| Sector: Financials | |
| SubSector: REIT - Residential | |
| MarketCap: 839.161 Millions | |
| Recent Price: 32.11 Smart Investing & Trading Score: 86 | |
| Day Percent Change: 2.49% Day Change: 0.78 | |
| Week Change: 0.69% Year-to-date Change: -6.7% | |
| NXRT Links: Profile News Message Board | |
| Charts:- Daily , Weekly | |
| Add NXRT to Watchlist: View: Get Complete NXRT Trend Analysis ➞ | |
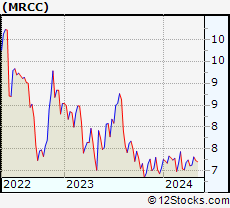 | MRCC Monroe Capital Corporation |
| Sector: Financials | |
| SubSector: Mortgage Investment | |
| MarketCap: 139.439 Millions | |
| Recent Price: 7.17 Smart Investing & Trading Score: 47 | |
| Day Percent Change: 1.54% Day Change: 0.11 | |
| Week Change: 0.69% Year-to-date Change: 1.5% | |
| MRCC Links: Profile News Message Board | |
| Charts:- Daily , Weekly | |
| Add MRCC to Watchlist: View: Get Complete MRCC Trend Analysis ➞ | |
 | AFCG AFC Gamma, Inc. |
| Sector: Financials | |
| SubSector: REIT - Specialty | |
| MarketCap: 269 Millions | |
| Recent Price: 11.65 Smart Investing & Trading Score: 68 | |
| Day Percent Change: 1.57% Day Change: 0.18 | |
| Week Change: 0.69% Year-to-date Change: -3.3% | |
| AFCG Links: Profile News Message Board | |
| Charts:- Daily , Weekly | |
| Add AFCG to Watchlist: View: Get Complete AFCG Trend Analysis ➞ | |
 | SHBI Shore Bancshares, Inc. |
| Sector: Financials | |
| SubSector: Regional - Mid-Atlantic Banks | |
| MarketCap: 131.359 Millions | |
| Recent Price: 10.43 Smart Investing & Trading Score: 52 | |
| Day Percent Change: 2.66% Day Change: 0.27 | |
| Week Change: 0.68% Year-to-date Change: -26.8% | |
| SHBI Links: Profile News Message Board | |
| Charts:- Daily , Weekly | |
| Add SHBI to Watchlist: View: Get Complete SHBI Trend Analysis ➞ | |
 | PB Prosperity Bancshares, Inc. |
| Sector: Financials | |
| SubSector: Regional - Southwest Banks | |
| MarketCap: 4682.25 Millions | |
| Recent Price: 60.77 Smart Investing & Trading Score: 42 | |
| Day Percent Change: 1.81% Day Change: 1.08 | |
| Week Change: 0.68% Year-to-date Change: -10.3% | |
| PB Links: Profile News Message Board | |
| Charts:- Daily , Weekly | |
| Add PB to Watchlist: View: Get Complete PB Trend Analysis ➞ | |
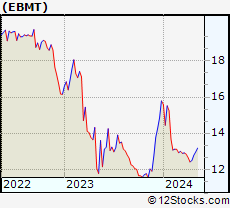 | EBMT Eagle Bancorp Montana, Inc. |
| Sector: Financials | |
| SubSector: Regional - Pacific Banks | |
| MarketCap: 106.929 Millions | |
| Recent Price: 12.49 Smart Investing & Trading Score: 42 | |
| Day Percent Change: 0.81% Day Change: 0.10 | |
| Week Change: 0.64% Year-to-date Change: -20.9% | |
| EBMT Links: Profile News Message Board | |
| Charts:- Daily , Weekly | |
| Add EBMT to Watchlist: View: Get Complete EBMT Trend Analysis ➞ | |
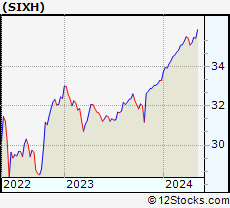 | SIXH 6 Meridian Hedged Equity Index Option Strategy ETF |
| Sector: Financials | |
| SubSector: Exchange Traded Fund | |
| MarketCap: 60157 Millions | |
| Recent Price: 35.34 Smart Investing & Trading Score: 76 | |
| Day Percent Change: 0.21% Day Change: 0.07 | |
| Week Change: 0.63% Year-to-date Change: 6.1% | |
| SIXH Links: Profile News Message Board | |
| Charts:- Daily , Weekly | |
| Add SIXH to Watchlist: View: Get Complete SIXH Trend Analysis ➞ | |
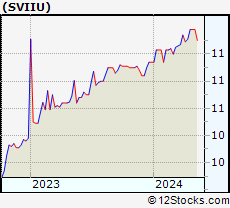 | SVIIU Spring Valley Acquisition Corp. II |
| Sector: Financials | |
| SubSector: SPAC | |
| MarketCap: 324 Millions | |
| Recent Price: 11.18 Smart Investing & Trading Score: 61 | |
| Day Percent Change: 0.00% Day Change: 0.00 | |
| Week Change: 0.63% Year-to-date Change: 2.2% | |
| SVIIU Links: Profile News Message Board | |
| Charts:- Daily , Weekly | |
| Add SVIIU to Watchlist: View: Get Complete SVIIU Trend Analysis ➞ | |
 | CMA Comerica Incorporated |
| Sector: Financials | |
| SubSector: Money Center Banks | |
| MarketCap: 4449.49 Millions | |
| Recent Price: 51.56 Smart Investing & Trading Score: 42 | |
| Day Percent Change: 1.78% Day Change: 0.90 | |
| Week Change: 0.62% Year-to-date Change: -7.6% | |
| CMA Links: Profile News Message Board | |
| Charts:- Daily , Weekly | |
| Add CMA to Watchlist: View: Get Complete CMA Trend Analysis ➞ | |
 | PWOD Penns Woods Bancorp, Inc. |
| Sector: Financials | |
| SubSector: Regional - Mid-Atlantic Banks | |
| MarketCap: 152.559 Millions | |
| Recent Price: 17.96 Smart Investing & Trading Score: 52 | |
| Day Percent Change: 3.28% Day Change: 0.57 | |
| Week Change: 0.62% Year-to-date Change: -20.2% | |
| PWOD Links: Profile News Message Board | |
| Charts:- Daily , Weekly | |
| Add PWOD to Watchlist: View: Get Complete PWOD Trend Analysis ➞ | |
 | FNB F.N.B. Corporation |
| Sector: Financials | |
| SubSector: Regional - Southeast Banks | |
| MarketCap: 2445.55 Millions | |
| Recent Price: 13.13 Smart Investing & Trading Score: 55 | |
| Day Percent Change: 2.90% Day Change: 0.37 | |
| Week Change: 0.61% Year-to-date Change: -4.7% | |
| FNB Links: Profile News Message Board | |
| Charts:- Daily , Weekly | |
| Add FNB to Watchlist: View: Get Complete FNB Trend Analysis ➞ | |
 | ACT Enact Holdings, Inc. |
| Sector: Financials | |
| SubSector: Insurance - Specialty | |
| MarketCap: 4010 Millions | |
| Recent Price: 29.77 Smart Investing & Trading Score: 58 | |
| Day Percent Change: 0.20% Day Change: 0.06 | |
| Week Change: 0.61% Year-to-date Change: 2.4% | |
| ACT Links: Profile News Message Board | |
| Charts:- Daily , Weekly | |
| Add ACT to Watchlist: View: Get Complete ACT Trend Analysis ➞ | |
 | ADC Agree Realty Corporation |
| Sector: Financials | |
| SubSector: Property Management | |
| MarketCap: 2573.82 Millions | |
| Recent Price: 56.56 Smart Investing & Trading Score: 52 | |
| Day Percent Change: 1.31% Day Change: 0.73 | |
| Week Change: 0.6% Year-to-date Change: -10.2% | |
| ADC Links: Profile News Message Board | |
| Charts:- Daily , Weekly | |
| Add ADC to Watchlist: View: Get Complete ADC Trend Analysis ➞ | |
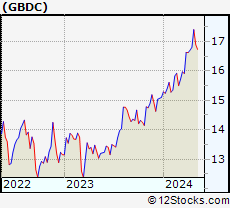 | GBDC Golub Capital BDC, Inc. |
| Sector: Financials | |
| SubSector: Asset Management | |
| MarketCap: 1493.23 Millions | |
| Recent Price: 16.80 Smart Investing & Trading Score: 100 | |
| Day Percent Change: 1.27% Day Change: 0.21 | |
| Week Change: 0.6% Year-to-date Change: 11.3% | |
| GBDC Links: Profile News Message Board | |
| Charts:- Daily , Weekly | |
| Add GBDC to Watchlist: View: Get Complete GBDC Trend Analysis ➞ | |
 | BLX Banco Latinoamericano de Comercio Exterior, S.A |
| Sector: Financials | |
| SubSector: Foreign Money Center Banks | |
| MarketCap: 390.471 Millions | |
| Recent Price: 29.59 Smart Investing & Trading Score: 63 | |
| Day Percent Change: 0.10% Day Change: 0.03 | |
| Week Change: 0.58% Year-to-date Change: 19.6% | |
| BLX Links: Profile News Message Board | |
| Charts:- Daily , Weekly | |
| Add BLX to Watchlist: View: Get Complete BLX Trend Analysis ➞ | |
 | LTC LTC Properties, Inc. |
| Sector: Financials | |
| SubSector: REIT - Healthcare Facilities | |
| MarketCap: 1369.24 Millions | |
| Recent Price: 31.80 Smart Investing & Trading Score: 61 | |
| Day Percent Change: 0.38% Day Change: 0.12 | |
| Week Change: 0.57% Year-to-date Change: -1.0% | |
| LTC Links: Profile News Message Board | |
| Charts:- Daily , Weekly | |
| Add LTC to Watchlist: View: Get Complete LTC Trend Analysis ➞ | |
 | CBAN Colony Bankcorp, Inc. |
| Sector: Financials | |
| SubSector: Regional - Mid-Atlantic Banks | |
| MarketCap: 115.559 Millions | |
| Recent Price: 10.63 Smart Investing & Trading Score: 35 | |
| Day Percent Change: 1.72% Day Change: 0.18 | |
| Week Change: 0.57% Year-to-date Change: -20.1% | |
| CBAN Links: Profile News Message Board | |
| Charts:- Daily , Weekly | |
| Add CBAN to Watchlist: View: Get Complete CBAN Trend Analysis ➞ | |
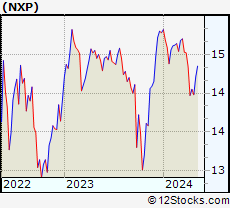 | NXP Nuveen Select Tax-Free Income Portfolio |
| Sector: Financials | |
| SubSector: Closed-End Fund - Debt | |
| MarketCap: 231.907 Millions | |
| Recent Price: 14.05 Smart Investing & Trading Score: 25 | |
| Day Percent Change: 0.21% Day Change: 0.03 | |
| Week Change: 0.57% Year-to-date Change: -4.9% | |
| NXP Links: Profile News Message Board | |
| Charts:- Daily , Weekly | |
| Add NXP to Watchlist: View: Get Complete NXP Trend Analysis ➞ | |
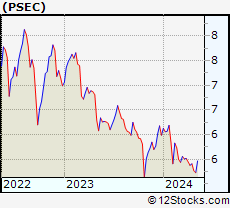 | PSEC Prospect Capital Corporation |
| Sector: Financials | |
| SubSector: Asset Management | |
| MarketCap: 1764.73 Millions | |
| Recent Price: 5.41 Smart Investing & Trading Score: 35 | |
| Day Percent Change: -1.28% Day Change: -0.07 | |
| Week Change: 0.56% Year-to-date Change: -9.7% | |
| PSEC Links: Profile News Message Board | |
| Charts:- Daily , Weekly | |
| Add PSEC to Watchlist: View: Get Complete PSEC Trend Analysis ➞ | |
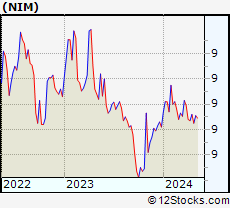 | NIM Nuveen Select Maturities Municipal Fund |
| Sector: Financials | |
| SubSector: Closed-End Fund - Debt | |
| MarketCap: 122.307 Millions | |
| Recent Price: 8.92 Smart Investing & Trading Score: 50 | |
| Day Percent Change: 1.13% Day Change: 0.10 | |
| Week Change: 0.56% Year-to-date Change: 1.1% | |
| NIM Links: Profile News Message Board | |
| Charts:- Daily , Weekly | |
| Add NIM to Watchlist: View: Get Complete NIM Trend Analysis ➞ | |
 | LPLA LPL Financial Holdings Inc. |
| Sector: Financials | |
| SubSector: Investment Brokerage - National | |
| MarketCap: 4104.65 Millions | |
| Recent Price: 262.59 Smart Investing & Trading Score: 83 | |
| Day Percent Change: 1.09% Day Change: 2.82 | |
| Week Change: 0.56% Year-to-date Change: 15.4% | |
| LPLA Links: Profile News Message Board | |
| Charts:- Daily , Weekly | |
| Add LPLA to Watchlist: View: Get Complete LPLA Trend Analysis ➞ | |
 | KIM Kimco Realty Corporation |
| Sector: Financials | |
| SubSector: REIT - Retail | |
| MarketCap: 5358.64 Millions | |
| Recent Price: 18.20 Smart Investing & Trading Score: 42 | |
| Day Percent Change: 2.59% Day Change: 0.46 | |
| Week Change: 0.55% Year-to-date Change: -14.6% | |
| KIM Links: Profile News Message Board | |
| Charts:- Daily , Weekly | |
| Add KIM to Watchlist: View: Get Complete KIM Trend Analysis ➞ | |
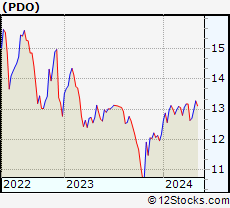 | PDO Pimco Dynamic Income Opportunities Fund |
| Sector: Financials | |
| SubSector: Closed-End Fund - Debt | |
| MarketCap: 1440 Millions | |
| Recent Price: 12.70 Smart Investing & Trading Score: 42 | |
| Day Percent Change: 0.55% Day Change: 0.07 | |
| Week Change: 0.55% Year-to-date Change: 4.4% | |
| PDO Links: Profile News Message Board | |
| Charts:- Daily , Weekly | |
| Add PDO to Watchlist: View: Get Complete PDO Trend Analysis ➞ | |
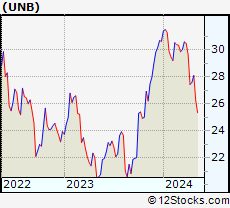 | UNB Union Bankshares, Inc. |
| Sector: Financials | |
| SubSector: Regional - Northeast Banks | |
| MarketCap: 130.499 Millions | |
| Recent Price: 27.60 Smart Investing & Trading Score: 17 | |
| Day Percent Change: 1.96% Day Change: 0.53 | |
| Week Change: 0.55% Year-to-date Change: -10.0% | |
| UNB Links: Profile News Message Board | |
| Charts:- Daily , Weekly | |
| Add UNB to Watchlist: View: Get Complete UNB Trend Analysis ➞ | |
| For tabular summary view of above stock list: Summary View ➞ 0 - 25 , 25 - 50 , 50 - 75 , 75 - 100 , 100 - 125 , 125 - 150 , 150 - 175 , 175 - 200 , 200 - 225 , 225 - 250 , 250 - 275 , 275 - 300 , 300 - 325 , 325 - 350 , 350 - 375 , 375 - 400 , 400 - 425 , 425 - 450 , 450 - 475 , 475 - 500 , 500 - 525 , 525 - 550 , 550 - 575 , 575 - 600 , 600 - 625 , 625 - 650 , 650 - 675 , 675 - 700 , 700 - 725 , 725 - 750 , 750 - 775 , 775 - 800 , 800 - 825 , 825 - 850 , 850 - 875 , 875 - 900 , 900 - 925 , 925 - 950 , 950 - 975 , 975 - 1000 , 1000 - 1025 , 1025 - 1050 , 1050 - 1075 , 1075 - 1100 , 1100 - 1125 , 1125 - 1150 , 1150 - 1175 , 1175 - 1200 , 1200 - 1225 , 1225 - 1250 | ||
| Click To Change The Sort Order: By Market Cap or Company Size Performance: Year-to-date, Week and Day | |
| Select Chart Type: | ||
|
Best Stocks Today 12Stocks.com |
© 2024 12Stocks.com Terms & Conditions Privacy Contact Us
All Information Provided Only For Education And Not To Be Used For Investing or Trading. See Terms & Conditions


One More Thing ... Get Best Stocks Delivered Daily!
Never Ever Miss A Move With Our Top Ten Stocks Lists
Find Best Stocks In Any Market - Bull or Bear Market
Take A Peek At Our Top Ten Stocks Lists: Daily, Weekly, Year-to-Date & Top Trends
Find Best Stocks In Any Market - Bull or Bear Market
Take A Peek At Our Top Ten Stocks Lists: Daily, Weekly, Year-to-Date & Top Trends
Financial Stocks With Best Up Trends [0-bearish to 100-bullish]: BancFirst [100], Old Second[100], Tejon Ranch[100], United Fire[100], Victory Capital[100], Wells Fargo[100], Macatawa Bank[100], Amerisafe [100], ASA Gold[100], Stellus Capital[100], Golub Capital[100]
Best Financial Stocks Year-to-Date:
Root [394.17%], Hippo [119.76%], Gladstone Capital[96.64%], Banco Macro[73.59%], Grupo Financiero[64.84%], Banco BBVA[57.54%], Yiren Digital[54.81%], First [51.04%], Fidelis Insurance[51.01%], EverQuote [50.25%], Heritage Insurance[46.93%] Best Financial Stocks This Week:
Macatawa Bank[47.34%], Metropolitan Bank[13.32%], Globe Life[12.95%], Medical Properties[10.78%], Victory Capital[10.59%], James River[10.4%], Chemung [10.1%], Southern First[9.19%], Summit [8.28%], BancFirst [7.85%], Bancorp [7.81%] Best Financial Stocks Daily:
Metropolitan Bank[18.01%], Hywin [17.78%], Chemung [10.29%], Cohen & Steers[9.50%], Clipper Realty[9.49%], BancFirst [8.86%], Summit [8.45%], Home Bancorp[7.41%], Bar Harbor[6.79%], Southern First[6.38%], Iris Energy[6.30%]