
 Login Sign Up


| |||||
 |  | ||||

| 12Stocks.com Market Intelligence |
Best Financial Stocks
| In a hurry? Financial Stocks Lists: Performance Trends Table, Stock Charts
Sort Financial stocks: Daily, Weekly, Year-to-Date, Market Cap & Trends. Filter Financial stocks list by size:All Financial Large Mid-Range Small & MicroCap |
| 12Stocks.com Financial Stocks Performances & Trends Daily | |||||||||
|
|  The overall Smart Investing & Trading Score is 68 (0-bearish to 100-bullish) which puts Financial sector in short term neutral to bullish trend. The Smart Investing & Trading Score from previous trading session is 75 and hence a deterioration of trend.
| ||||||||
Here are the Smart Investing & Trading Scores of the most requested Financial stocks at 12Stocks.com (click stock name for detailed review):
|


| 12Stocks.com: Investing in Financial sector with Stocks | |
|
The following table helps investors and traders sort through current performance and trends (as measured by Smart Investing & Trading Score) of various
stocks in the Financial sector. Quick View: Move mouse or cursor over stock symbol (ticker) to view short-term Technical chart and over stock name to view long term chart. Click on  to add stock symbol to your watchlist and to add stock symbol to your watchlist and  to view watchlist. Click on any ticker or stock name for detailed market intelligence report for that stock. to view watchlist. Click on any ticker or stock name for detailed market intelligence report for that stock. |
12Stocks.com Performance of Stocks in Financial Sector
| Ticker | Stock Name | Watchlist | Category | Recent Price | Trend Score | Change % | YTD Change% |
| RBCAA | Republic Bancorp |   | Regional Banks | 49.83 | 32 | -0.28% | -9.66% |
| LDI | loanDepot | | Mortgage Finance | 2.40 | 49 | -0.62% | -33.93% |
| ETW | Eaton Vance | | Closed-End Fund - Foreign | 7.87 | 33 | -0.13% | 1.29% |
| ALCC | AltC Acquisition | | SPAC | 12.95 | 85 | -0.38% | 22.87% |
| FBNC | First Bancorp | | Regional Banks | 34.50 | 67 | 1.14% | -6.78% |
| GHIX | Gores | | SPAC | 10.55 | 21 | 0.00% | 0.48% |
| ECPG | Encore Capital | | Asset Mgmt | 43.05 | 27 | 1.34% | -15.17% |
| FOR | Forestar | | Real Estatet | 31.15 | 30 | -1.02% | -5.81% |
| HQH | Tekla Healthcare | | Closed-End Fund - Equity | 16.13 | 32 | 0.00% | -2.66% |
| LADR | Ladder Capital | | Mortgage | 10.50 | 25 | -1.50% | -8.77% |
| AC | Associated Capital | | Asset Mgmt | 32.78 | 54 | 0.18% | -8.20% |
| AMTB | Amerant Bancorp | | Regional Banks | 22.72 | 67 | 0.00% | -7.53% |
| PAXS | PIMCO Access | | Closed-End Fund - Debt | 15.24 | 75 | -1.04% | 5.61% |
| ABR | Arbor Realty | | Mortgage | 13.02 | 67 | -1.36% | -14.23% |
| COOP | Mr. Cooper | | S&L | 81.72 | 75 | 2.82% | 25.49% |
| HFRO | Highland Funds | | Asset Mgmt | 6.48 | 27 | -0.92% | -15.73% |
| BHK | BlackRock Core | | Closed-End Fund - Debt | 10.38 | 22 | -0.57% | -4.86% |
| KREF | KKR Real | | Mortgage | 9.78 | 42 | -2.40% | -26.08% |
| QQQX | Nuveen Nasdaq | | Closed-End Fund - Equity | 22.86 | 23 | -0.26% | -1.25% |
| AACT | Ares Acquisition | | SPAC | 10.62 | 58 | 0.09% | 1.92% |
| JQC | Nuveen Credit | | Closed-End Fund - Debt | 5.50 | 56 | -0.18% | 5.36% |
| FSP | Franklin Street | | REIT - Office | 2.04 | 42 | -1.45% | -20.31% |
| FFC | Flaherty & Crumrine Preferred Securities ome Fund | | Closed-End Fund - Debt | 14.10 | 23 | -0.07% | 1.44% |
| RNP | Cohen & Steers REIT and Preferred ome Fund | | Closed-End Fund - Debt | 20.02 | 42 | 0.15% | -0.69% |
| STC | Stewart Information | | Insurance | 62.95 | 78 | -1.02% | 7.15% |
| For chart view version of above stock list: Chart View ➞ 0 - 25 , 25 - 50 , 50 - 75 , 75 - 100 , 100 - 125 , 125 - 150 , 150 - 175 , 175 - 200 , 200 - 225 , 225 - 250 , 250 - 275 , 275 - 300 , 300 - 325 , 325 - 350 , 350 - 375 , 375 - 400 , 400 - 425 , 425 - 450 , 450 - 475 , 475 - 500 , 500 - 525 , 525 - 550 , 550 - 575 , 575 - 600 , 600 - 625 , 625 - 650 , 650 - 675 , 675 - 700 , 700 - 725 , 725 - 750 , 750 - 775 , 775 - 800 , 800 - 825 , 825 - 850 , 850 - 875 , 875 - 900 , 900 - 925 , 925 - 950 , 950 - 975 , 975 - 1000 , 1000 - 1025 , 1025 - 1050 , 1050 - 1075 , 1075 - 1100 , 1100 - 1125 , 1125 - 1150 , 1150 - 1175 , 1175 - 1200 , 1200 - 1225 , 1225 - 1250 | ||
 | Click To Change The Sort Order: By Market Cap or Company Size Performance: Year-to-date, Week and Day |  |
|
Get the most comprehensive stock market coverage daily at 12Stocks.com ➞ Best Stocks Today ➞ Best Stocks Weekly ➞ Best Stocks Year-to-Date ➞ Best Stocks Trends ➞  Best Stocks Today 12Stocks.com Best Nasdaq Stocks ➞ Best S&P 500 Stocks ➞ Best Tech Stocks ➞ Best Biotech Stocks ➞ |
| Detailed Overview of Financial Stocks |
| Financial Technical Overview, Leaders & Laggards, Top Financial ETF Funds & Detailed Financial Stocks List, Charts, Trends & More |
| Financial Sector: Technical Analysis, Trends & YTD Performance | |
| Financial sector is composed of stocks
from banks, brokers, insurance, REITs
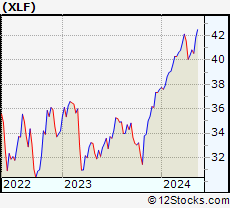
and services subsectors. Financial sector, as represented by XLF, an exchange-traded fund [ETF] that holds basket of Financial stocks (e.g, Bank of America, Goldman Sachs) is up by 9.36% and is currently outperforming the overall market by 3.7% year-to-date. Below is a quick view of Technical charts and trends: |
|
 XLF Weekly Chart |
|
| Long Term Trend: Very Good | |
| Medium Term Trend: Not Good | |
 XLF Daily Chart |
|
| Short Term Trend: Very Good | |
| Overall Trend Score: 68 | |
| YTD Performance: 9.36% | |
| **Trend Scores & Views Are Only For Educational Purposes And Not For Investing | |
Incorrect key file for table 'C:\Windows\TEMP\#sql70c_16db55_7.MYI'; try to repair it