
 Login Sign Up


| |||||
 |  | ||||

| 12Stocks.com Market Intelligence |
Best Financial Stocks
| In a hurry? Financial Stocks Lists: Performance Trends Table, Stock Charts
Sort Financial stocks: Daily, Weekly, Year-to-Date, Market Cap & Trends. Filter Financial stocks list by size:All Financial Large Mid-Range Small & MicroCap |
| 12Stocks.com Financial Stocks Performances & Trends Daily | |||||||||
|
|  The overall Smart Investing & Trading Score is 56 (0-bearish to 100-bullish) which puts Financial sector in short term neutral trend. The Smart Investing & Trading Score from previous trading session is 36 and hence an improvement of trend.
| ||||||||
Here are the Smart Investing & Trading Scores of the most requested Financial stocks at 12Stocks.com (click stock name for detailed review):
|


| 12Stocks.com: Investing in Financial sector with Stocks | |
|
The following table helps investors and traders sort through current performance and trends (as measured by Smart Investing & Trading Score) of various
stocks in the Financial sector. Quick View: Move mouse or cursor over stock symbol (ticker) to view short-term Technical chart and over stock name to view long term chart. Click on  to add stock symbol to your watchlist and to add stock symbol to your watchlist and  to view watchlist. Click on any ticker or stock name for detailed market intelligence report for that stock. to view watchlist. Click on any ticker or stock name for detailed market intelligence report for that stock. |
12Stocks.com Performance of Stocks in Financial Sector
| Ticker | Stock Name | Watchlist | Category | Recent Price | Trend Score | Change % | YTD Change% |
| ARI | Apollo Commercial |   | Mortgage | 10.52 | 17 | 0.86% | -10.39% |
| PX | P10 | | Asset Mgmt | 7.42 | 46 | -0.93% | -27.40% |
| PLMR | Palomar | | Insurance | 77.77 | 53 | 1.13% | 40.13% |
| AMK | AssetMark | | Asset Mgmt | 34.50 | 41 | -0.40% | 15.19% |
| RNST | Renasant | | Banks | 28.77 | 23 | 1.62% | -14.58% |
| GGAL | Grupo Financiero | | Foreign Banks | 28.03 | 73 | 1.26% | 62.35% |
| NWBI | Northwest Bancshares | | S&L | 10.78 | 17 | 0.65% | -13.62% |
| FSK | FS KKR | | Asset Mgmt | 19.16 | 45 | 0.58% | -4.06% |
| AVAL | Grupo Aval | | Foreign Banks | 2.35 | 30 | -1.26% | -3.29% |
| ALX | Alexander s | | REIT - Retail | 205.46 | 5 | -1.19% | -3.80% |
| INTR | Inter & Co | | Banks - Regional | 5.07 | 38 | 0.20% | -9.55% |
| OPI | Office Properties | | REIT - Office | 1.88 | 25 | -0.53% | -74.32% |
| ETY | Eaton Vance | | Closed-End Fund - Equity | 12.86 | 41 | 0.08% | 5.50% |
| FCPT | Four Corners | | REIT | 22.66 | 17 | 0.40% | -10.43% |
| TCBI | Texas Capital | | Regional - Southwest Banks | 55.98 | 10 | 0.11% | -13.38% |
| EIG | Employers | | Insurance | 43.10 | 63 | 1.46% | 9.39% |
| CSQ | Calamos Strategic | | Closed-End Fund - Debt | 15.47 | 23 | 0.26% | 4.03% |
| UTF | Cohen & Steers Infrastructure Fund | | Closed-End Fund - Equity | 22.00 | 27 | 1.38% | 3.58% |
| IIPR | Innovative Industrial | | REIT - Industrial | 93.88 | 41 | 0.28% | -6.88% |
| WSFS | WSFS | | Regional Banks | 41.85 | 35 | 0.26% | -8.88% |
| BANR | Banner | | Regional Banks | 43.73 | 42 | 1.34% | -18.35% |
| IVR | Invesco Mortgage | | Mortgage | 8.09 | 20 | -0.49% | -8.69% |
| ADX | Adams Diversified | | Closed-End Fund - Equity | 18.60 | 36 | -0.75% | 5.03% |
| MAC | Macerich | | REIT - Retail | 15.17 | 0 | -1.30% | -1.69% |
| FBRT | Franklin BSP | | REIT - Mortgage | 12.43 | 32 | 1.76% | -8.83% |
| For chart view version of above stock list: Chart View ➞ 0 - 25 , 25 - 50 , 50 - 75 , 75 - 100 , 100 - 125 , 125 - 150 , 150 - 175 , 175 - 200 , 200 - 225 , 225 - 250 , 250 - 275 , 275 - 300 , 300 - 325 , 325 - 350 , 350 - 375 , 375 - 400 , 400 - 425 , 425 - 450 , 450 - 475 , 475 - 500 , 500 - 525 , 525 - 550 , 550 - 575 , 575 - 600 , 600 - 625 , 625 - 650 , 650 - 675 , 675 - 700 , 700 - 725 , 725 - 750 , 750 - 775 , 775 - 800 , 800 - 825 , 825 - 850 , 850 - 875 , 875 - 900 , 900 - 925 , 925 - 950 , 950 - 975 , 975 - 1000 , 1000 - 1025 , 1025 - 1050 , 1050 - 1075 , 1075 - 1100 , 1100 - 1125 , 1125 - 1150 , 1150 - 1175 , 1175 - 1200 , 1200 - 1225 , 1225 - 1250 | ||
 | Click To Change The Sort Order: By Market Cap or Company Size Performance: Year-to-date, Week and Day |  |
|
Get the most comprehensive stock market coverage daily at 12Stocks.com ➞ Best Stocks Today ➞ Best Stocks Weekly ➞ Best Stocks Year-to-Date ➞ Best Stocks Trends ➞  Best Stocks Today 12Stocks.com Best Nasdaq Stocks ➞ Best S&P 500 Stocks ➞ Best Tech Stocks ➞ Best Biotech Stocks ➞ |
| Detailed Overview of Financial Stocks |
| Financial Technical Overview, Leaders & Laggards, Top Financial ETF Funds & Detailed Financial Stocks List, Charts, Trends & More |
| Financial Sector: Technical Analysis, Trends & YTD Performance | |
| Financial sector is composed of stocks
from banks, brokers, insurance, REITs
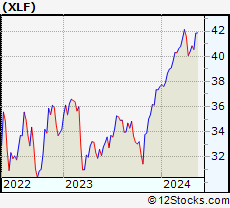
and services subsectors. Financial sector, as represented by XLF, an exchange-traded fund [ETF] that holds basket of Financial stocks (e.g, Bank of America, Goldman Sachs) is up by 5.93% and is currently outperforming the overall market by 1.74% year-to-date. Below is a quick view of Technical charts and trends: |
|
 XLF Weekly Chart |
|
| Long Term Trend: Good | |
| Medium Term Trend: Not Good | |
 XLF Daily Chart |
|
| Short Term Trend: Deteriorating | |
| Overall Trend Score: 56 | |
| YTD Performance: 5.93% | |
| **Trend Scores & Views Are Only For Educational Purposes And Not For Investing | |
| 12Stocks.com: Top Performing Financial Sector Stocks | ||||||||||||||||||||||||||||||||||||||||||||||||
 The top performing Financial sector stocks year to date are
Now, more recently, over last week, the top performing Financial sector stocks on the move are


|
||||||||||||||||||||||||||||||||||||||||||||||||
| 12Stocks.com: Investing in Financial Sector using Exchange Traded Funds | |
|
The following table shows list of key exchange traded funds (ETF) that
help investors track Financial Index. For detailed view, check out our ETF Funds section of our website. Quick View: Move mouse or cursor over ETF symbol (ticker) to view short-term Technical chart and over ETF name to view long term chart. Click on ticker or stock name for detailed view. Click on to add stock symbol to your watchlist and to view watchlist. |
12Stocks.com List of ETFs that track Financial Index
| Ticker | ETF Name | Watchlist | Recent Price | Smart Investing & Trading Score | Change % | Week % | Year-to-date % |
| XLF | Financial | | 39.83 | 56 | 0.35 | -0.57 | 5.93% |
| IAI | Broker-Dealers & Secs | | 110.51 | 56 | 0.14 | -0.29 | 1.82% |
| IYF | Financials | | 90.04 | 48 | 0.61 | -0.56 | 5.42% |
| IYG | Financial Services | | 62.67 | 56 | 0.30 | -0.85 | 4.91% |
| KRE | Regional Banking | | 46.11 | 28 | 0.61 | -0.88 | -12.05% |
| IXG | Global Financials | | 82.33 | 43 | 0.45 | -0.4 | 4.77% |
| VFH | Financials | | 96.40 | 56 | 0.39 | -0.8 | 4.49% |
| KBE | Bank | | 43.40 | 22 | 0.70 | -0.89 | -5.69% |
| FAS | Financial Bull 3X | | 94.14 | 56 | 1.00 | -2.16 | 13.9% |
| FAZ | Financial Bear 3X | | 11.66 | 40 | -0.85 | 2.19 | -14.7% |
| UYG | Financials | | 60.75 | 51 | 0.70 | -1.17 | 10.05% |
| IAT | Regional Banks | | 39.74 | 27 | 0.28 | -1.73 | -5.02% |
| KIE | Insurance | | 48.28 | 51 | 1.17 | -0.08 | 6.77% |
| PSCF | SmallCap Financials | | 44.76 | 22 | -0.22 | -1.43 | -8.99% |
| EUFN | Europe Financials | | 21.87 | 56 | 0.28 | -0.09 | 4.34% |
| PGF | Financial Preferred | | 14.45 | 18 | -0.28 | -1.57 | -0.89% |
| 12Stocks.com: Charts, Trends, Fundamental Data and Performances of Financial Stocks | |
|
We now take in-depth look at all Financial stocks including charts, multi-period performances and overall trends (as measured by Smart Investing & Trading Score). One can sort Financial stocks (click link to choose) by Daily, Weekly and by Year-to-Date performances. Also, one can sort by size of the company or by market capitalization. |
| Select Your Default Chart Type: | |||||
| |||||
| Click on stock symbol or name for detailed view. Click on to add stock symbol to your watchlist and to view watchlist. Quick View: Move mouse or cursor over "Daily" to quickly view daily Technical stock chart and over "Weekly" to view weekly Technical stock chart. | |||||

 | ARI Apollo Commercial Real Estate Finance, Inc. |
| Sector: Financials | |
| SubSector: Mortgage Investment | |
| MarketCap: 1302.19 Millions | |
| Recent Price: 10.52 Smart Investing & Trading Score: 17 | |
| Day Percent Change: 0.86% Day Change: 0.09 | |
| Week Change: -2.23% Year-to-date Change: -10.4% | |
| ARI Links: Profile News Message Board | |
| Charts:- Daily , Weekly | |
| Add ARI to Watchlist: View: Get Complete ARI Trend Analysis ➞ | |
 | PX P10, Inc. |
| Sector: Financials | |
| SubSector: Asset Management | |
| MarketCap: 1300 Millions | |
| Recent Price: 7.42 Smart Investing & Trading Score: 46 | |
| Day Percent Change: -0.93% Day Change: -0.07 | |
| Week Change: -3.51% Year-to-date Change: -27.4% | |
| PX Links: Profile News Message Board | |
| Charts:- Daily , Weekly | |
| Add PX to Watchlist: View: Get Complete PX Trend Analysis ➞ | |
 | PLMR Palomar Holdings, Inc. |
| Sector: Financials | |
| SubSector: Property & Casualty Insurance | |
| MarketCap: 1297.42 Millions | |
| Recent Price: 77.77 Smart Investing & Trading Score: 53 | |
| Day Percent Change: 1.13% Day Change: 0.87 | |
| Week Change: 4.52% Year-to-date Change: 40.1% | |
| PLMR Links: Profile News Message Board | |
| Charts:- Daily , Weekly | |
| Add PLMR to Watchlist: View: Get Complete PLMR Trend Analysis ➞ | |
 | AMK AssetMark Financial Holdings, Inc. |
| Sector: Financials | |
| SubSector: Asset Management | |
| MarketCap: 1296.33 Millions | |
| Recent Price: 34.50 Smart Investing & Trading Score: 41 | |
| Day Percent Change: -0.40% Day Change: -0.14 | |
| Week Change: -4.49% Year-to-date Change: 15.2% | |
| AMK Links: Profile News Message Board | |
| Charts:- Daily , Weekly | |
| Add AMK to Watchlist: View: Get Complete AMK Trend Analysis ➞ | |
 | RNST Renasant Corporation |
| Sector: Financials | |
| SubSector: Money Center Banks | |
| MarketCap: 1279.39 Millions | |
| Recent Price: 28.77 Smart Investing & Trading Score: 23 | |
| Day Percent Change: 1.62% Day Change: 0.46 | |
| Week Change: -0.1% Year-to-date Change: -14.6% | |
| RNST Links: Profile News Message Board | |
| Charts:- Daily , Weekly | |
| Add RNST to Watchlist: View: Get Complete RNST Trend Analysis ➞ | |
 | GGAL Grupo Financiero Galicia S.A. |
| Sector: Financials | |
| SubSector: Foreign Regional Banks | |
| MarketCap: 1274.69 Millions | |
| Recent Price: 28.03 Smart Investing & Trading Score: 73 | |
| Day Percent Change: 1.26% Day Change: 0.35 | |
| Week Change: -5.84% Year-to-date Change: 62.4% | |
| GGAL Links: Profile News Message Board | |
| Charts:- Daily , Weekly | |
| Add GGAL to Watchlist: View: Get Complete GGAL Trend Analysis ➞ | |
 | NWBI Northwest Bancshares, Inc. |
| Sector: Financials | |
| SubSector: Savings & Loans | |
| MarketCap: 1266.3 Millions | |
| Recent Price: 10.78 Smart Investing & Trading Score: 17 | |
| Day Percent Change: 0.65% Day Change: 0.07 | |
| Week Change: -0.37% Year-to-date Change: -13.6% | |
| NWBI Links: Profile News Message Board | |
| Charts:- Daily , Weekly | |
| Add NWBI to Watchlist: View: Get Complete NWBI Trend Analysis ➞ | |
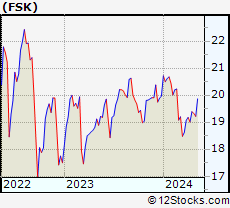 | FSK FS KKR Capital Corp. |
| Sector: Financials | |
| SubSector: Asset Management | |
| MarketCap: 1262.33 Millions | |
| Recent Price: 19.16 Smart Investing & Trading Score: 45 | |
| Day Percent Change: 0.58% Day Change: 0.11 | |
| Week Change: 0.79% Year-to-date Change: -4.1% | |
| FSK Links: Profile News Message Board | |
| Charts:- Daily , Weekly | |
| Add FSK to Watchlist: View: Get Complete FSK Trend Analysis ➞ | |
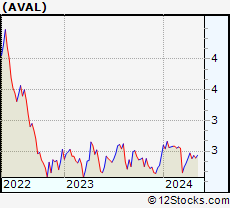 | AVAL Grupo Aval Acciones y Valores S.A. |
| Sector: Financials | |
| SubSector: Foreign Regional Banks | |
| MarketCap: 1259.79 Millions | |
| Recent Price: 2.35 Smart Investing & Trading Score: 30 | |
| Day Percent Change: -1.26% Day Change: -0.03 | |
| Week Change: -4.86% Year-to-date Change: -3.3% | |
| AVAL Links: Profile News Message Board | |
| Charts:- Daily , Weekly | |
| Add AVAL to Watchlist: View: Get Complete AVAL Trend Analysis ➞ | |
 | ALX Alexander s, Inc. |
| Sector: Financials | |
| SubSector: REIT - Retail | |
| MarketCap: 1251.54 Millions | |
| Recent Price: 205.46 Smart Investing & Trading Score: 5 | |
| Day Percent Change: -1.19% Day Change: -2.47 | |
| Week Change: -5.16% Year-to-date Change: -3.8% | |
| ALX Links: Profile News Message Board | |
| Charts:- Daily , Weekly | |
| Add ALX to Watchlist: View: Get Complete ALX Trend Analysis ➞ | |
 | INTR Inter & Co, Inc. |
| Sector: Financials | |
| SubSector: Banks - Regional | |
| MarketCap: 1250 Millions | |
| Recent Price: 5.07 Smart Investing & Trading Score: 38 | |
| Day Percent Change: 0.20% Day Change: 0.01 | |
| Week Change: -5.76% Year-to-date Change: -9.6% | |
| INTR Links: Profile News Message Board | |
| Charts:- Daily , Weekly | |
| Add INTR to Watchlist: View: Get Complete INTR Trend Analysis ➞ | |
 | OPI Office Properties Income Trust |
| Sector: Financials | |
| SubSector: REIT - Office | |
| MarketCap: 1245.66 Millions | |
| Recent Price: 1.88 Smart Investing & Trading Score: 25 | |
| Day Percent Change: -0.53% Day Change: -0.01 | |
| Week Change: -7.84% Year-to-date Change: -74.3% | |
| OPI Links: Profile News Message Board | |
| Charts:- Daily , Weekly | |
| Add OPI to Watchlist: View: Get Complete OPI Trend Analysis ➞ | |
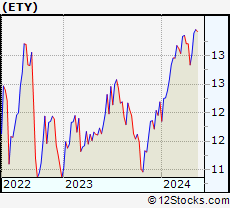 | ETY Eaton Vance Tax-Managed Diversified Equity Income Fund |
| Sector: Financials | |
| SubSector: Closed-End Fund - Equity | |
| MarketCap: 1228.97 Millions | |
| Recent Price: 12.86 Smart Investing & Trading Score: 41 | |
| Day Percent Change: 0.08% Day Change: 0.01 | |
| Week Change: -2.65% Year-to-date Change: 5.5% | |
| ETY Links: Profile News Message Board | |
| Charts:- Daily , Weekly | |
| Add ETY to Watchlist: View: Get Complete ETY Trend Analysis ➞ | |
 | FCPT Four Corners Property Trust, Inc. |
| Sector: Financials | |
| SubSector: REIT - Hotel/Motel | |
| MarketCap: 1218.94 Millions | |
| Recent Price: 22.66 Smart Investing & Trading Score: 17 | |
| Day Percent Change: 0.40% Day Change: 0.09 | |
| Week Change: -2.91% Year-to-date Change: -10.4% | |
| FCPT Links: Profile News Message Board | |
| Charts:- Daily , Weekly | |
| Add FCPT to Watchlist: View: Get Complete FCPT Trend Analysis ➞ | |
 | TCBI Texas Capital Bancshares, Inc. |
| Sector: Financials | |
| SubSector: Regional - Southwest Banks | |
| MarketCap: 1202.75 Millions | |
| Recent Price: 55.98 Smart Investing & Trading Score: 10 | |
| Day Percent Change: 0.11% Day Change: 0.06 | |
| Week Change: -0.96% Year-to-date Change: -13.4% | |
| TCBI Links: Profile News Message Board | |
| Charts:- Daily , Weekly | |
| Add TCBI to Watchlist: View: Get Complete TCBI Trend Analysis ➞ | |
 | EIG Employers Holdings, Inc. |
| Sector: Financials | |
| SubSector: Accident & Health Insurance | |
| MarketCap: 1202.6 Millions | |
| Recent Price: 43.10 Smart Investing & Trading Score: 63 | |
| Day Percent Change: 1.46% Day Change: 0.62 | |
| Week Change: 1.15% Year-to-date Change: 9.4% | |
| EIG Links: Profile News Message Board | |
| Charts:- Daily , Weekly | |
| Add EIG to Watchlist: View: Get Complete EIG Trend Analysis ➞ | |
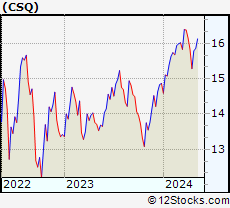 | CSQ Calamos Strategic Total Return Fund |
| Sector: Financials | |
| SubSector: Closed-End Fund - Debt | |
| MarketCap: 1196.17 Millions | |
| Recent Price: 15.47 Smart Investing & Trading Score: 23 | |
| Day Percent Change: 0.26% Day Change: 0.04 | |
| Week Change: -2.27% Year-to-date Change: 4.0% | |
| CSQ Links: Profile News Message Board | |
| Charts:- Daily , Weekly | |
| Add CSQ to Watchlist: View: Get Complete CSQ Trend Analysis ➞ | |
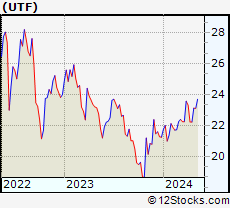 | UTF Cohen & Steers Infrastructure Fund, Inc |
| Sector: Financials | |
| SubSector: Closed-End Fund - Equity | |
| MarketCap: 1195.37 Millions | |
| Recent Price: 22.00 Smart Investing & Trading Score: 27 | |
| Day Percent Change: 1.38% Day Change: 0.30 | |
| Week Change: -0.99% Year-to-date Change: 3.6% | |
| UTF Links: Profile News Message Board | |
| Charts:- Daily , Weekly | |
| Add UTF to Watchlist: View: Get Complete UTF Trend Analysis ➞ | |
 | IIPR Innovative Industrial Properties, Inc. |
| Sector: Financials | |
| SubSector: REIT - Industrial | |
| MarketCap: 1193.29 Millions | |
| Recent Price: 93.88 Smart Investing & Trading Score: 41 | |
| Day Percent Change: 0.28% Day Change: 0.26 | |
| Week Change: -4.5% Year-to-date Change: -6.9% | |
| IIPR Links: Profile News Message Board | |
| Charts:- Daily , Weekly | |
| Add IIPR to Watchlist: View: Get Complete IIPR Trend Analysis ➞ | |
 | WSFS WSFS Financial Corporation |
| Sector: Financials | |
| SubSector: Regional - Mid-Atlantic Banks | |
| MarketCap: 1191.29 Millions | |
| Recent Price: 41.85 Smart Investing & Trading Score: 35 | |
| Day Percent Change: 0.26% Day Change: 0.11 | |
| Week Change: -2.11% Year-to-date Change: -8.9% | |
| WSFS Links: Profile News Message Board | |
| Charts:- Daily , Weekly | |
| Add WSFS to Watchlist: View: Get Complete WSFS Trend Analysis ➞ | |
 | BANR Banner Corporation |
| Sector: Financials | |
| SubSector: Regional - Mid-Atlantic Banks | |
| MarketCap: 1187.09 Millions | |
| Recent Price: 43.73 Smart Investing & Trading Score: 42 | |
| Day Percent Change: 1.34% Day Change: 0.58 | |
| Week Change: -0.43% Year-to-date Change: -18.4% | |
| BANR Links: Profile News Message Board | |
| Charts:- Daily , Weekly | |
| Add BANR to Watchlist: View: Get Complete BANR Trend Analysis ➞ | |
 | IVR Invesco Mortgage Capital Inc. |
| Sector: Financials | |
| SubSector: Mortgage Investment | |
| MarketCap: 1182.19 Millions | |
| Recent Price: 8.09 Smart Investing & Trading Score: 20 | |
| Day Percent Change: -0.49% Day Change: -0.04 | |
| Week Change: -4.49% Year-to-date Change: -8.7% | |
| IVR Links: Profile News Message Board | |
| Charts:- Daily , Weekly | |
| Add IVR to Watchlist: View: Get Complete IVR Trend Analysis ➞ | |
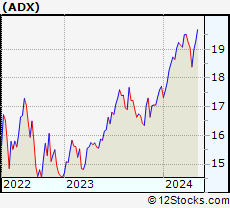 | ADX Adams Diversified Equity Fund, Inc. |
| Sector: Financials | |
| SubSector: Closed-End Fund - Equity | |
| MarketCap: 1172.77 Millions | |
| Recent Price: 18.60 Smart Investing & Trading Score: 36 | |
| Day Percent Change: -0.75% Day Change: -0.14 | |
| Week Change: -2.46% Year-to-date Change: 5.0% | |
| ADX Links: Profile News Message Board | |
| Charts:- Daily , Weekly | |
| Add ADX to Watchlist: View: Get Complete ADX Trend Analysis ➞ | |
 | MAC The Macerich Company |
| Sector: Financials | |
| SubSector: REIT - Retail | |
| MarketCap: 1172.54 Millions | |
| Recent Price: 15.17 Smart Investing & Trading Score: 0 | |
| Day Percent Change: -1.30% Day Change: -0.20 | |
| Week Change: -5.66% Year-to-date Change: -1.7% | |
| MAC Links: Profile News Message Board | |
| Charts:- Daily , Weekly | |
| Add MAC to Watchlist: View: Get Complete MAC Trend Analysis ➞ | |
 | FBRT Franklin BSP Realty Trust, Inc. |
| Sector: Financials | |
| SubSector: REIT - Mortgage | |
| MarketCap: 1170 Millions | |
| Recent Price: 12.43 Smart Investing & Trading Score: 32 | |
| Day Percent Change: 1.76% Day Change: 0.21 | |
| Week Change: 0.53% Year-to-date Change: -8.8% | |
| FBRT Links: Profile News Message Board | |
| Charts:- Daily , Weekly | |
| Add FBRT to Watchlist: View: Get Complete FBRT Trend Analysis ➞ | |
| For tabular summary view of above stock list: Summary View ➞ 0 - 25 , 25 - 50 , 50 - 75 , 75 - 100 , 100 - 125 , 125 - 150 , 150 - 175 , 175 - 200 , 200 - 225 , 225 - 250 , 250 - 275 , 275 - 300 , 300 - 325 , 325 - 350 , 350 - 375 , 375 - 400 , 400 - 425 , 425 - 450 , 450 - 475 , 475 - 500 , 500 - 525 , 525 - 550 , 550 - 575 , 575 - 600 , 600 - 625 , 625 - 650 , 650 - 675 , 675 - 700 , 700 - 725 , 725 - 750 , 750 - 775 , 775 - 800 , 800 - 825 , 825 - 850 , 850 - 875 , 875 - 900 , 900 - 925 , 925 - 950 , 950 - 975 , 975 - 1000 , 1000 - 1025 , 1025 - 1050 , 1050 - 1075 , 1075 - 1100 , 1100 - 1125 , 1125 - 1150 , 1150 - 1175 , 1175 - 1200 , 1200 - 1225 , 1225 - 1250 | ||
| Click To Change The Sort Order: By Market Cap or Company Size Performance: Year-to-date, Week and Day | |
| Select Chart Type: | ||
|
Best Stocks Today 12Stocks.com |
© 2024 12Stocks.com Terms & Conditions Privacy Contact Us
All Information Provided Only For Education And Not To Be Used For Investing or Trading. See Terms & Conditions


One More Thing ... Get Best Stocks Delivered Daily!
Never Ever Miss A Move With Our Top Ten Stocks Lists
Find Best Stocks In Any Market - Bull or Bear Market
Take A Peek At Our Top Ten Stocks Lists: Daily, Weekly, Year-to-Date & Top Trends
Find Best Stocks In Any Market - Bull or Bear Market
Take A Peek At Our Top Ten Stocks Lists: Daily, Weekly, Year-to-Date & Top Trends
Financial Stocks With Best Up Trends [0-bearish to 100-bullish]: Medical Properties[100], Macatawa Bank[100], Stellus Capital[100], Regional Management[100], Angel Oak[95], HDFC Bank[93], Charles Schwab[93], Fidus [93], Western Asset[93], BlackRock MuniYield[93], Wells Fargo[90]
Best Financial Stocks Year-to-Date:
Root [389.97%], Hippo [128.32%], Gladstone Capital[93.22%], Banco Macro[68.33%], Grupo Financiero[62.35%], Yiren Digital[55.45%], Fidelis Insurance[53.3%], First [50.82%], Banco BBVA[48.35%], EverQuote [48.04%], Heritage Insurance[45.55%] Best Financial Stocks This Week:
Macatawa Bank[44.42%], Medical Properties[25.06%], Globe Life[10%], James River[8.87%], GoHealth [7.45%], Victory Capital[6.87%], Bancorp [5.43%], Huize Holding[5.3%], Green Dot[5.25%], LCNB [5.2%], ESSA Bancorp[4.94%] Best Financial Stocks Daily:
Oportun [9.86%], Cipher Mining[8.65%], Ally [6.73%], eHealth [6.22%], Coinbase Global[5.90%], C&F [5.65%], James River[5.62%], Tejon Ranch[5.44%], Bank OZK[4.73%], Medical Properties[4.61%], Claros Mortgage[4.52%]