
 Login Sign Up


| |||||
 |  | ||||

| 12Stocks.com Market Intelligence |
Best Financial Stocks
| In a hurry? Financial Stocks Lists: Performance Trends Table, Stock Charts
Sort Financial stocks: Daily, Weekly, Year-to-Date, Market Cap & Trends. Filter Financial stocks list by size:All Financial Large Mid-Range Small & MicroCap |
| 12Stocks.com Financial Stocks Performances & Trends Daily | |||||||||
|
|  The overall Smart Investing & Trading Score is 63 (0-bearish to 100-bullish) which puts Financial sector in short term neutral to bullish trend. The Smart Investing & Trading Score from previous trading session is 56 and hence an improvement of trend.
| ||||||||
Here are the Smart Investing & Trading Scores of the most requested Financial stocks at 12Stocks.com (click stock name for detailed review):
|


| 12Stocks.com: Investing in Financial sector with Stocks | |
|
The following table helps investors and traders sort through current performance and trends (as measured by Smart Investing & Trading Score) of various
stocks in the Financial sector. Quick View: Move mouse or cursor over stock symbol (ticker) to view short-term Technical chart and over stock name to view long term chart. Click on  to add stock symbol to your watchlist and to add stock symbol to your watchlist and  to view watchlist. Click on any ticker or stock name for detailed market intelligence report for that stock. to view watchlist. Click on any ticker or stock name for detailed market intelligence report for that stock. |
12Stocks.com Performance of Stocks in Financial Sector
| Ticker | Stock Name | Watchlist | Category | Recent Price | Trend Score | Change % | YTD Change% |
| BNS | Bank of Nova Scotia |   | Banks | 46.74 | 37 | 0.37% | -4.00% |
| PLD | Prologis | | REIT - Industrial | 103.49 | 0 | -1.15% | -22.36% |
| ITUB | Itau Unibanco | | Foreign Banks | 6.05 | 25 | 0.33% | -12.95% |
| BAM | Brookfield Asset | | Real Estatet | 38.32 | 18 | -0.26% | -4.61% |
| ICE | Intercontinental Exchange | | Investments | 131.21 | 58 | 0.18% | 2.16% |
| EQIX | Equinix . | | REIT - | 748.00 | 32 | 1.10% | -7.13% |
| SCHW | Charles Schwab | | Brokerage | 73.42 | 93 | 0.67% | 6.72% |
| TFC | Truist | | Regional Banks | 36.80 | 55 | 3.05% | -0.33% |
| SAN | Banco Santander | | Foreign Banks | 4.75 | 68 | 0.00% | 14.73% |
| GOCO | GoHealth | | Insurance | 10.13 | 35 | -1.07% | -22.85% |
| PGR | Progressive | | Insurance | 214.69 | 95 | 2.36% | 34.79% |
| MMC | Marsh & McLennan | | Insurance | 202.41 | 51 | 0.34% | 6.83% |
| PNC | PNC | | Banks | 152.30 | 55 | 2.98% | -1.65% |
| RKT | Rocket | | Mortgage Finance | 11.62 | 25 | 0.78% | -19.75% |
| CCAP | Crescent Capital | | Asset Mgmt | 17.16 | 76 | 0.50% | -1.24% |
| SLQT | SelectQuote | | Insurance | 1.71 | 63 | -0.87% | 24.45% |
| FTHM | Fathom | | Real Estate Services | 1.52 | 0 | -2.56% | -56.70% |
| LANDO | Gladstone Land | | REIT Industrial | 19.29 | 27 | 0.05% | -0.05% |
| NU | Nu | | Banks - | 10.48 | 26 | -3.94% | 25.66% |
| HUIZ | Huize Holding | | Insurance | 0.62 | 54 | -2.36% | -31.44% |
| AON | Aon | | Insurance | 310.19 | 58 | 0.48% | 6.59% |
| UBS | UBS | | Foreign Banks | 28.06 | 25 | -0.21% | -9.19% |
| SMFG | Sumitomo Mitsui | | Foreign Banks | 11.17 | 43 | 0.27% | 15.39% |
| ROOT | Root | | Insurance Property & Casualty | 51.74 | 43 | 0.86% | 394.17% |
| LU | Lufax Holding | | Credit Services | 4.35 | 83 | 1.87% | 41.69% |
| For chart view version of above stock list: Chart View ➞ 0 - 25 , 25 - 50 , 50 - 75 , 75 - 100 , 100 - 125 , 125 - 150 , 150 - 175 , 175 - 200 , 200 - 225 , 225 - 250 , 250 - 275 , 275 - 300 , 300 - 325 , 325 - 350 , 350 - 375 , 375 - 400 , 400 - 425 , 425 - 450 , 450 - 475 , 475 - 500 , 500 - 525 , 525 - 550 , 550 - 575 , 575 - 600 , 600 - 625 , 625 - 650 , 650 - 675 , 675 - 700 , 700 - 725 , 725 - 750 , 750 - 775 , 775 - 800 , 800 - 825 , 825 - 850 , 850 - 875 , 875 - 900 , 900 - 925 , 925 - 950 , 950 - 975 , 975 - 1000 , 1000 - 1025 , 1025 - 1050 , 1050 - 1075 , 1075 - 1100 , 1100 - 1125 , 1125 - 1150 , 1150 - 1175 , 1175 - 1200 , 1200 - 1225 , 1225 - 1250 | ||
 | Click To Change The Sort Order: By Market Cap or Company Size Performance: Year-to-date, Week and Day |  |
|
Get the most comprehensive stock market coverage daily at 12Stocks.com ➞ Best Stocks Today ➞ Best Stocks Weekly ➞ Best Stocks Year-to-Date ➞ Best Stocks Trends ➞  Best Stocks Today 12Stocks.com Best Nasdaq Stocks ➞ Best S&P 500 Stocks ➞ Best Tech Stocks ➞ Best Biotech Stocks ➞ |
| Detailed Overview of Financial Stocks |
| Financial Technical Overview, Leaders & Laggards, Top Financial ETF Funds & Detailed Financial Stocks List, Charts, Trends & More |
| Financial Sector: Technical Analysis, Trends & YTD Performance | |
| Financial sector is composed of stocks
from banks, brokers, insurance, REITs
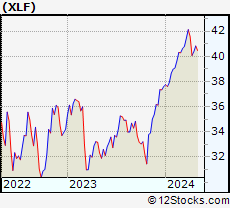
and services subsectors. Financial sector, as represented by XLF, an exchange-traded fund [ETF] that holds basket of Financial stocks (e.g, Bank of America, Goldman Sachs) is up by 7.39% and is currently outperforming the overall market by 4.01% year-to-date. Below is a quick view of Technical charts and trends: |
|
 XLF Weekly Chart |
|
| Long Term Trend: Very Good | |
| Medium Term Trend: Not Good | |
 XLF Daily Chart |
|
| Short Term Trend: Very Good | |
| Overall Trend Score: 63 | |
| YTD Performance: 7.39% | |
| **Trend Scores & Views Are Only For Educational Purposes And Not For Investing | |
| 12Stocks.com: Top Performing Financial Sector Stocks | ||||||||||||||||||||||||||||||||||||||||||||||||
 The top performing Financial sector stocks year to date are
Now, more recently, over last week, the top performing Financial sector stocks on the move are


|
||||||||||||||||||||||||||||||||||||||||||||||||
| 12Stocks.com: Investing in Financial Sector using Exchange Traded Funds | |
|
The following table shows list of key exchange traded funds (ETF) that
help investors track Financial Index. For detailed view, check out our ETF Funds section of our website. Quick View: Move mouse or cursor over ETF symbol (ticker) to view short-term Technical chart and over ETF name to view long term chart. Click on ticker or stock name for detailed view. Click on to add stock symbol to your watchlist and to view watchlist. |
12Stocks.com List of ETFs that track Financial Index
| Ticker | ETF Name | Watchlist | Recent Price | Smart Investing & Trading Score | Change % | Week % | Year-to-date % |
| XLF | Financial | | 40.38 | 63 | 1.38 | 0.8 | 7.39% |
| IAI | Broker-Dealers & Secs | | 111.03 | 63 | 0.47 | 0.18 | 2.3% |
| IYF | Financials | | 91.30 | 48 | 1.40 | 0.83 | 6.9% |
| IYG | Financial Services | | 63.42 | 48 | 1.19 | 0.33 | 6.16% |
| KRE | Regional Banking | | 47.32 | 27 | 2.62 | 1.72 | -9.75% |
| IXG | Global Financials | | 82.86 | 48 | 0.64 | 0.24 | 5.45% |
| VFH | Financials | | 97.75 | 48 | 1.40 | 0.59 | 5.95% |
| KBE | Bank | | 44.41 | 42 | 2.33 | 1.42 | -3.5% |
| FAS | Financial Bull 3X | | 97.93 | 63 | 4.03 | 1.78 | 18.49% |
| FAZ | Financial Bear 3X | | 11.20 | 32 | -3.95 | -1.84 | -18.07% |
| UYG | Financials | | 62.44 | 63 | 2.78 | 1.58 | 13.12% |
| IAT | Regional Banks | | 40.74 | 27 | 2.52 | 0.74 | -2.63% |
| KIE | Insurance | | 49.08 | 58 | 1.66 | 1.57 | 8.54% |
| PSCF | SmallCap Financials | | 45.47 | 22 | 1.59 | 0.13 | -7.54% |
| EUFN | Europe Financials | | 21.95 | 48 | 0.37 | 0.27 | 4.72% |
| PGF | Financial Preferred | | 14.53 | 17 | 0.55 | -1.02 | -0.34% |
| 12Stocks.com: Charts, Trends, Fundamental Data and Performances of Financial Stocks | |
|
We now take in-depth look at all Financial stocks including charts, multi-period performances and overall trends (as measured by Smart Investing & Trading Score). One can sort Financial stocks (click link to choose) by Daily, Weekly and by Year-to-Date performances. Also, one can sort by size of the company or by market capitalization. |
| Select Your Default Chart Type: | |||||
| |||||
| Click on stock symbol or name for detailed view. Click on to add stock symbol to your watchlist and to view watchlist. Quick View: Move mouse or cursor over "Daily" to quickly view daily Technical stock chart and over "Weekly" to view weekly Technical stock chart. | |||||

 | BNS The Bank of Nova Scotia |
| Sector: Financials | |
| SubSector: Money Center Banks | |
| MarketCap: 48742.1 Millions | |
| Recent Price: 46.74 Smart Investing & Trading Score: 37 | |
| Day Percent Change: 0.37% Day Change: 0.17 | |
| Week Change: -3.01% Year-to-date Change: -4.0% | |
| BNS Links: Profile News Message Board | |
| Charts:- Daily , Weekly | |
| Add BNS to Watchlist: View: Get Complete BNS Trend Analysis ➞ | |
 | PLD Prologis, Inc. |
| Sector: Financials | |
| SubSector: REIT - Industrial | |
| MarketCap: 48728.9 Millions | |
| Recent Price: 103.49 Smart Investing & Trading Score: 0 | |
| Day Percent Change: -1.15% Day Change: -1.20 | |
| Week Change: -13.03% Year-to-date Change: -22.4% | |
| PLD Links: Profile News Message Board | |
| Charts:- Daily , Weekly | |
| Add PLD to Watchlist: View: Get Complete PLD Trend Analysis ➞ | |
 | ITUB Itau Unibanco Holding S.A. |
| Sector: Financials | |
| SubSector: Foreign Regional Banks | |
| MarketCap: 48121 Millions | |
| Recent Price: 6.05 Smart Investing & Trading Score: 25 | |
| Day Percent Change: 0.33% Day Change: 0.02 | |
| Week Change: -4.72% Year-to-date Change: -13.0% | |
| ITUB Links: Profile News Message Board | |
| Charts:- Daily , Weekly | |
| Add ITUB to Watchlist: View: Get Complete ITUB Trend Analysis ➞ | |
 | BAM Brookfield Asset Management Inc. |
| Sector: Financials | |
| SubSector: Real Estate Development | |
| MarketCap: 47134.9 Millions | |
| Recent Price: 38.32 Smart Investing & Trading Score: 18 | |
| Day Percent Change: -0.26% Day Change: -0.10 | |
| Week Change: -2.69% Year-to-date Change: -4.6% | |
| BAM Links: Profile News Message Board | |
| Charts:- Daily , Weekly | |
| Add BAM to Watchlist: View: Get Complete BAM Trend Analysis ➞ | |
 | ICE Intercontinental Exchange, Inc. |
| Sector: Financials | |
| SubSector: Diversified Investments | |
| MarketCap: 46054.6 Millions | |
| Recent Price: 131.21 Smart Investing & Trading Score: 58 | |
| Day Percent Change: 0.18% Day Change: 0.23 | |
| Week Change: -1.75% Year-to-date Change: 2.2% | |
| ICE Links: Profile News Message Board | |
| Charts:- Daily , Weekly | |
| Add ICE to Watchlist: View: Get Complete ICE Trend Analysis ➞ | |
 | EQIX Equinix, Inc. (REIT) |
| Sector: Financials | |
| SubSector: REIT - Diversified | |
| MarketCap: 45855.3 Millions | |
| Recent Price: 748.00 Smart Investing & Trading Score: 32 | |
| Day Percent Change: 1.10% Day Change: 8.15 | |
| Week Change: -3.34% Year-to-date Change: -7.1% | |
| EQIX Links: Profile News Message Board | |
| Charts:- Daily , Weekly | |
| Add EQIX to Watchlist: View: Get Complete EQIX Trend Analysis ➞ | |
 | SCHW The Charles Schwab Corporation |
| Sector: Financials | |
| SubSector: Investment Brokerage - National | |
| MarketCap: 45115.8 Millions | |
| Recent Price: 73.42 Smart Investing & Trading Score: 93 | |
| Day Percent Change: 0.67% Day Change: 0.49 | |
| Week Change: 4.84% Year-to-date Change: 6.7% | |
| SCHW Links: Profile News Message Board | |
| Charts:- Daily , Weekly | |
| Add SCHW to Watchlist: View: Get Complete SCHW Trend Analysis ➞ | |
 | TFC Truist Financial Corporation |
| Sector: Financials | |
| SubSector: Regional - Southeast Banks | |
| MarketCap: 44928.5 Millions | |
| Recent Price: 36.80 Smart Investing & Trading Score: 55 | |
| Day Percent Change: 3.05% Day Change: 1.09 | |
| Week Change: 0.08% Year-to-date Change: -0.3% | |
| TFC Links: Profile News Message Board | |
| Charts:- Daily , Weekly | |
| Add TFC to Watchlist: View: Get Complete TFC Trend Analysis ➞ | |
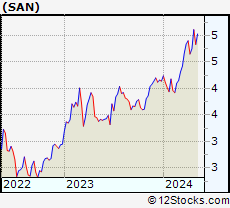 | SAN Banco Santander, S.A. |
| Sector: Financials | |
| SubSector: Foreign Money Center Banks | |
| MarketCap: 44592.5 Millions | |
| Recent Price: 4.75 Smart Investing & Trading Score: 68 | |
| Day Percent Change: 0.00% Day Change: 0.00 | |
| Week Change: 2.15% Year-to-date Change: 14.7% | |
| SAN Links: Profile News Message Board | |
| Charts:- Daily , Weekly | |
| Add SAN to Watchlist: View: Get Complete SAN Trend Analysis ➞ | |
 | GOCO GoHealth, Inc. |
| Sector: Financials | |
| SubSector: Insurance Brokers | |
| MarketCap: 44157 Millions | |
| Recent Price: 10.13 Smart Investing & Trading Score: 35 | |
| Day Percent Change: -1.07% Day Change: -0.11 | |
| Week Change: 6.3% Year-to-date Change: -22.9% | |
| GOCO Links: Profile News Message Board | |
| Charts:- Daily , Weekly | |
| Add GOCO to Watchlist: View: Get Complete GOCO Trend Analysis ➞ | |
 | PGR The Progressive Corporation |
| Sector: Financials | |
| SubSector: Property & Casualty Insurance | |
| MarketCap: 43112 Millions | |
| Recent Price: 214.69 Smart Investing & Trading Score: 95 | |
| Day Percent Change: 2.36% Day Change: 4.94 | |
| Week Change: 5.29% Year-to-date Change: 34.8% | |
| PGR Links: Profile News Message Board | |
| Charts:- Daily , Weekly | |
| Add PGR to Watchlist: View: Get Complete PGR Trend Analysis ➞ | |
 | MMC Marsh & McLennan Companies, Inc. |
| Sector: Financials | |
| SubSector: Insurance Brokers | |
| MarketCap: 42821.8 Millions | |
| Recent Price: 202.41 Smart Investing & Trading Score: 51 | |
| Day Percent Change: 0.34% Day Change: 0.68 | |
| Week Change: 2.19% Year-to-date Change: 6.8% | |
| MMC Links: Profile News Message Board | |
| Charts:- Daily , Weekly | |
| Add MMC to Watchlist: View: Get Complete MMC Trend Analysis ➞ | |
 | PNC The PNC Financial Services Group, Inc. |
| Sector: Financials | |
| SubSector: Money Center Banks | |
| MarketCap: 41291.5 Millions | |
| Recent Price: 152.30 Smart Investing & Trading Score: 55 | |
| Day Percent Change: 2.98% Day Change: 4.41 | |
| Week Change: 1.11% Year-to-date Change: -1.7% | |
| PNC Links: Profile News Message Board | |
| Charts:- Daily , Weekly | |
| Add PNC to Watchlist: View: Get Complete PNC Trend Analysis ➞ | |
 | RKT Rocket Companies, Inc. |
| Sector: Financials | |
| SubSector: Mortgage Finance | |
| MarketCap: 41287 Millions | |
| Recent Price: 11.62 Smart Investing & Trading Score: 25 | |
| Day Percent Change: 0.78% Day Change: 0.09 | |
| Week Change: -5.14% Year-to-date Change: -19.8% | |
| RKT Links: Profile News Message Board | |
| Charts:- Daily , Weekly | |
| Add RKT to Watchlist: View: Get Complete RKT Trend Analysis ➞ | |
 | CCAP Crescent Capital BDC, Inc. |
| Sector: Financials | |
| SubSector: Asset Management | |
| MarketCap: 41157 Millions | |
| Recent Price: 17.16 Smart Investing & Trading Score: 76 | |
| Day Percent Change: 0.50% Day Change: 0.09 | |
| Week Change: 1.21% Year-to-date Change: -1.2% | |
| CCAP Links: Profile News Message Board | |
| Charts:- Daily , Weekly | |
| Add CCAP to Watchlist: View: Get Complete CCAP Trend Analysis ➞ | |
 | SLQT SelectQuote, Inc. |
| Sector: Financials | |
| SubSector: Insurance Brokers | |
| MarketCap: 38257 Millions | |
| Recent Price: 1.71 Smart Investing & Trading Score: 63 | |
| Day Percent Change: -0.87% Day Change: -0.01 | |
| Week Change: -0.29% Year-to-date Change: 24.5% | |
| SLQT Links: Profile News Message Board | |
| Charts:- Daily , Weekly | |
| Add SLQT to Watchlist: View: Get Complete SLQT Trend Analysis ➞ | |
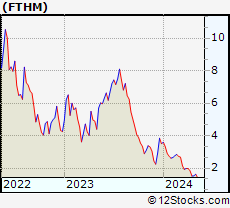 | FTHM Fathom Holdings Inc. |
| Sector: Financials | |
| SubSector: Real Estate Services | |
| MarketCap: 37267 Millions | |
| Recent Price: 1.52 Smart Investing & Trading Score: 0 | |
| Day Percent Change: -2.56% Day Change: -0.04 | |
| Week Change: -17.84% Year-to-date Change: -56.7% | |
| FTHM Links: Profile News Message Board | |
| Charts:- Daily , Weekly | |
| Add FTHM to Watchlist: View: Get Complete FTHM Trend Analysis ➞ | |
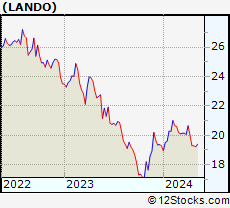 | LANDO Gladstone Land Corporation |
| Sector: Financials | |
| SubSector: REIT Industrial | |
| MarketCap: 37267 Millions | |
| Recent Price: 19.29 Smart Investing & Trading Score: 27 | |
| Day Percent Change: 0.05% Day Change: 0.01 | |
| Week Change: -3.55% Year-to-date Change: -0.1% | |
| LANDO Links: Profile News Message Board | |
| Charts:- Daily , Weekly | |
| Add LANDO to Watchlist: View: Get Complete LANDO Trend Analysis ➞ | |
 | NU Nu Holdings Ltd. |
| Sector: Financials | |
| SubSector: Banks - Diversified | |
| MarketCap: 37240 Millions | |
| Recent Price: 10.48 Smart Investing & Trading Score: 26 | |
| Day Percent Change: -3.94% Day Change: -0.43 | |
| Week Change: -7.17% Year-to-date Change: 25.7% | |
| NU Links: Profile News Message Board | |
| Charts:- Daily , Weekly | |
| Add NU to Watchlist: View: Get Complete NU Trend Analysis ➞ | |
 | HUIZ Huize Holding Limited |
| Sector: Financials | |
| SubSector: Insurance Brokers | |
| MarketCap: 37157 Millions | |
| Recent Price: 0.62 Smart Investing & Trading Score: 54 | |
| Day Percent Change: -2.36% Day Change: -0.01 | |
| Week Change: 2.82% Year-to-date Change: -31.4% | |
| HUIZ Links: Profile News Message Board | |
| Charts:- Daily , Weekly | |
| Add HUIZ to Watchlist: View: Get Complete HUIZ Trend Analysis ➞ | |
 | AON Aon plc |
| Sector: Financials | |
| SubSector: Insurance Brokers | |
| MarketCap: 36870.1 Millions | |
| Recent Price: 310.19 Smart Investing & Trading Score: 58 | |
| Day Percent Change: 0.48% Day Change: 1.49 | |
| Week Change: 0.71% Year-to-date Change: 6.6% | |
| AON Links: Profile News Message Board | |
| Charts:- Daily , Weekly | |
| Add AON to Watchlist: View: Get Complete AON Trend Analysis ➞ | |
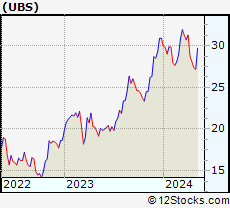 | UBS UBS Group AG |
| Sector: Financials | |
| SubSector: Foreign Money Center Banks | |
| MarketCap: 36840.4 Millions | |
| Recent Price: 28.06 Smart Investing & Trading Score: 25 | |
| Day Percent Change: -0.21% Day Change: -0.06 | |
| Week Change: -2.33% Year-to-date Change: -9.2% | |
| UBS Links: Profile News Message Board | |
| Charts:- Daily , Weekly | |
| Add UBS to Watchlist: View: Get Complete UBS Trend Analysis ➞ | |
 | SMFG Sumitomo Mitsui Financial Group, Inc. |
| Sector: Financials | |
| SubSector: Foreign Regional Banks | |
| MarketCap: 36648.5 Millions | |
| Recent Price: 11.17 Smart Investing & Trading Score: 43 | |
| Day Percent Change: 0.27% Day Change: 0.03 | |
| Week Change: -2.95% Year-to-date Change: 15.4% | |
| SMFG Links: Profile News Message Board | |
| Charts:- Daily , Weekly | |
| Add SMFG to Watchlist: View: Get Complete SMFG Trend Analysis ➞ | |
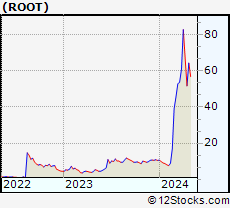 | ROOT Root, Inc. |
| Sector: Financials | |
| SubSector: Insurance Property & Casualty | |
| MarketCap: 35257 Millions | |
| Recent Price: 51.74 Smart Investing & Trading Score: 43 | |
| Day Percent Change: 0.86% Day Change: 0.44 | |
| Week Change: -22.52% Year-to-date Change: 394.2% | |
| ROOT Links: Profile News Message Board | |
| Charts:- Daily , Weekly | |
| Add ROOT to Watchlist: View: Get Complete ROOT Trend Analysis ➞ | |
 | LU Lufax Holding Ltd |
| Sector: Financials | |
| SubSector: Credit Services | |
| MarketCap: 33457 Millions | |
| Recent Price: 4.35 Smart Investing & Trading Score: 83 | |
| Day Percent Change: 1.87% Day Change: 0.08 | |
| Week Change: 5.07% Year-to-date Change: 41.7% | |
| LU Links: Profile News Message Board | |
| Charts:- Daily , Weekly | |
| Add LU to Watchlist: View: Get Complete LU Trend Analysis ➞ | |
| For tabular summary view of above stock list: Summary View ➞ 0 - 25 , 25 - 50 , 50 - 75 , 75 - 100 , 100 - 125 , 125 - 150 , 150 - 175 , 175 - 200 , 200 - 225 , 225 - 250 , 250 - 275 , 275 - 300 , 300 - 325 , 325 - 350 , 350 - 375 , 375 - 400 , 400 - 425 , 425 - 450 , 450 - 475 , 475 - 500 , 500 - 525 , 525 - 550 , 550 - 575 , 575 - 600 , 600 - 625 , 625 - 650 , 650 - 675 , 675 - 700 , 700 - 725 , 725 - 750 , 750 - 775 , 775 - 800 , 800 - 825 , 825 - 850 , 850 - 875 , 875 - 900 , 900 - 925 , 925 - 950 , 950 - 975 , 975 - 1000 , 1000 - 1025 , 1025 - 1050 , 1050 - 1075 , 1075 - 1100 , 1100 - 1125 , 1125 - 1150 , 1150 - 1175 , 1175 - 1200 , 1200 - 1225 , 1225 - 1250 | ||
| Click To Change The Sort Order: By Market Cap or Company Size Performance: Year-to-date, Week and Day | |
| Select Chart Type: | ||
|
Best Stocks Today 12Stocks.com |
© 2024 12Stocks.com Terms & Conditions Privacy Contact Us
All Information Provided Only For Education And Not To Be Used For Investing or Trading. See Terms & Conditions


One More Thing ... Get Best Stocks Delivered Daily!
Never Ever Miss A Move With Our Top Ten Stocks Lists
Find Best Stocks In Any Market - Bull or Bear Market
Take A Peek At Our Top Ten Stocks Lists: Daily, Weekly, Year-to-Date & Top Trends
Find Best Stocks In Any Market - Bull or Bear Market
Take A Peek At Our Top Ten Stocks Lists: Daily, Weekly, Year-to-Date & Top Trends
Financial Stocks With Best Up Trends [0-bearish to 100-bullish]: BancFirst [100], Old Second[100], Tejon Ranch[100], United Fire[100], Victory Capital[100], Wells Fargo[100], Macatawa Bank[100], Amerisafe [100], ASA Gold[100], Stellus Capital[100], Golub Capital[100]
Best Financial Stocks Year-to-Date:
Root [394.17%], Hippo [119.76%], Gladstone Capital[96.64%], Banco Macro[73.59%], Grupo Financiero[64.84%], Banco BBVA[57.54%], Yiren Digital[54.81%], First [51.04%], Fidelis Insurance[51.01%], EverQuote [50.25%], Heritage Insurance[46.93%] Best Financial Stocks This Week:
Macatawa Bank[47.34%], Metropolitan Bank[13.32%], Globe Life[12.95%], Medical Properties[10.78%], Victory Capital[10.59%], James River[10.4%], Chemung [10.1%], Southern First[9.19%], Summit [8.28%], BancFirst [7.85%], Bancorp [7.81%] Best Financial Stocks Daily:
Metropolitan Bank[18.01%], Chemung [10.29%], Cohen & Steers[9.50%], Clipper Realty[9.49%], BancFirst [8.86%], Summit [8.45%], Home Bancorp[7.41%], Bar Harbor[6.79%], Southern First[6.38%], American Express[6.23%], Banco BBVA[6.20%]