
 Login Sign Up


| |||||
 |  | ||||

| 12Stocks.com Market Intelligence |
Best Emerging Markets Stocks
| In a hurry? Emerging Markets Stocks Lists: Trends Table, Stock Charts
Sort Emerging Markets stocks: Daily, Weekly, Year-to-Date, Market Cap & Trends. Filter Emerging Markets stocks list by sector: Show all, Tech, Finance, Energy, Staples, Retail, Industrial, Materials, Utilities and HealthCare Filter Emerging Markets stocks list by size:All Large Medium Small |
| 12Stocks.com Emerging Markets Stocks Performances & Trends Daily | |||||||||
|
|  The overall Smart Investing & Trading Score is 68 (0-bearish to 100-bullish) which puts Emerging Markets index in short term neutral to bullish trend. The Smart Investing & Trading Score from previous trading session is 63 and hence an improvement of trend.
| ||||||||
Here are the Smart Investing & Trading Scores of the most requested Emerging Markets stocks at 12Stocks.com (click stock name for detailed review):
|


| 12Stocks.com: Top Performing Emerging Markets Index Stocks | ||||||||||||||||||||||||||||||||||||||||||||||||
 The top performing Emerging Markets Index stocks year to date are
Now, more recently, over last week, the top performing Emerging Markets Index stocks on the move are


|
||||||||||||||||||||||||||||||||||||||||||||||||
| 12Stocks.com: Investing in Emerging Markets Index with Stocks | |
|
The following table helps investors and traders sort through current performance and trends (as measured by Smart Investing & Trading Score ) of various
stocks in the Emerging Markets Index. Quick View: Move mouse or cursor over stock symbol (ticker) to view short-term technical chart and over stock name to view long term chart. Click on  to add stock symbol to your watchlist and to add stock symbol to your watchlist and  to view watchlist. Click on any ticker or stock name for detailed market intelligence report for that stock. to view watchlist. Click on any ticker or stock name for detailed market intelligence report for that stock. |
12Stocks.com Performance of Stocks in Emerging Markets Index
| Ticker | Stock Name | Watchlist | Category | Recent Price | Smart Investing & Trading Score | Change % | Weekly Change% |
| MLCO | Melco Resorts |   | Services & Goods | 6.20 | 25 | 0.49% | 0.73% |
| BBDO | Banco Bradesco | | Financials | 2.35 | 35 | 1.96% | 0.64% |
| LANV | Lanvin | | Services & Goods | 1.60 | 67 | 0.00% | 0.63% |
| SFWL | Shengfeng Development | | Industrials | 1.64 | 51 | 2.50% | 0.61% |
| VINP | Vi Partners | | Financials | 10.30 | 32 | -1.81% | 0.49% |
| RDY | Dr. Reddy | | Health Care | 71.49 | 45 | -0.91% | 0.49% |
| BEST | BEST | | Consumer Staples | 2.09 | 10 | -1.88% | 0.48% |
| HUYA | HUYA | | Services & Goods | 4.43 | 48 | 0.45% | 0.45% |
| ABEV | Ambev S.A | | Consumer Staples | 2.30 | 42 | 0.00% | 0.44% |
| VIV | Telefonica Brasil | | Technology | 9.39 | 42 | -0.21% | 0.43% |
| INTR | Inter & Co | | Financials | 5.23 | 58 | 0.38% | 0.38% |
| AZUL | Azul S.A | | Transports | 5.80 | 10 | -1.19% | 0.35% |
| VALE | Vale S.A | | Materials | 12.21 | 64 | 0.08% | 0.25% |
| LU | Lufax Holding | | Financials | 4.36 | 83 | -0.68% | 0.23% |
| SMI | Semiconductor | | Technology | 45.73 | 43 | 0.01% | 0.01% |
| AIXI | Xiao-I | | Technology | 1.42 | 27 | 6.77% | 0.00% |
| RERE | ATRenew | | Services & Goods | 1.58 | 46 | 1.94% | 0.00% |
| FENG | Phoenix New | | Technology | 1.82 | 43 | -2.15% | 0.00% |
| SVA | Sinovac Biotech | | Health Care | 6.47 | 27 | 0.00% | 0.00% |
| SID | Companhia Siderurgica | | Materials | 2.82 | 49 | -1.74% | 0.00% |
| GGB | Gerdau S.A | | Materials | 3.66 | 32 | -3.68% | 0.00% |
| CNF | CNFinance | | Financials | 1.84 | 17 | -0.81% | -0.27% |
| UGP | Ultrapar Participacoes | | Energy | 5.13 | 25 | -1.16% | -0.39% |
| LND | BrasilAgro - | | Financials | 4.99 | 80 | 0.40% | -0.40% |
| CIG | Companhia Energetica | | Utilities | 2.47 | 61 | 0.00% | -0.40% |
| For chart view version of above stock list: Chart View ➞ 0 - 25 , 25 - 50 , 50 - 75 , 75 - 100 , 100 - 125 , 125 - 150 , 150 - 175 , 175 - 200 | ||
 | Click To Change The Sort Order: By Market Cap or Company Size Performance: Year-to-date, Week and Day |  |
|
Get the most comprehensive stock market coverage daily at 12Stocks.com ➞ Best Stocks Today ➞ Best Stocks Weekly ➞ Best Stocks Year-to-Date ➞ Best Stocks Trends ➞  Best Stocks Today 12Stocks.com Best Nasdaq Stocks ➞ Best S&P 500 Stocks ➞ Best Tech Stocks ➞ Best Biotech Stocks ➞ |
| Detailed Overview of Emerging Markets Stocks |
| Emerging Markets Technical Overview, Leaders & Laggards, Top Emerging Markets ETF Funds & Detailed Emerging Markets Stocks List, Charts, Trends & More |
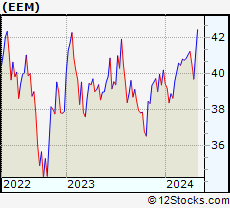
| Emerging Markets: Technical Analysis, Trends & YTD Performance | |
 EEM Weekly Chart |
|
| Long Term Trend: Very Good | |
| Medium Term Trend: Not Good | |
 EEM Daily Chart |
|
| Short Term Trend: Very Good | |
| Overall Trend Score: 68 | |
| YTD Performance: 0.65% | |
| **Trend Scores & Views Are Only For Educational Purposes And Not For Investing | |
| 12Stocks.com: Investing in Emerging Markets Index using Exchange Traded Funds | |
|
The following table shows list of key exchange traded funds (ETF) that
help investors play Emerging Markets stock market. For detailed view, check out our ETF Funds section of our website. Quick View: Move mouse or cursor over ETF symbol (ticker) to view short-term technical chart and over ETF name to view long term chart. Click on ticker or stock name for detailed view. Click on to add stock symbol to your watchlist and to view watchlist. |
12Stocks.com List of ETFs that track Emerging Markets Index
| Ticker | ETF Name | Watchlist | Recent Price | Smart Investing & Trading Score | Change % | Week % | Year-to-date % |
| EEM | Emerging Markets | | 40.47 | 68 | 0.82 | 1.91 | 0.65% |
| VWO | Emerging Markets | | 41.58 | 68 | 0.82 | 1.69 | 1.17% |
| SCHE | Emerging Markets Equity | | 25.10 | 68 | 0.76 | 1.66 | 1.25% |
| EWX | Emerging Markets Small | | 55.67 | 51 | 0.61 | 0.91 | -1.4% |
| EET | Emerging Markets | | 49.32 | 68 | 0.84 | 3.36 | -3.03% |
| EDC | Emrg Mkts Bull | | 28.67 | 63 | 2.47 | 5.91 | -5.78% |
| EEV | Short Emerging | | 19.76 | 32 | -1.69 | -3.69 | 0.19% |
| EUM | Short Emerging | | 14.22 | 32 | -0.82 | -1.86 | 0.51% |
| EDIV | Emerging Markets Dividend | | 33.01 | 51 | 0.12 | 0 | 1.51% |
| EMIF | Emerging Markets Infrastructure | | 21.62 | 68 | 0.23 | 1.12 | 1.03% |
| CEW | Emerging Currency Strat | | 17.61 | 38 | 0.03 | 0.06 | -2.17% |
| EBND | Em Mkts Lcl | | 20.02 | 35 | 0.40 | 0.45 | -5.74% |
| EMCB | Emerging Markets Corp | | 64.12 | 38 | 0.50 | 0.83 | 0.34% |
| VWOB | Emerging Mkts Govt | | 62.72 | 52 | 0.10 | 0.63 | -1.62% |
| EEMA | Emerging Markets Asia | | 67.48 | 75 | 1.09 | 2.11 | 2.08% |
| EELV | Em Mkts Low | | 23.46 | 45 | 0.51 | 1.31 | -2.4% |
| DVYE | Emerging Markets Dividend | | 26.56 | 88 | 0.15 | 0.3 | 0.26% |
| SDEM | SuperDividend Em Mkts | | 25.30 | 26 | -0.98 | -2.17 | 2.03% |
| DBEM | Em Mkts Hdgd | | 23.54 | 68 | 0.73 | 1.9 | 2.04% |
| PCY | Emerging Markets Sov | | 19.88 | 32 | 0.10 | 0.35 | -3.59% |
| QEMM | Emerging Mkts StratcFacts | | 56.93 | 63 | 0.90 | 1.37 | -0.39% |
| 12Stocks.com: Charts, Trends, Fundamental Data and Performances of Emerging Markets Stocks | |
|
We now take in-depth look at all Emerging Markets stocks including charts, multi-period performances and overall trends (as measured by Smart Investing & Trading Score ). One can sort Emerging Markets stocks (click link to choose) by Daily, Weekly and by Year-to-Date performances. Also, one can sort by size of the company or by market capitalization. |
| Select Your Default Chart Type: | |||||
| |||||
| Click on stock symbol or name for detailed view. Click on to add stock symbol to your watchlist and to view watchlist. Quick View: Move mouse or cursor over "Daily" to quickly view daily technical stock chart and over "Weekly" to view weekly technical stock chart. | |||||

 | MLCO Melco Resorts & Entertainment Limited |
| Sector: Services & Goods | |
| SubSector: Resorts & Casinos | |
| MarketCap: 7031.14 Millions | |
| Recent Price: 6.20 Smart Investing & Trading Score : 25 | |
| Day Percent Change: 0.49% Day Change: 0.03 | |
| Week Change: 0.73% Year-to-date Change: -30.1% | |
| MLCO Links: Profile News Message Board | |
| Charts:- Daily , Weekly | |
| Add MLCO to Watchlist: View: Get Complete MLCO Trend Analysis ➞ | |
 | BBDO Banco Bradesco S.A. |
| Sector: Financials | |
| SubSector: Foreign Regional Banks | |
| MarketCap: 27711.4 Millions | |
| Recent Price: 2.35 Smart Investing & Trading Score : 35 | |
| Day Percent Change: 1.96% Day Change: 0.05 | |
| Week Change: 0.64% Year-to-date Change: -26.3% | |
| BBDO Links: Profile News Message Board | |
| Charts:- Daily , Weekly | |
| Add BBDO to Watchlist: View: Get Complete BBDO Trend Analysis ➞ | |
 | LANV Lanvin Group Holdings Limited |
| Sector: Services & Goods | |
| SubSector: Luxury Goods | |
| MarketCap: 712 Millions | |
| Recent Price: 1.60 Smart Investing & Trading Score : 67 | |
| Day Percent Change: 0.00% Day Change: 0.00 | |
| Week Change: 0.63% Year-to-date Change: -47.7% | |
| LANV Links: Profile News Message Board | |
| Charts:- Daily , Weekly | |
| Add LANV to Watchlist: View: Get Complete LANV Trend Analysis ➞ | |
 | SFWL Shengfeng Development Limited |
| Sector: Industrials | |
| SubSector: Integrated Freight & Logistics | |
| MarketCap: 747 Millions | |
| Recent Price: 1.64 Smart Investing & Trading Score : 51 | |
| Day Percent Change: 2.50% Day Change: 0.04 | |
| Week Change: 0.61% Year-to-date Change: -40.4% | |
| SFWL Links: Profile News Message Board | |
| Charts:- Daily , Weekly | |
| Add SFWL to Watchlist: View: Get Complete SFWL Trend Analysis ➞ | |
 | VINP Vinci Partners Investments Ltd. |
| Sector: Financials | |
| SubSector: Asset Management | |
| MarketCap: 537 Millions | |
| Recent Price: 10.30 Smart Investing & Trading Score : 32 | |
| Day Percent Change: -1.81% Day Change: -0.19 | |
| Week Change: 0.49% Year-to-date Change: -6.3% | |
| VINP Links: Profile News Message Board | |
| Charts:- Daily , Weekly | |
| Add VINP to Watchlist: View: Get Complete VINP Trend Analysis ➞ | |
 | RDY Dr. Reddy s Laboratories Limited |
| Sector: Health Care | |
| SubSector: Drug Manufacturers - Other | |
| MarketCap: 6590.23 Millions | |
| Recent Price: 71.49 Smart Investing & Trading Score : 45 | |
| Day Percent Change: -0.91% Day Change: -0.66 | |
| Week Change: 0.49% Year-to-date Change: 2.8% | |
| RDY Links: Profile News Message Board | |
| Charts:- Daily , Weekly | |
| Add RDY to Watchlist: View: Get Complete RDY Trend Analysis ➞ | |
 | BEST BEST Inc. |
| Sector: Consumer Staples | |
| SubSector: Packaging & Containers | |
| MarketCap: 1981.73 Millions | |
| Recent Price: 2.09 Smart Investing & Trading Score : 10 | |
| Day Percent Change: -1.88% Day Change: -0.04 | |
| Week Change: 0.48% Year-to-date Change: -18.1% | |
| BEST Links: Profile News Message Board | |
| Charts:- Daily , Weekly | |
| Add BEST to Watchlist: View: Get Complete BEST Trend Analysis ➞ | |
 | HUYA HUYA Inc. |
| Sector: Services & Goods | |
| SubSector: Entertainment - Diversified | |
| MarketCap: 3358.17 Millions | |
| Recent Price: 4.43 Smart Investing & Trading Score : 48 | |
| Day Percent Change: 0.45% Day Change: 0.02 | |
| Week Change: 0.45% Year-to-date Change: 21.0% | |
| HUYA Links: Profile News Message Board | |
| Charts:- Daily , Weekly | |
| Add HUYA to Watchlist: View: Get Complete HUYA Trend Analysis ➞ | |
 | ABEV Ambev S.A. |
| Sector: Consumer Staples | |
| SubSector: Beverages - Brewers | |
| MarketCap: 37753.5 Millions | |
| Recent Price: 2.30 Smart Investing & Trading Score : 42 | |
| Day Percent Change: 0.00% Day Change: 0.00 | |
| Week Change: 0.44% Year-to-date Change: -17.9% | |
| ABEV Links: Profile News Message Board | |
| Charts:- Daily , Weekly | |
| Add ABEV to Watchlist: View: Get Complete ABEV Trend Analysis ➞ | |
 | VIV Telefonica Brasil S.A. |
| Sector: Technology | |
| SubSector: Wireless Communications | |
| MarketCap: 19611.1 Millions | |
| Recent Price: 9.39 Smart Investing & Trading Score : 42 | |
| Day Percent Change: -0.21% Day Change: -0.02 | |
| Week Change: 0.43% Year-to-date Change: -14.2% | |
| VIV Links: Profile News Message Board | |
| Charts:- Daily , Weekly | |
| Add VIV to Watchlist: View: Get Complete VIV Trend Analysis ➞ | |
 | INTR Inter & Co, Inc. |
| Sector: Financials | |
| SubSector: Banks - Regional | |
| MarketCap: 1250 Millions | |
| Recent Price: 5.23 Smart Investing & Trading Score : 58 | |
| Day Percent Change: 0.38% Day Change: 0.02 | |
| Week Change: 0.38% Year-to-date Change: -6.7% | |
| INTR Links: Profile News Message Board | |
| Charts:- Daily , Weekly | |
| Add INTR to Watchlist: View: Get Complete INTR Trend Analysis ➞ | |
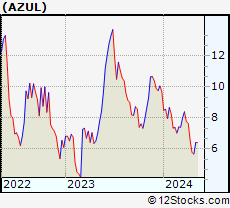 | AZUL Azul S.A. |
| Sector: Transports | |
| SubSector: Major Airlines | |
| MarketCap: 1289.85 Millions | |
| Recent Price: 5.80 Smart Investing & Trading Score : 10 | |
| Day Percent Change: -1.19% Day Change: -0.07 | |
| Week Change: 0.35% Year-to-date Change: -40.1% | |
| AZUL Links: Profile News Message Board | |
| Charts:- Daily , Weekly | |
| Add AZUL to Watchlist: View: Get Complete AZUL Trend Analysis ➞ | |
 | VALE Vale S.A. |
| Sector: Materials | |
| SubSector: Industrial Metals & Minerals | |
| MarketCap: 43601 Millions | |
| Recent Price: 12.21 Smart Investing & Trading Score : 64 | |
| Day Percent Change: 0.08% Day Change: 0.01 | |
| Week Change: 0.25% Year-to-date Change: -23.0% | |
| VALE Links: Profile News Message Board | |
| Charts:- Daily , Weekly | |
| Add VALE to Watchlist: View: Get Complete VALE Trend Analysis ➞ | |
 | LU Lufax Holding Ltd |
| Sector: Financials | |
| SubSector: Credit Services | |
| MarketCap: 33457 Millions | |
| Recent Price: 4.36 Smart Investing & Trading Score : 83 | |
| Day Percent Change: -0.68% Day Change: -0.03 | |
| Week Change: 0.23% Year-to-date Change: 42.0% | |
| LU Links: Profile News Message Board | |
| Charts:- Daily , Weekly | |
| Add LU to Watchlist: View: Get Complete LU Trend Analysis ➞ | |
 | SMI Semiconductor Manufacturing International Corporation |
| Sector: Technology | |
| SubSector: Semiconductor - Integrated Circuits | |
| MarketCap: 6287.56 Millions | |
| Recent Price: 45.73 Smart Investing & Trading Score : 43 | |
| Day Percent Change: 0.01% Day Change: 0.00 | |
| Week Change: 0.01% Year-to-date Change: -1.6% | |
| SMI Links: Profile News Message Board | |
| Charts:- Daily , Weekly | |
| Add SMI to Watchlist: View: Get Complete SMI Trend Analysis ➞ | |
 | AIXI Xiao-I Corporation |
| Sector: Technology | |
| SubSector: Software - Application | |
| MarketCap: 431 Millions | |
| Recent Price: 1.42 Smart Investing & Trading Score : 27 | |
| Day Percent Change: 6.77% Day Change: 0.09 | |
| Week Change: 0% Year-to-date Change: -36.9% | |
| AIXI Links: Profile News Message Board | |
| Charts:- Daily , Weekly | |
| Add AIXI to Watchlist: View: Get Complete AIXI Trend Analysis ➞ | |
 | RERE ATRenew Inc. |
| Sector: Services & Goods | |
| SubSector: Internet Retail | |
| MarketCap: 672 Millions | |
| Recent Price: 1.58 Smart Investing & Trading Score : 46 | |
| Day Percent Change: 1.94% Day Change: 0.03 | |
| Week Change: 0% Year-to-date Change: -16.4% | |
| RERE Links: Profile News Message Board | |
| Charts:- Daily , Weekly | |
| Add RERE to Watchlist: View: Get Complete RERE Trend Analysis ➞ | |
 | FENG Phoenix New Media Limited |
| Sector: Technology | |
| SubSector: Internet Information Providers | |
| MarketCap: 107.08 Millions | |
| Recent Price: 1.82 Smart Investing & Trading Score : 43 | |
| Day Percent Change: -2.15% Day Change: -0.04 | |
| Week Change: 0% Year-to-date Change: 33.8% | |
| FENG Links: Profile News Message Board | |
| Charts:- Daily , Weekly | |
| Add FENG to Watchlist: View: Get Complete FENG Trend Analysis ➞ | |
 | SVA Sinovac Biotech Ltd. |
| Sector: Health Care | |
| SubSector: Biotechnology | |
| MarketCap: 336.88 Millions | |
| Recent Price: 6.47 Smart Investing & Trading Score : 27 | |
| Day Percent Change: 0.00% Day Change: 0.00 | |
| Week Change: 0% Year-to-date Change: 0.0% | |
| SVA Links: Profile News Message Board | |
| Charts:- Daily , Weekly | |
| Add SVA to Watchlist: View: Get Complete SVA Trend Analysis ➞ | |
 | SID Companhia Siderurgica Nacional |
| Sector: Materials | |
| SubSector: Steel & Iron | |
| MarketCap: 2087.58 Millions | |
| Recent Price: 2.82 Smart Investing & Trading Score : 49 | |
| Day Percent Change: -1.74% Day Change: -0.05 | |
| Week Change: 0% Year-to-date Change: -28.2% | |
| SID Links: Profile News Message Board | |
| Charts:- Daily , Weekly | |
| Add SID to Watchlist: View: Get Complete SID Trend Analysis ➞ | |
 | GGB Gerdau S.A. |
| Sector: Materials | |
| SubSector: Steel & Iron | |
| MarketCap: 3607.48 Millions | |
| Recent Price: 3.66 Smart Investing & Trading Score : 32 | |
| Day Percent Change: -3.68% Day Change: -0.14 | |
| Week Change: 0% Year-to-date Change: -24.5% | |
| GGB Links: Profile News Message Board | |
| Charts:- Daily , Weekly | |
| Add GGB to Watchlist: View: Get Complete GGB Trend Analysis ➞ | |
 | CNF CNFinance Holdings Limited |
| Sector: Financials | |
| SubSector: Credit Services | |
| MarketCap: 277.408 Millions | |
| Recent Price: 1.84 Smart Investing & Trading Score : 17 | |
| Day Percent Change: -0.81% Day Change: -0.02 | |
| Week Change: -0.27% Year-to-date Change: -17.3% | |
| CNF Links: Profile News Message Board | |
| Charts:- Daily , Weekly | |
| Add CNF to Watchlist: View: Get Complete CNF Trend Analysis ➞ | |
 | UGP Ultrapar Participacoes S.A. |
| Sector: Energy | |
| SubSector: Oil & Gas Refining & Marketing | |
| MarketCap: 3473.54 Millions | |
| Recent Price: 5.13 Smart Investing & Trading Score : 25 | |
| Day Percent Change: -1.16% Day Change: -0.06 | |
| Week Change: -0.39% Year-to-date Change: -5.4% | |
| UGP Links: Profile News Message Board | |
| Charts:- Daily , Weekly | |
| Add UGP to Watchlist: View: Get Complete UGP Trend Analysis ➞ | |
 | LND BrasilAgro - Companhia Brasileira de Propriedades Agricolas |
| Sector: Financials | |
| SubSector: Property Management | |
| MarketCap: 157.842 Millions | |
| Recent Price: 4.99 Smart Investing & Trading Score : 80 | |
| Day Percent Change: 0.40% Day Change: 0.02 | |
| Week Change: -0.4% Year-to-date Change: -5.5% | |
| LND Links: Profile News Message Board | |
| Charts:- Daily , Weekly | |
| Add LND to Watchlist: View: Get Complete LND Trend Analysis ➞ | |
 | CIG Companhia Energetica de Minas Gerais |
| Sector: Utilities | |
| SubSector: Electric Utilities | |
| MarketCap: 3203.54 Millions | |
| Recent Price: 2.47 Smart Investing & Trading Score : 61 | |
| Day Percent Change: 0.00% Day Change: 0.00 | |
| Week Change: -0.4% Year-to-date Change: 6.5% | |
| CIG Links: Profile News Message Board | |
| Charts:- Daily , Weekly | |
| Add CIG to Watchlist: View: Get Complete CIG Trend Analysis ➞ | |
| For tabular summary view of above stock list: Summary View ➞ 0 - 25 , 25 - 50 , 50 - 75 , 75 - 100 , 100 - 125 , 125 - 150 , 150 - 175 , 175 - 200 | ||
| Click To Change The Sort Order: By Market Cap or Company Size Performance: Year-to-date, Week and Day | |
| Select Chart Type: | ||
|
Best Stocks Today 12Stocks.com |
© 2024 12Stocks.com Terms & Conditions Privacy Contact Us
All Information Provided Only For Education And Not To Be Used For Investing or Trading. See Terms & Conditions


One More Thing ... Get Best Stocks Delivered Daily!
Never Ever Miss A Move With Our Top Ten Stocks Lists
Find Best Stocks In Any Market - Bull or Bear Market
Take A Peek At Our Top Ten Stocks Lists: Daily, Weekly, Year-to-Date & Top Trends
Find Best Stocks In Any Market - Bull or Bear Market
Take A Peek At Our Top Ten Stocks Lists: Daily, Weekly, Year-to-Date & Top Trends
Emerging Markets Stocks With Best Up Trends [0-bearish to 100-bullish]: Grupo Aeroportuario[100], Hutchison China[100], Grupo Aeroportuario[100], iQIYI [100], Controladora Vuela[100], Tencent Music[100], MINISO [100], Full Truck[100], BRF S.A[100], JD.com [100], Baozun [95]
Best Emerging Markets Stocks Year-to-Date:
U Power[2801.79%], DouYu [783.16%], MicroCloud Hologram[642.45%], China Liberal[498.43%], Yatsen Holding[437.18%], Zhongchao [369.73%], Uxin [136.8%], QuantaSing [105.86%], GigaCloud [102.02%], Cheetah Mobile[78.07%], Bright Scholar[64.8%] Best Emerging Markets Stocks This Week:
Cheetah Mobile[14.69%], Grupo Aeroportuario[14.29%], Pinduoduo [12.8%], iQIYI [12.12%], China Online[11.9%], Hutchison China[10.67%], Tuya [10.19%], Baozun [9.91%], Grupo Aeroportuario[9.79%], Hywin [8.88%], Controladora Vuela[8.72%] Best Emerging Markets Stocks Daily:
Golden Heaven[11.75%], Grupo Aeroportuario[11.24%], 17 Education[10.07%], China Online[9.37%], Uxin [9.21%], Ebang [9.17%], Cheetah Mobile[8.85%], Aesthetic Medical[8.02%], Zhongchao [7.86%], Hutchison China[7.73%], Grupo Aeroportuario[7.33%]