
 Login Sign Up


| |||||
 |  | ||||

| 12Stocks.com Market Intelligence |
Best Emerging Markets Stocks
| In a hurry? Emerging Markets Stocks Lists: Trends Table, Stock Charts
Sort Emerging Markets stocks: Daily, Weekly, Year-to-Date, Market Cap & Trends. Filter Emerging Markets stocks list by sector: Show all, Tech, Finance, Energy, Staples, Retail, Industrial, Materials, Utilities and HealthCare Filter Emerging Markets stocks list by size:All Large Medium Small |
| 12Stocks.com Emerging Markets Stocks Performances & Trends Daily | |||||||||
|
|  The overall Smart Investing & Trading Score is 48 (0-bearish to 100-bullish) which puts Emerging Markets index in short term neutral trend. The Smart Investing & Trading Score from previous trading session is 38 and hence an improvement of trend.
| ||||||||
Here are the Smart Investing & Trading Scores of the most requested Emerging Markets stocks at 12Stocks.com (click stock name for detailed review):
|


| 12Stocks.com: Top Performing Emerging Markets Index Stocks | ||||||||||||||||||||||||||||||||||||||||||||||||
 The top performing Emerging Markets Index stocks year to date are
Now, more recently, over last week, the top performing Emerging Markets Index stocks on the move are


|
||||||||||||||||||||||||||||||||||||||||||||||||
| 12Stocks.com: Investing in Emerging Markets Index with Stocks | |
|
The following table helps investors and traders sort through current performance and trends (as measured by Smart Investing & Trading Score ) of various
stocks in the Emerging Markets Index. Quick View: Move mouse or cursor over stock symbol (ticker) to view short-term technical chart and over stock name to view long term chart. Click on  to add stock symbol to your watchlist and to add stock symbol to your watchlist and  to view watchlist. Click on any ticker or stock name for detailed market intelligence report for that stock. to view watchlist. Click on any ticker or stock name for detailed market intelligence report for that stock. |
12Stocks.com Performance of Stocks in Emerging Markets Index
| Ticker | Stock Name | Watchlist | Category | Recent Price | Smart Investing & Trading Score | Change % | YTD Change% |
| IQ | iQIYI |   | Technology | 4.19 | 51 | 0.72% | -14.14% |
| TCOM | Trip.com | | Services & Goods | 48.72 | 61 | 0.95% | 35.30% |
| XP | XP | | Financials | 21.07 | 10 | -2.27% | -19.18% |
| VSTA | Vasta Platform | | Consumer Staples | 3.75 | 0 | 0.00% | -14.77% |
| LXEH | Lixiang Education | | Consumer Staples | 0.40 | 27 | 2.14% | -63.04% |
| IH | iHuman | | Consumer Staples | 1.72 | 25 | -2.00% | -43.77% |
| YSG | Yatsen Holding | | Services & Goods | 3.58 | 88 | -0.83% | 389.34% |
| BGNE | BeiGene | | Health Care | 131.94 | 17 | 0.06% | -26.85% |
| VIPS | Vipshop | | Services & Goods | 15.15 | 0 | -1.17% | -14.70% |
| HTHT | Huazhu | | Services & Goods | 37.38 | 36 | -0.95% | 11.78% |
| GDS | GDS | | Technology | 6.40 | 88 | 2.40% | -29.82% |
| ASX | ASE | | Technology | 10.35 | 31 | -2.27% | 9.99% |
| WB | | Technology | 8.07 | 55 | 3.86% | -26.30% | |
| ATHM | Autohome | | Technology | 24.26 | 10 | -0.04% | -13.54% |
| STNE | StoneCo | | Technology | 15.26 | 10 | 0.07% | -15.36% |
| BILI | Bilibili | | Technology | 11.07 | 46 | 0.36% | -9.04% |
| SUZ | Suzano S.A | | Consumer Staples | 11.59 | 36 | 0.09% | 2.02% |
| MLCO | Melco Resorts | | Services & Goods | 6.23 | 10 | -2.66% | -29.76% |
| YMM | Full Truck | | Technology | 7.62 | 63 | 0.79% | 8.93% |
| CSAN | Cosan S.A | | Energy | 10.90 | 17 | -0.14% | -30.78% |
| BZ | Kanzhun | | Industrials | 18.02 | 51 | -0.50% | 9.08% |
| RDY | Dr. Reddy | | Health Care | 70.91 | 18 | -0.56% | 1.91% |
| PAGS | PagSeguro Digital | | Financials | 11.55 | 10 | -1.03% | -7.38% |
| SMI | Semiconductor | | Technology | 45.69 | 43 | 0.19% | -1.63% |
| UMC | United Microelectronics | | Technology | 7.53 | 0 | -0.79% | -10.99% |
| For chart view version of above stock list: Chart View ➞ 0 - 25 , 25 - 50 , 50 - 75 , 75 - 100 , 100 - 125 , 125 - 150 , 150 - 175 , 175 - 200 | ||
 | Click To Change The Sort Order: By Market Cap or Company Size Performance: Year-to-date, Week and Day |  |
|
Get the most comprehensive stock market coverage daily at 12Stocks.com ➞ Best Stocks Today ➞ Best Stocks Weekly ➞ Best Stocks Year-to-Date ➞ Best Stocks Trends ➞  Best Stocks Today 12Stocks.com Best Nasdaq Stocks ➞ Best S&P 500 Stocks ➞ Best Tech Stocks ➞ Best Biotech Stocks ➞ |
| Detailed Overview of Emerging Markets Stocks |
| Emerging Markets Technical Overview, Leaders & Laggards, Top Emerging Markets ETF Funds & Detailed Emerging Markets Stocks List, Charts, Trends & More |
| Emerging Markets: Technical Analysis, Trends & YTD Performance | |
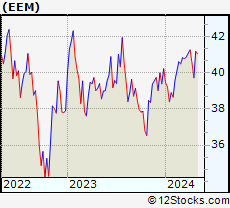
 EEM Weekly Chart |
|
| Long Term Trend: Very Good | |
| Medium Term Trend: Not Good | |
 EEM Daily Chart |
|
| Short Term Trend: Not Good | |
| Overall Trend Score: 48 | |
| YTD Performance: -0.85% | |
| **Trend Scores & Views Are Only For Educational Purposes And Not For Investing | |
| 12Stocks.com: Investing in Emerging Markets Index using Exchange Traded Funds | |
|
The following table shows list of key exchange traded funds (ETF) that
help investors play Emerging Markets stock market. For detailed view, check out our ETF Funds section of our website. Quick View: Move mouse or cursor over ETF symbol (ticker) to view short-term technical chart and over ETF name to view long term chart. Click on ticker or stock name for detailed view. Click on to add stock symbol to your watchlist and to view watchlist. |
12Stocks.com List of ETFs that track Emerging Markets Index
| Ticker | ETF Name | Watchlist | Recent Price | Smart Investing & Trading Score | Change % | Week % | Year-to-date % |
| EEM | Emerging Markets | | 39.87 | 48 | 0.40 | -1.63 | -0.85% |
| VWO | Emerging Markets | | 41.01 | 53 | 0.27 | -1.42 | -0.22% |
| SCHE | Emerging Markets Equity | | 24.78 | 53 | 0.32 | -1.39 | -0.04% |
| EWX | Emerging Markets Small | | 55.61 | 43 | 0.47 | -0.8 | -1.51% |
| EET | Emerging Markets | | 48.03 | 41 | 0.17 | -3.55 | -5.56% |
| EDC | Emrg Mkts Bull | | 27.46 | 48 | 1.25 | -4.92 | -9.76% |
| EEV | Short Emerging | | 20.37 | 62 | -0.92 | 3.19 | 3.28% |
| EUM | Short Emerging | | 14.42 | 62 | -0.55 | 1.65 | 1.91% |
| EDIV | Emerging Markets Dividend | | 32.83 | 43 | 0.37 | -0.33 | 0.95% |
| EMIF | Emerging Markets Infrastructure | | 21.37 | 36 | 0.05 | -1.9 | -0.14% |
| CEW | Emerging Currency Strat | | 17.59 | 31 | 0.04 | -0.55 | -2.32% |
| EBND | Em Mkts Lcl | | 19.86 | 10 | -0.15 | -1.05 | -6.5% |
| EMCB | Emerging Markets Corp | | 64.10 | 23 | 0.20 | 0 | 0.31% |
| VWOB | Emerging Mkts Govt | | 62.16 | 10 | -0.04 | -0.81 | -2.5% |
| EEMA | Emerging Markets Asia | | 66.36 | 48 | 0.69 | -1.46 | 0.37% |
| EELV | Em Mkts Low | | 23.21 | 17 | 0.43 | -1.3 | -3.45% |
| DVYE | Emerging Markets Dividend | | 26.28 | 49 | -0.11 | -0.68 | -0.79% |
| SDEM | SuperDividend Em Mkts | | 25.71 | 48 | 0.51 | 0.03 | 3.68% |
| DBEM | Em Mkts Hdgd | | 23.16 | 41 | 0.39 | -1.53 | 0.39% |
| PCY | Emerging Markets Sov | | 19.76 | 18 | -0.20 | -1.3 | -4.17% |
| QEMM | Emerging Mkts StratcFacts | | 56.18 | 36 | 0.23 | -1.23 | -1.71% |
| 12Stocks.com: Charts, Trends, Fundamental Data and Performances of Emerging Markets Stocks | |
|
We now take in-depth look at all Emerging Markets stocks including charts, multi-period performances and overall trends (as measured by Smart Investing & Trading Score ). One can sort Emerging Markets stocks (click link to choose) by Daily, Weekly and by Year-to-Date performances. Also, one can sort by size of the company or by market capitalization. |
| Select Your Default Chart Type: | |||||
| |||||
| Click on stock symbol or name for detailed view. Click on to add stock symbol to your watchlist and to view watchlist. Quick View: Move mouse or cursor over "Daily" to quickly view daily technical stock chart and over "Weekly" to view weekly technical stock chart. | |||||

 | IQ iQIYI, Inc. |
| Sector: Technology | |
| SubSector: Internet Information Providers | |
| MarketCap: 13591.5 Millions | |
| Recent Price: 4.19 Smart Investing & Trading Score : 51 | |
| Day Percent Change: 0.72% Day Change: 0.03 | |
| Week Change: 1.7% Year-to-date Change: -14.1% | |
| IQ Links: Profile News Message Board | |
| Charts:- Daily , Weekly | |
| Add IQ to Watchlist: View: Get Complete IQ Trend Analysis ➞ | |
 | TCOM Trip.com Group Limited |
| Sector: Services & Goods | |
| SubSector: Lodging | |
| MarketCap: 13449.6 Millions | |
| Recent Price: 48.72 Smart Investing & Trading Score : 61 | |
| Day Percent Change: 0.95% Day Change: 0.46 | |
| Week Change: -0.27% Year-to-date Change: 35.3% | |
| TCOM Links: Profile News Message Board | |
| Charts:- Daily , Weekly | |
| Add TCOM to Watchlist: View: Get Complete TCOM Trend Analysis ➞ | |
 | XP XP Inc. |
| Sector: Financials | |
| SubSector: Asset Management | |
| MarketCap: 12990.3 Millions | |
| Recent Price: 21.07 Smart Investing & Trading Score : 10 | |
| Day Percent Change: -2.27% Day Change: -0.49 | |
| Week Change: -9.8% Year-to-date Change: -19.2% | |
| XP Links: Profile News Message Board | |
| Charts:- Daily , Weekly | |
| Add XP to Watchlist: View: Get Complete XP Trend Analysis ➞ | |
 | VSTA Vasta Platform Limited |
| Sector: Consumer Staples | |
| SubSector: Education & Training Services | |
| MarketCap: 12747 Millions | |
| Recent Price: 3.75 Smart Investing & Trading Score : 0 | |
| Day Percent Change: 0.00% Day Change: 0.00 | |
| Week Change: -1.57% Year-to-date Change: -14.8% | |
| VSTA Links: Profile News Message Board | |
| Charts:- Daily , Weekly | |
| Add VSTA to Watchlist: View: Get Complete VSTA Trend Analysis ➞ | |
 | LXEH Lixiang Education Holding Co., Ltd. |
| Sector: Consumer Staples | |
| SubSector: Education & Training Services | |
| MarketCap: 12347 Millions | |
| Recent Price: 0.40 Smart Investing & Trading Score : 27 | |
| Day Percent Change: 2.14% Day Change: 0.01 | |
| Week Change: -8.45% Year-to-date Change: -63.0% | |
| LXEH Links: Profile News Message Board | |
| Charts:- Daily , Weekly | |
| Add LXEH to Watchlist: View: Get Complete LXEH Trend Analysis ➞ | |
 | IH iHuman Inc. |
| Sector: Consumer Staples | |
| SubSector: Education & Training Services | |
| MarketCap: 12247 Millions | |
| Recent Price: 1.72 Smart Investing & Trading Score : 25 | |
| Day Percent Change: -2.00% Day Change: -0.03 | |
| Week Change: -3.65% Year-to-date Change: -43.8% | |
| IH Links: Profile News Message Board | |
| Charts:- Daily , Weekly | |
| Add IH to Watchlist: View: Get Complete IH Trend Analysis ➞ | |
 | YSG Yatsen Holding Limited |
| Sector: Services & Goods | |
| SubSector: Specialty Retail | |
| MarketCap: 11827 Millions | |
| Recent Price: 3.58 Smart Investing & Trading Score : 88 | |
| Day Percent Change: -0.83% Day Change: -0.03 | |
| Week Change: 18.94% Year-to-date Change: 389.3% | |
| YSG Links: Profile News Message Board | |
| Charts:- Daily , Weekly | |
| Add YSG to Watchlist: View: Get Complete YSG Trend Analysis ➞ | |
 | BGNE BeiGene, Ltd. |
| Sector: Health Care | |
| SubSector: Biotechnology | |
| MarketCap: 10838.5 Millions | |
| Recent Price: 131.94 Smart Investing & Trading Score : 17 | |
| Day Percent Change: 0.06% Day Change: 0.08 | |
| Week Change: -6.62% Year-to-date Change: -26.9% | |
| BGNE Links: Profile News Message Board | |
| Charts:- Daily , Weekly | |
| Add BGNE to Watchlist: View: Get Complete BGNE Trend Analysis ➞ | |
 | VIPS Vipshop Holdings Limited |
| Sector: Services & Goods | |
| SubSector: Catalog & Mail Order Houses | |
| MarketCap: 10496.2 Millions | |
| Recent Price: 15.15 Smart Investing & Trading Score : 0 | |
| Day Percent Change: -1.17% Day Change: -0.18 | |
| Week Change: -6.77% Year-to-date Change: -14.7% | |
| VIPS Links: Profile News Message Board | |
| Charts:- Daily , Weekly | |
| Add VIPS to Watchlist: View: Get Complete VIPS Trend Analysis ➞ | |
 | HTHT Huazhu Group Limited |
| Sector: Services & Goods | |
| SubSector: Lodging | |
| MarketCap: 9164.46 Millions | |
| Recent Price: 37.38 Smart Investing & Trading Score : 36 | |
| Day Percent Change: -0.95% Day Change: -0.36 | |
| Week Change: -0.27% Year-to-date Change: 11.8% | |
| HTHT Links: Profile News Message Board | |
| Charts:- Daily , Weekly | |
| Add HTHT to Watchlist: View: Get Complete HTHT Trend Analysis ➞ | |
 | GDS GDS Holdings Limited |
| Sector: Technology | |
| SubSector: Data Storage Devices | |
| MarketCap: 8597.99 Millions | |
| Recent Price: 6.40 Smart Investing & Trading Score : 88 | |
| Day Percent Change: 2.40% Day Change: 0.15 | |
| Week Change: -5.04% Year-to-date Change: -29.8% | |
| GDS Links: Profile News Message Board | |
| Charts:- Daily , Weekly | |
| Add GDS to Watchlist: View: Get Complete GDS Trend Analysis ➞ | |
 | ASX ASE Technology Holding Co., Ltd. |
| Sector: Technology | |
| SubSector: Semiconductor Equipment & Materials | |
| MarketCap: 8513.18 Millions | |
| Recent Price: 10.35 Smart Investing & Trading Score : 31 | |
| Day Percent Change: -2.27% Day Change: -0.24 | |
| Week Change: -4.61% Year-to-date Change: 10.0% | |
| ASX Links: Profile News Message Board | |
| Charts:- Daily , Weekly | |
| Add ASX to Watchlist: View: Get Complete ASX Trend Analysis ➞ | |
 | WB Weibo Corporation |
| Sector: Technology | |
| SubSector: Internet Information Providers | |
| MarketCap: 8164.6 Millions | |
| Recent Price: 8.07 Smart Investing & Trading Score : 55 | |
| Day Percent Change: 3.86% Day Change: 0.30 | |
| Week Change: 5.77% Year-to-date Change: -26.3% | |
| WB Links: Profile News Message Board | |
| Charts:- Daily , Weekly | |
| Add WB to Watchlist: View: Get Complete WB Trend Analysis ➞ | |
 | ATHM Autohome Inc. |
| Sector: Technology | |
| SubSector: Internet Information Providers | |
| MarketCap: 7984.2 Millions | |
| Recent Price: 24.26 Smart Investing & Trading Score : 10 | |
| Day Percent Change: -0.04% Day Change: -0.01 | |
| Week Change: -3.88% Year-to-date Change: -13.5% | |
| ATHM Links: Profile News Message Board | |
| Charts:- Daily , Weekly | |
| Add ATHM to Watchlist: View: Get Complete ATHM Trend Analysis ➞ | |
 | STNE StoneCo Ltd. |
| Sector: Technology | |
| SubSector: Application Software | |
| MarketCap: 7347.82 Millions | |
| Recent Price: 15.26 Smart Investing & Trading Score : 10 | |
| Day Percent Change: 0.07% Day Change: 0.01 | |
| Week Change: -5.33% Year-to-date Change: -15.4% | |
| STNE Links: Profile News Message Board | |
| Charts:- Daily , Weekly | |
| Add STNE to Watchlist: View: Get Complete STNE Trend Analysis ➞ | |
 | BILI Bilibili Inc. |
| Sector: Technology | |
| SubSector: Internet Information Providers | |
| MarketCap: 7043.1 Millions | |
| Recent Price: 11.07 Smart Investing & Trading Score : 46 | |
| Day Percent Change: 0.36% Day Change: 0.04 | |
| Week Change: -3.57% Year-to-date Change: -9.0% | |
| BILI Links: Profile News Message Board | |
| Charts:- Daily , Weekly | |
| Add BILI to Watchlist: View: Get Complete BILI Trend Analysis ➞ | |
 | SUZ Suzano S.A. |
| Sector: Consumer Staples | |
| SubSector: Paper & Paper Products | |
| MarketCap: 7042.93 Millions | |
| Recent Price: 11.59 Smart Investing & Trading Score : 36 | |
| Day Percent Change: 0.09% Day Change: 0.01 | |
| Week Change: -2.61% Year-to-date Change: 2.0% | |
| SUZ Links: Profile News Message Board | |
| Charts:- Daily , Weekly | |
| Add SUZ to Watchlist: View: Get Complete SUZ Trend Analysis ➞ | |
 | MLCO Melco Resorts & Entertainment Limited |
| Sector: Services & Goods | |
| SubSector: Resorts & Casinos | |
| MarketCap: 7031.14 Millions | |
| Recent Price: 6.23 Smart Investing & Trading Score : 10 | |
| Day Percent Change: -2.66% Day Change: -0.17 | |
| Week Change: -10.36% Year-to-date Change: -29.8% | |
| MLCO Links: Profile News Message Board | |
| Charts:- Daily , Weekly | |
| Add MLCO to Watchlist: View: Get Complete MLCO Trend Analysis ➞ | |
 | YMM Full Truck Alliance Co. Ltd. |
| Sector: Technology | |
| SubSector: Software - Application | |
| MarketCap: 6960 Millions | |
| Recent Price: 7.62 Smart Investing & Trading Score : 63 | |
| Day Percent Change: 0.79% Day Change: 0.06 | |
| Week Change: -1.17% Year-to-date Change: 8.9% | |
| YMM Links: Profile News Message Board | |
| Charts:- Daily , Weekly | |
| Add YMM to Watchlist: View: Get Complete YMM Trend Analysis ➞ | |
 | CSAN Cosan S.A. |
| Sector: Energy | |
| SubSector: Oil & Gas Refining & Marketing | |
| MarketCap: 6890 Millions | |
| Recent Price: 10.90 Smart Investing & Trading Score : 17 | |
| Day Percent Change: -0.14% Day Change: -0.02 | |
| Week Change: -6.39% Year-to-date Change: -30.8% | |
| CSAN Links: Profile News Message Board | |
| Charts:- Daily , Weekly | |
| Add CSAN to Watchlist: View: Get Complete CSAN Trend Analysis ➞ | |
 | BZ Kanzhun Limited |
| Sector: Industrials | |
| SubSector: Staffing & Employment Services | |
| MarketCap: 6680 Millions | |
| Recent Price: 18.02 Smart Investing & Trading Score : 51 | |
| Day Percent Change: -0.50% Day Change: -0.09 | |
| Week Change: -3.82% Year-to-date Change: 9.1% | |
| BZ Links: Profile News Message Board | |
| Charts:- Daily , Weekly | |
| Add BZ to Watchlist: View: Get Complete BZ Trend Analysis ➞ | |
 | RDY Dr. Reddy s Laboratories Limited |
| Sector: Health Care | |
| SubSector: Drug Manufacturers - Other | |
| MarketCap: 6590.23 Millions | |
| Recent Price: 70.91 Smart Investing & Trading Score : 18 | |
| Day Percent Change: -0.56% Day Change: -0.40 | |
| Week Change: -0.71% Year-to-date Change: 1.9% | |
| RDY Links: Profile News Message Board | |
| Charts:- Daily , Weekly | |
| Add RDY to Watchlist: View: Get Complete RDY Trend Analysis ➞ | |
 | PAGS PagSeguro Digital Ltd. |
| Sector: Financials | |
| SubSector: Credit Services | |
| MarketCap: 6500.78 Millions | |
| Recent Price: 11.55 Smart Investing & Trading Score : 10 | |
| Day Percent Change: -1.03% Day Change: -0.12 | |
| Week Change: -8.19% Year-to-date Change: -7.4% | |
| PAGS Links: Profile News Message Board | |
| Charts:- Daily , Weekly | |
| Add PAGS to Watchlist: View: Get Complete PAGS Trend Analysis ➞ | |
 | SMI Semiconductor Manufacturing International Corporation |
| Sector: Technology | |
| SubSector: Semiconductor - Integrated Circuits | |
| MarketCap: 6287.56 Millions | |
| Recent Price: 45.69 Smart Investing & Trading Score : 43 | |
| Day Percent Change: 0.19% Day Change: 0.09 | |
| Week Change: -0.03% Year-to-date Change: -1.6% | |
| SMI Links: Profile News Message Board | |
| Charts:- Daily , Weekly | |
| Add SMI to Watchlist: View: Get Complete SMI Trend Analysis ➞ | |
 | UMC United Microelectronics Corporation |
| Sector: Technology | |
| SubSector: Semiconductor Equipment & Materials | |
| MarketCap: 5672.78 Millions | |
| Recent Price: 7.53 Smart Investing & Trading Score : 0 | |
| Day Percent Change: -0.79% Day Change: -0.06 | |
| Week Change: -5.52% Year-to-date Change: -11.0% | |
| UMC Links: Profile News Message Board | |
| Charts:- Daily , Weekly | |
| Add UMC to Watchlist: View: Get Complete UMC Trend Analysis ➞ | |
| For tabular summary view of above stock list: Summary View ➞ 0 - 25 , 25 - 50 , 50 - 75 , 75 - 100 , 100 - 125 , 125 - 150 , 150 - 175 , 175 - 200 | ||
| Click To Change The Sort Order: By Market Cap or Company Size Performance: Year-to-date, Week and Day | |
| Select Chart Type: | ||
|
Best Stocks Today 12Stocks.com |
© 2024 12Stocks.com Terms & Conditions Privacy Contact Us
All Information Provided Only For Education And Not To Be Used For Investing or Trading. See Terms & Conditions


One More Thing ... Get Best Stocks Delivered Daily!
Never Ever Miss A Move With Our Top Ten Stocks Lists
Find Best Stocks In Any Market - Bull or Bear Market
Take A Peek At Our Top Ten Stocks Lists: Daily, Weekly, Year-to-Date & Top Trends
Find Best Stocks In Any Market - Bull or Bear Market
Take A Peek At Our Top Ten Stocks Lists: Daily, Weekly, Year-to-Date & Top Trends
Emerging Markets Stocks With Best Up Trends [0-bearish to 100-bullish]: GigaCloud [100], Baozun [95], HDFC Bank[93], TAL Education[90], GDS [88], Yatsen Holding[88], U Power[83], Smart Share[83], Lufax Holding[83], MINISO [83], Yiren Digital[78]
Best Emerging Markets Stocks Year-to-Date:
U Power[2874.33%], Zhongchao [825.77%], DouYu [747.37%], MicroCloud Hologram[734.53%], China Liberal[459.28%], Yatsen Holding[389.34%], Uxin [136.8%], QuantaSing [112.65%], GigaCloud [100.82%], Yiren Digital[55.45%], Bright Scholar[50.4%] Best Emerging Markets Stocks This Week:
Zhongchao [106.1%], Regencell Bioscience[60.89%], Yatsen Holding[18.94%], TH [18.18%], Secoo Holding[11.83%], Controladora Vuela[11.35%], Smart Share[9.93%], GigaCloud [8.8%], EHang [8.41%], Momo [7.17%], SunCar [7%] Best Emerging Markets Stocks Daily:
Zhongchao [146.72%], MicroCloud Hologram[30.04%], Regencell Bioscience[29.41%], TH [25.00%], Golden Heaven[21.20%], MingZhu Logistics[9.54%], Secoo Holding[9.32%], Cheetah Mobile[9.06%], Quhuo [8.36%], U Power[8.11%], 17 Education[7.05%]