
 Login Sign Up


| |||||
 |  | ||||

| 12Stocks.com Market Intelligence |
Best Emerging Markets Stocks
| In a hurry? Emerging Markets Stocks Lists: Trends Table, Stock Charts
Sort Emerging Markets stocks: Daily, Weekly, Year-to-Date, Market Cap & Trends. Filter Emerging Markets stocks list by sector: Show all, Tech, Finance, Energy, Staples, Retail, Industrial, Materials, Utilities and HealthCare Filter Emerging Markets stocks list by size:All Large Medium Small |
| 12Stocks.com Emerging Markets Stocks Performances & Trends Daily | |||||||||
|
|  The overall Smart Investing & Trading Score is 49 (0-bearish to 100-bullish) which puts Emerging Markets index in short term neutral trend. The Smart Investing & Trading Score from previous trading session is 48 and hence an improvement of trend.
| ||||||||
Here are the Smart Investing & Trading Scores of the most requested Emerging Markets stocks at 12Stocks.com (click stock name for detailed review):
|


| 12Stocks.com: Top Performing Emerging Markets Index Stocks | ||||||||||||||||||||||||||||||||||||||||||||||||
 The top performing Emerging Markets Index stocks year to date are
Now, more recently, over last week, the top performing Emerging Markets Index stocks on the move are


|
||||||||||||||||||||||||||||||||||||||||||||||||
| 12Stocks.com: Investing in Emerging Markets Index with Stocks | |
|
The following table helps investors and traders sort through current performance and trends (as measured by Smart Investing & Trading Score ) of various
stocks in the Emerging Markets Index. Quick View: Move mouse or cursor over stock symbol (ticker) to view short-term technical chart and over stock name to view long term chart. Click on  to add stock symbol to your watchlist and to add stock symbol to your watchlist and  to view watchlist. Click on any ticker or stock name for detailed market intelligence report for that stock. to view watchlist. Click on any ticker or stock name for detailed market intelligence report for that stock. |
12Stocks.com Performance of Stocks in Emerging Markets Index
| Ticker | Stock Name | Watchlist | Category | Recent Price | Smart Investing & Trading Score | Change % | YTD Change% |
| KOF | Coca-Cola FEMSA |   | Consumer Staples | 93.39 | 25 | 0.16% | -1.32% |
| ATAT | Atour Lifestyle | | Services & Goods | 17.24 | 31 | -2.43% | -1.60% |
| SID | Companhia Siderurgica | | Materials | 2.82 | 42 | 3.68% | -28.24% |
| DAO | Youdao | | Technology | 3.55 | 31 | -0.56% | -9.90% |
| BEST | BEST | | Consumer Staples | 2.08 | 25 | 0.00% | -18.48% |
| VNET | 21Vianet | | Technology | 1.49 | 22 | 1.36% | -48.08% |
| LX | LexinFintech | | Financials | 1.63 | 17 | 1.24% | -11.41% |
| BZUN | Baozun | | Services & Goods | 2.32 | 46 | -2.52% | -15.33% |
| ERJ | Embraer S.A | | Industrials | 23.79 | 41 | -1.78% | 28.94% |
| AFYA | Afya | | Services & Goods | 16.00 | 10 | -0.19% | -27.04% |
| NOAH | Noah | | Financials | 11.62 | 25 | -3.17% | -15.86% |
| FANH | Fanhua | | Financials | 3.50 | 32 | 2.64% | -47.37% |
| MMYT | MakeMyTrip | | Services & Goods | 60.90 | 36 | -0.52% | 29.63% |
| MSC | Studio City | | Services & Goods | 7.49 | 73 | 1.89% | 15.59% |
| SIM | Grupo Simec | | Materials | 31.00 | 37 | 0.00% | -0.55% |
| HMY | Harmony Gold | | Materials | 9.29 | 88 | 1.86% | 51.06% |
| HSAI | Hesai | | Services & Goods | 3.97 | 10 | -9.05% | -56.28% |
| AZUL | Azul S.A | | Transports | 5.78 | 10 | -0.34% | -40.35% |
| INTR | Inter & Co | | Financials | 5.21 | 58 | 2.76% | -7.05% |
| SSL | Sasol | | Energy | 8.20 | 43 | -0.97% | -17.51% |
| HKD | AMTD Digital | | Technology | 3.08 | 10 | 0.33% | -25.42% |
| OMAB | Grupo Aeroportuario | | Transports | 75.10 | 36 | -0.27% | -11.26% |
| GHG | GreenTree Hospitality | | Services & Goods | 2.83 | 10 | 3.43% | -24.63% |
| SIMO | Silicon Motion | | Technology | 71.84 | 36 | -1.99% | 17.25% |
| TUYA | Tuya | | Technology | 1.57 | 0 | -4.27% | -31.59% |
| For chart view version of above stock list: Chart View ➞ 0 - 25 , 25 - 50 , 50 - 75 , 75 - 100 , 100 - 125 , 125 - 150 , 150 - 175 , 175 - 200 | ||
 | Click To Change The Sort Order: By Market Cap or Company Size Performance: Year-to-date, Week and Day |  |
|
Get the most comprehensive stock market coverage daily at 12Stocks.com ➞ Best Stocks Today ➞ Best Stocks Weekly ➞ Best Stocks Year-to-Date ➞ Best Stocks Trends ➞  Best Stocks Today 12Stocks.com Best Nasdaq Stocks ➞ Best S&P 500 Stocks ➞ Best Tech Stocks ➞ Best Biotech Stocks ➞ |
| Detailed Overview of Emerging Markets Stocks |
| Emerging Markets Technical Overview, Leaders & Laggards, Top Emerging Markets ETF Funds & Detailed Emerging Markets Stocks List, Charts, Trends & More |
| Emerging Markets: Technical Analysis, Trends & YTD Performance | |
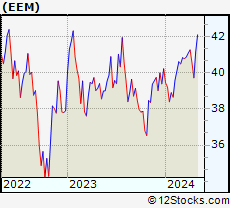
 EEM Weekly Chart |
|
| Long Term Trend: Good | |
| Medium Term Trend: Not Good | |
 EEM Daily Chart |
|
| Short Term Trend: Not Good | |
| Overall Trend Score: 49 | |
| YTD Performance: -1.24% | |
| **Trend Scores & Views Are Only For Educational Purposes And Not For Investing | |
| 12Stocks.com: Investing in Emerging Markets Index using Exchange Traded Funds | |
|
The following table shows list of key exchange traded funds (ETF) that
help investors play Emerging Markets stock market. For detailed view, check out our ETF Funds section of our website. Quick View: Move mouse or cursor over ETF symbol (ticker) to view short-term technical chart and over ETF name to view long term chart. Click on ticker or stock name for detailed view. Click on to add stock symbol to your watchlist and to view watchlist. |
12Stocks.com List of ETFs that track Emerging Markets Index
| Ticker | ETF Name | Watchlist | Recent Price | Smart Investing & Trading Score | Change % | Week % | Year-to-date % |
| EEM | Emerging Markets | | 39.71 | 49 | -0.40 | -2.02 | -1.24% |
| VWO | Emerging Markets | | 40.89 | 49 | -0.29 | -1.71 | -0.51% |
| SCHE | Emerging Markets Equity | | 24.69 | 41 | -0.36 | -1.75 | -0.4% |
| EWX | Emerging Markets Small | | 55.17 | 41 | -0.79 | -1.59 | -2.28% |
| EET | Emerging Markets | | 47.72 | 49 | -0.65 | -4.18 | -6.18% |
| EDC | Emrg Mkts Bull | | 27.07 | 49 | -1.42 | -6.27 | -11.04% |
| EEV | Short Emerging | | 20.52 | 62 | 0.73 | 3.94 | 4.03% |
| EUM | Short Emerging | | 14.49 | 62 | 0.50 | 2.16 | 2.42% |
| EDIV | Emerging Markets Dividend | | 33.01 | 51 | 0.33 | 0.21 | 1.51% |
| EMIF | Emerging Markets Infrastructure | | 21.38 | 51 | 0.14 | -1.85 | -0.09% |
| CEW | Emerging Currency Strat | | 17.61 | 38 | 0.10 | -0.45 | -2.22% |
| EBND | Em Mkts Lcl | | 19.93 | 32 | 0.35 | -0.7 | -6.17% |
| EMCB | Emerging Markets Corp | | 63.59 | 0 | -0.41 | -0.79 | -0.49% |
| VWOB | Emerging Mkts Govt | | 62.33 | 32 | 0.27 | -0.53 | -2.23% |
| EEMA | Emerging Markets Asia | | 66.09 | 49 | -0.40 | -1.85 | -0.03% |
| EELV | Em Mkts Low | | 23.16 | 18 | -0.22 | -1.51 | -3.66% |
| DVYE | Emerging Markets Dividend | | 26.48 | 88 | 0.76 | 0.08 | -0.04% |
| SDEM | SuperDividend Em Mkts | | 25.86 | 83 | 0.58 | 0.61 | 4.29% |
| DBEM | Em Mkts Hdgd | | 23.10 | 49 | -0.52 | -1.79 | 0.13% |
| PCY | Emerging Markets Sov | | 19.81 | 32 | 0.25 | -1.05 | -3.93% |
| QEMM | Emerging Mkts StratcFacts | | 56.16 | 44 | -0.04 | -1.27 | -1.74% |
| 12Stocks.com: Charts, Trends, Fundamental Data and Performances of Emerging Markets Stocks | |
|
We now take in-depth look at all Emerging Markets stocks including charts, multi-period performances and overall trends (as measured by Smart Investing & Trading Score ). One can sort Emerging Markets stocks (click link to choose) by Daily, Weekly and by Year-to-Date performances. Also, one can sort by size of the company or by market capitalization. |
| Select Your Default Chart Type: | |||||
| |||||
| Click on stock symbol or name for detailed view. Click on to add stock symbol to your watchlist and to view watchlist. Quick View: Move mouse or cursor over "Daily" to quickly view daily technical stock chart and over "Weekly" to view weekly technical stock chart. | |||||

 | KOF Coca-Cola FEMSA, S.A.B. de C.V. |
| Sector: Consumer Staples | |
| SubSector: Beverages - Soft Drinks | |
| MarketCap: 2258.9 Millions | |
| Recent Price: 93.39 Smart Investing & Trading Score : 25 | |
| Day Percent Change: 0.16% Day Change: 0.15 | |
| Week Change: -3.84% Year-to-date Change: -1.3% | |
| KOF Links: Profile News Message Board | |
| Charts:- Daily , Weekly | |
| Add KOF to Watchlist: View: Get Complete KOF Trend Analysis ➞ | |
 | ATAT Atour Lifestyle Holdings Limited |
| Sector: Services & Goods | |
| SubSector: Lodging | |
| MarketCap: 2120 Millions | |
| Recent Price: 17.24 Smart Investing & Trading Score : 31 | |
| Day Percent Change: -2.43% Day Change: -0.43 | |
| Week Change: -2.87% Year-to-date Change: -1.6% | |
| ATAT Links: Profile News Message Board | |
| Charts:- Daily , Weekly | |
| Add ATAT to Watchlist: View: Get Complete ATAT Trend Analysis ➞ | |
 | SID Companhia Siderurgica Nacional |
| Sector: Materials | |
| SubSector: Steel & Iron | |
| MarketCap: 2087.58 Millions | |
| Recent Price: 2.82 Smart Investing & Trading Score : 42 | |
| Day Percent Change: 3.68% Day Change: 0.10 | |
| Week Change: 0.36% Year-to-date Change: -28.2% | |
| SID Links: Profile News Message Board | |
| Charts:- Daily , Weekly | |
| Add SID to Watchlist: View: Get Complete SID Trend Analysis ➞ | |
 | DAO Youdao, Inc. |
| Sector: Technology | |
| SubSector: Internet Information Providers | |
| MarketCap: 2073.2 Millions | |
| Recent Price: 3.55 Smart Investing & Trading Score : 31 | |
| Day Percent Change: -0.56% Day Change: -0.02 | |
| Week Change: -11.03% Year-to-date Change: -9.9% | |
| DAO Links: Profile News Message Board | |
| Charts:- Daily , Weekly | |
| Add DAO to Watchlist: View: Get Complete DAO Trend Analysis ➞ | |
 | BEST BEST Inc. |
| Sector: Consumer Staples | |
| SubSector: Packaging & Containers | |
| MarketCap: 1981.73 Millions | |
| Recent Price: 2.08 Smart Investing & Trading Score : 25 | |
| Day Percent Change: 0.00% Day Change: 0.00 | |
| Week Change: -0.95% Year-to-date Change: -18.5% | |
| BEST Links: Profile News Message Board | |
| Charts:- Daily , Weekly | |
| Add BEST to Watchlist: View: Get Complete BEST Trend Analysis ➞ | |
 | VNET 21Vianet Group, Inc. |
| Sector: Technology | |
| SubSector: Information Technology Services | |
| MarketCap: 1846.98 Millions | |
| Recent Price: 1.49 Smart Investing & Trading Score : 22 | |
| Day Percent Change: 1.36% Day Change: 0.02 | |
| Week Change: -7.45% Year-to-date Change: -48.1% | |
| VNET Links: Profile News Message Board | |
| Charts:- Daily , Weekly | |
| Add VNET to Watchlist: View: Get Complete VNET Trend Analysis ➞ | |
 | LX LexinFintech Holdings Ltd. |
| Sector: Financials | |
| SubSector: Credit Services | |
| MarketCap: 1674.18 Millions | |
| Recent Price: 1.63 Smart Investing & Trading Score : 17 | |
| Day Percent Change: 1.24% Day Change: 0.02 | |
| Week Change: -7.39% Year-to-date Change: -11.4% | |
| LX Links: Profile News Message Board | |
| Charts:- Daily , Weekly | |
| Add LX to Watchlist: View: Get Complete LX Trend Analysis ➞ | |
 | BZUN Baozun Inc. |
| Sector: Services & Goods | |
| SubSector: Catalog & Mail Order Houses | |
| MarketCap: 1668.92 Millions | |
| Recent Price: 2.32 Smart Investing & Trading Score : 46 | |
| Day Percent Change: -2.52% Day Change: -0.06 | |
| Week Change: -2.11% Year-to-date Change: -15.3% | |
| BZUN Links: Profile News Message Board | |
| Charts:- Daily , Weekly | |
| Add BZUN to Watchlist: View: Get Complete BZUN Trend Analysis ➞ | |
 | ERJ Embraer S.A. |
| Sector: Industrials | |
| SubSector: Aerospace/Defense Products & Services | |
| MarketCap: 1623.71 Millions | |
| Recent Price: 23.79 Smart Investing & Trading Score : 41 | |
| Day Percent Change: -1.78% Day Change: -0.43 | |
| Week Change: -4.27% Year-to-date Change: 28.9% | |
| ERJ Links: Profile News Message Board | |
| Charts:- Daily , Weekly | |
| Add ERJ to Watchlist: View: Get Complete ERJ Trend Analysis ➞ | |
 | AFYA Afya Limited |
| Sector: Services & Goods | |
| SubSector: Education & Training Services | |
| MarketCap: 1559.26 Millions | |
| Recent Price: 16.00 Smart Investing & Trading Score : 10 | |
| Day Percent Change: -0.19% Day Change: -0.03 | |
| Week Change: -5.66% Year-to-date Change: -27.0% | |
| AFYA Links: Profile News Message Board | |
| Charts:- Daily , Weekly | |
| Add AFYA to Watchlist: View: Get Complete AFYA Trend Analysis ➞ | |
 | NOAH Noah Holdings Limited |
| Sector: Financials | |
| SubSector: Asset Management | |
| MarketCap: 1495.33 Millions | |
| Recent Price: 11.62 Smart Investing & Trading Score : 25 | |
| Day Percent Change: -3.17% Day Change: -0.38 | |
| Week Change: -9.71% Year-to-date Change: -15.9% | |
| NOAH Links: Profile News Message Board | |
| Charts:- Daily , Weekly | |
| Add NOAH to Watchlist: View: Get Complete NOAH Trend Analysis ➞ | |
 | FANH Fanhua Inc. |
| Sector: Financials | |
| SubSector: Insurance Brokers | |
| MarketCap: 1436.67 Millions | |
| Recent Price: 3.50 Smart Investing & Trading Score : 32 | |
| Day Percent Change: 2.64% Day Change: 0.09 | |
| Week Change: -15.87% Year-to-date Change: -47.4% | |
| FANH Links: Profile News Message Board | |
| Charts:- Daily , Weekly | |
| Add FANH to Watchlist: View: Get Complete FANH Trend Analysis ➞ | |
 | MMYT MakeMyTrip Limited |
| Sector: Services & Goods | |
| SubSector: General Entertainment | |
| MarketCap: 1429.59 Millions | |
| Recent Price: 60.90 Smart Investing & Trading Score : 36 | |
| Day Percent Change: -0.52% Day Change: -0.32 | |
| Week Change: -11.25% Year-to-date Change: 29.6% | |
| MMYT Links: Profile News Message Board | |
| Charts:- Daily , Weekly | |
| Add MMYT to Watchlist: View: Get Complete MMYT Trend Analysis ➞ | |
 | MSC Studio City International Holdings Limited |
| Sector: Services & Goods | |
| SubSector: Resorts & Casinos | |
| MarketCap: 1420.54 Millions | |
| Recent Price: 7.49 Smart Investing & Trading Score : 73 | |
| Day Percent Change: 1.89% Day Change: 0.14 | |
| Week Change: -11.88% Year-to-date Change: 15.6% | |
| MSC Links: Profile News Message Board | |
| Charts:- Daily , Weekly | |
| Add MSC to Watchlist: View: Get Complete MSC Trend Analysis ➞ | |
 | SIM Grupo Simec, S.A.B. de C.V. |
| Sector: Materials | |
| SubSector: Steel & Iron | |
| MarketCap: 1418.28 Millions | |
| Recent Price: 31.00 Smart Investing & Trading Score : 37 | |
| Day Percent Change: 0.00% Day Change: 0.00 | |
| Week Change: -6.06% Year-to-date Change: -0.6% | |
| SIM Links: Profile News Message Board | |
| Charts:- Daily , Weekly | |
| Add SIM to Watchlist: View: Get Complete SIM Trend Analysis ➞ | |
 | HMY Harmony Gold Mining Company Limited |
| Sector: Materials | |
| SubSector: Gold | |
| MarketCap: 1371.69 Millions | |
| Recent Price: 9.29 Smart Investing & Trading Score : 88 | |
| Day Percent Change: 1.86% Day Change: 0.17 | |
| Week Change: 1.98% Year-to-date Change: 51.1% | |
| HMY Links: Profile News Message Board | |
| Charts:- Daily , Weekly | |
| Add HMY to Watchlist: View: Get Complete HMY Trend Analysis ➞ | |
 | HSAI Hesai Group |
| Sector: Services & Goods | |
| SubSector: Auto Parts | |
| MarketCap: 1330 Millions | |
| Recent Price: 3.97 Smart Investing & Trading Score : 10 | |
| Day Percent Change: -9.05% Day Change: -0.40 | |
| Week Change: -12.17% Year-to-date Change: -56.3% | |
| HSAI Links: Profile News Message Board | |
| Charts:- Daily , Weekly | |
| Add HSAI to Watchlist: View: Get Complete HSAI Trend Analysis ➞ | |
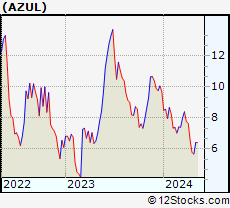 | AZUL Azul S.A. |
| Sector: Transports | |
| SubSector: Major Airlines | |
| MarketCap: 1289.85 Millions | |
| Recent Price: 5.78 Smart Investing & Trading Score : 10 | |
| Day Percent Change: -0.34% Day Change: -0.02 | |
| Week Change: -12.02% Year-to-date Change: -40.4% | |
| AZUL Links: Profile News Message Board | |
| Charts:- Daily , Weekly | |
| Add AZUL to Watchlist: View: Get Complete AZUL Trend Analysis ➞ | |
 | INTR Inter & Co, Inc. |
| Sector: Financials | |
| SubSector: Banks - Regional | |
| MarketCap: 1250 Millions | |
| Recent Price: 5.21 Smart Investing & Trading Score : 58 | |
| Day Percent Change: 2.76% Day Change: 0.14 | |
| Week Change: -3.16% Year-to-date Change: -7.1% | |
| INTR Links: Profile News Message Board | |
| Charts:- Daily , Weekly | |
| Add INTR to Watchlist: View: Get Complete INTR Trend Analysis ➞ | |
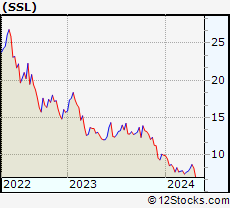 | SSL Sasol Limited |
| Sector: Energy | |
| SubSector: Major Integrated Oil & Gas | |
| MarketCap: 1233.85 Millions | |
| Recent Price: 8.20 Smart Investing & Trading Score : 43 | |
| Day Percent Change: -0.97% Day Change: -0.08 | |
| Week Change: -5.64% Year-to-date Change: -17.5% | |
| SSL Links: Profile News Message Board | |
| Charts:- Daily , Weekly | |
| Add SSL to Watchlist: View: Get Complete SSL Trend Analysis ➞ | |
 | HKD AMTD Digital Inc. |
| Sector: Technology | |
| SubSector: Software - Application | |
| MarketCap: 1200 Millions | |
| Recent Price: 3.08 Smart Investing & Trading Score : 10 | |
| Day Percent Change: 0.33% Day Change: 0.01 | |
| Week Change: -8.33% Year-to-date Change: -25.4% | |
| HKD Links: Profile News Message Board | |
| Charts:- Daily , Weekly | |
| Add HKD to Watchlist: View: Get Complete HKD Trend Analysis ➞ | |
 | OMAB Grupo Aeroportuario del Centro Norte, S.A.B. de C.V. |
| Sector: Transports | |
| SubSector: Air Services, Other | |
| MarketCap: 1196.38 Millions | |
| Recent Price: 75.10 Smart Investing & Trading Score : 36 | |
| Day Percent Change: -0.27% Day Change: -0.20 | |
| Week Change: -5.61% Year-to-date Change: -11.3% | |
| OMAB Links: Profile News Message Board | |
| Charts:- Daily , Weekly | |
| Add OMAB to Watchlist: View: Get Complete OMAB Trend Analysis ➞ | |
 | GHG GreenTree Hospitality Group Ltd. |
| Sector: Services & Goods | |
| SubSector: Lodging | |
| MarketCap: 1195.36 Millions | |
| Recent Price: 2.83 Smart Investing & Trading Score : 10 | |
| Day Percent Change: 3.43% Day Change: 0.09 | |
| Week Change: -7.39% Year-to-date Change: -24.6% | |
| GHG Links: Profile News Message Board | |
| Charts:- Daily , Weekly | |
| Add GHG to Watchlist: View: Get Complete GHG Trend Analysis ➞ | |
 | SIMO Silicon Motion Technology Corporation |
| Sector: Technology | |
| SubSector: Diversified Electronics | |
| MarketCap: 1186.66 Millions | |
| Recent Price: 71.84 Smart Investing & Trading Score : 36 | |
| Day Percent Change: -1.99% Day Change: -1.46 | |
| Week Change: -4.57% Year-to-date Change: 17.3% | |
| SIMO Links: Profile News Message Board | |
| Charts:- Daily , Weekly | |
| Add SIMO to Watchlist: View: Get Complete SIMO Trend Analysis ➞ | |
 | TUYA Tuya Inc. |
| Sector: Technology | |
| SubSector: Software - Infrastructure | |
| MarketCap: 1050 Millions | |
| Recent Price: 1.57 Smart Investing & Trading Score : 0 | |
| Day Percent Change: -4.27% Day Change: -0.07 | |
| Week Change: -8.19% Year-to-date Change: -31.6% | |
| TUYA Links: Profile News Message Board | |
| Charts:- Daily , Weekly | |
| Add TUYA to Watchlist: View: Get Complete TUYA Trend Analysis ➞ | |
| For tabular summary view of above stock list: Summary View ➞ 0 - 25 , 25 - 50 , 50 - 75 , 75 - 100 , 100 - 125 , 125 - 150 , 150 - 175 , 175 - 200 | ||
| Click To Change The Sort Order: By Market Cap or Company Size Performance: Year-to-date, Week and Day | |
| Select Chart Type: | ||
|
Best Stocks Today 12Stocks.com |
© 2024 12Stocks.com Terms & Conditions Privacy Contact Us
All Information Provided Only For Education And Not To Be Used For Investing or Trading. See Terms & Conditions


One More Thing ... Get Best Stocks Delivered Daily!
Never Ever Miss A Move With Our Top Ten Stocks Lists
Find Best Stocks In Any Market - Bull or Bear Market
Take A Peek At Our Top Ten Stocks Lists: Daily, Weekly, Year-to-Date & Top Trends
Find Best Stocks In Any Market - Bull or Bear Market
Take A Peek At Our Top Ten Stocks Lists: Daily, Weekly, Year-to-Date & Top Trends
Emerging Markets Stocks With Best Up Trends [0-bearish to 100-bullish]: HDFC Bank[93], Full Truck[93], DouYu [90], Harmony Gold[88], GDS [88], Bright Scholar[85], Gold Fields[85], MOGU [83], Lufax Holding[83], So-Young [83], DRDGOLD [81]
Best Emerging Markets Stocks Year-to-Date:
U Power[2768.3%], DouYu [747.37%], MicroCloud Hologram[702.88%], China Liberal[476.51%], Zhongchao [412.19%], Yatsen Holding[394.12%], Uxin [141.08%], QuantaSing [106.79%], GigaCloud [89.46%], Bright Scholar[60.8%], Cheetah Mobile[55.26%] Best Emerging Markets Stocks This Week:
Regencell Bioscience[45.67%], Yatsen Holding[20.1%], MingZhu Logistics[17.48%], Secoo Holding[17.14%], Zhongchao [14.02%], TH [11.82%], Controladora Vuela[10.64%], Bright Scholar[9.24%], Quhuo [8.87%], Smart Share[7.58%], DouYu [6.62%] Best Emerging Markets Stocks Daily:
Lanvin [11.19%], MingZhu Logistics[10.31%], Bright Scholar[6.91%], Regencell Bioscience[6.32%], Ambipar Emergency[6.09%], MOGU [5.85%], Petroleo Brasileiro[5.71%], Cheetah Mobile[5.04%], Secoo Holding[4.75%], BrasilAgro -[4.38%], Companhia Siderurgica[3.68%]