
 Login Sign Up


| |||||
 |  | ||||

| 12Stocks.com Market Intelligence |
Best Emerging Markets Stocks
| In a hurry? Emerging Markets Stocks Lists: Trends Table, Stock Charts
Sort Emerging Markets stocks: Daily, Weekly, Year-to-Date, Market Cap & Trends. Filter Emerging Markets stocks list by sector: Show all, Tech, Finance, Energy, Staples, Retail, Industrial, Materials, Utilities and HealthCare Filter Emerging Markets stocks list by size:All Large Medium Small |
| 12Stocks.com Emerging Markets Stocks Performances & Trends Daily | |||||||||
|
|  The overall Smart Investing & Trading Score is 68 (0-bearish to 100-bullish) which puts Emerging Markets index in short term neutral to bullish trend. The Smart Investing & Trading Score from previous trading session is 63 and an improvement of trend continues.
| ||||||||
Here are the Smart Investing & Trading Scores of the most requested Emerging Markets stocks at 12Stocks.com (click stock name for detailed review):
|


| 12Stocks.com: Top Performing Emerging Markets Index Stocks | ||||||||||||||||||||||||||||||||||||||||||||||||
 The top performing Emerging Markets Index stocks year to date are
Now, more recently, over last week, the top performing Emerging Markets Index stocks on the move are


|
||||||||||||||||||||||||||||||||||||||||||||||||
| 12Stocks.com: Investing in Emerging Markets Index with Stocks | |
|
The following table helps investors and traders sort through current performance and trends (as measured by Smart Investing & Trading Score ) of various
stocks in the Emerging Markets Index. Quick View: Move mouse or cursor over stock symbol (ticker) to view short-term technical chart and over stock name to view long term chart. Click on  to add stock symbol to your watchlist and to add stock symbol to your watchlist and  to view watchlist. Click on any ticker or stock name for detailed market intelligence report for that stock. to view watchlist. Click on any ticker or stock name for detailed market intelligence report for that stock. |
12Stocks.com Performance of Stocks in Emerging Markets Index
| Ticker | Stock Name | Watchlist | Category | Recent Price | Smart Investing & Trading Score | Change % | Weekly Change% |
| ATAT | Atour Lifestyle |   | Services & Goods | 18.25 | 83 | 2.79% | 5.89% |
| VTRU | Vitru | | Consumer Staples | 13.04 | 35 | -2.25% | 5.76% |
| GGR | Gogoro | | Services & Goods | 1.49 | 45 | -0.67% | 5.67% |
| ZTO | ZTO Express | | Transports | 21.07 | 100 | 4.10% | 5.67% |
| GHG | GreenTree Hospitality | | Services & Goods | 2.99 | 10 | 0.67% | 5.50% |
| TCOM | Trip.com | | Services & Goods | 50.60 | 80 | 0.24% | 5.42% |
| RLX | RLX | | Consumer Staples | 1.88 | 90 | 2.46% | 5.34% |
| YRD | Yiren Digital | | Financials | 5.08 | 73 | 1.20% | 5.18% |
| TUYA | Tuya | | Technology | 1.65 | 42 | -4.62% | 5.10% |
| XNET | Xunlei | | Technology | 1.55 | 90 | -0.32% | 5.07% |
| XIN | Xinyuan Real | | Financials | 2.73 | 49 | 0.74% | 5.00% |
| NOAH | Noah | | Financials | 12.19 | 78 | 0.41% | 4.91% |
| DDL | Dingdong (Cayman) | | Consumer Staples | 1.21 | 54 | -1.23% | 4.78% |
| UCL | uCloudlink | | Technology | 1.44 | 30 | 0.00% | 4.73% |
| SY | So-Young | | Technology | 1.22 | 68 | -3.17% | 4.72% |
| TV | Grupo Televisa | | Services & Goods | 2.94 | 42 | -2.00% | 4.63% |
| LU | Lufax Holding | | Financials | 4.55 | 90 | 4.36% | 4.60% |
| YUMC | Yum China | | Services & Goods | 38.80 | 85 | 1.15% | 4.58% |
| HUYA | HUYA | | Services & Goods | 4.61 | 48 | 4.06% | 4.54% |
| BIDU | Baidu | | Technology | 99.19 | 59 | 0.98% | 4.36% |
| LX | LexinFintech | | Financials | 1.70 | 10 | 0.59% | 4.29% |
| VIPS | Vipshop | | Services & Goods | 15.81 | 45 | 0.13% | 4.29% |
| WIT | Wipro | | Technology | 5.47 | 42 | -0.73% | 4.19% |
| TSM | Taiwan Semiconductor | | Technology | 132.97 | 68 | -0.34% | 4.13% |
| QFIN | 360 Finance | | Financials | 18.73 | 46 | 1.19% | 4.06% |
| For chart view version of above stock list: Chart View ➞ 0 - 25 , 25 - 50 , 50 - 75 , 75 - 100 , 100 - 125 , 125 - 150 , 150 - 175 , 175 - 200 | ||
 | Click To Change The Sort Order: By Market Cap or Company Size Performance: Year-to-date, Week and Day |  |
|
Get the most comprehensive stock market coverage daily at 12Stocks.com ➞ Best Stocks Today ➞ Best Stocks Weekly ➞ Best Stocks Year-to-Date ➞ Best Stocks Trends ➞  Best Stocks Today 12Stocks.com Best Nasdaq Stocks ➞ Best S&P 500 Stocks ➞ Best Tech Stocks ➞ Best Biotech Stocks ➞ |
| Detailed Overview of Emerging Markets Stocks |
| Emerging Markets Technical Overview, Leaders & Laggards, Top Emerging Markets ETF Funds & Detailed Emerging Markets Stocks List, Charts, Trends & More |
| Emerging Markets: Technical Analysis, Trends & YTD Performance | |
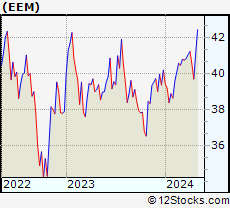
 EEM Weekly Chart |
|
| Long Term Trend: Very Good | |
| Medium Term Trend: Not Good | |
 EEM Daily Chart |
|
| Short Term Trend: Very Good | |
| Overall Trend Score: 68 | |
| YTD Performance: 0.99% | |
| **Trend Scores & Views Are Only For Educational Purposes And Not For Investing | |
| 12Stocks.com: Investing in Emerging Markets Index using Exchange Traded Funds | |
|
The following table shows list of key exchange traded funds (ETF) that
help investors play Emerging Markets stock market. For detailed view, check out our ETF Funds section of our website. Quick View: Move mouse or cursor over ETF symbol (ticker) to view short-term technical chart and over ETF name to view long term chart. Click on ticker or stock name for detailed view. Click on to add stock symbol to your watchlist and to view watchlist. |
12Stocks.com List of ETFs that track Emerging Markets Index
| Ticker | ETF Name | Watchlist | Recent Price | Smart Investing & Trading Score | Change % | Week % | Year-to-date % |
| EEM | Emerging Markets | | 40.61 | 68 | 0.35 | 2.27 | 0.99% |
| VWO | Emerging Markets | | 41.71 | 68 | 0.31 | 2.01 | 1.48% |
| SCHE | Emerging Markets Equity | | 25.20 | 68 | 0.40 | 2.07 | 1.65% |
| EWX | Emerging Markets Small | | 55.80 | 43 | 0.23 | 1.14 | -1.17% |
| EET | Emerging Markets | | 49.90 | 68 | 1.18 | 4.58 | -1.89% |
| EDC | Emrg Mkts Bull | | 28.91 | 63 | 0.84 | 6.8 | -5% |
| EEV | Short Emerging | | 19.69 | 32 | -0.35 | -4.03 | -0.17% |
| EUM | Short Emerging | | 14.16 | 32 | -0.44 | -2.29 | 0.07% |
| EDIV | Emerging Markets Dividend | | 33.15 | 50 | 0.42 | 0.42 | 1.94% |
| EMIF | Emerging Markets Infrastructure | | 21.87 | 60 | 1.16 | 2.29 | 2.2% |
| CEW | Emerging Currency Strat | | 17.66 | 20 | 0.26 | 0.31 | -1.92% |
| EBND | Em Mkts Lcl | | 19.92 | 20 | -0.50 | -0.05 | -6.21% |
| EMCB | Emerging Markets Corp | | 63.38 | 23 | -1.15 | -0.33 | -0.81% |
| VWOB | Emerging Mkts Govt | | 62.35 | 30 | -0.59 | 0.03 | -2.2% |
| EEMA | Emerging Markets Asia | | 67.83 | 68 | 0.51 | 2.63 | 2.6% |
| EELV | Em Mkts Low | | 23.29 | 31 | -0.74 | 0.56 | -3.12% |
| DVYE | Emerging Markets Dividend | | 26.53 | 70 | -0.11 | 0.19 | 0.15% |
| SDEM | SuperDividend Em Mkts | | 25.28 | 36 | -0.08 | -2.24 | 1.95% |
| DBEM | Em Mkts Hdgd | | 23.71 | 60 | 0.71 | 2.63 | 2.76% |
| PCY | Emerging Markets Sov | | 19.70 | 25 | -0.91 | -0.56 | -4.46% |
| QEMM | Emerging Mkts StratcFacts | | 56.76 | 41 | -0.31 | 1.06 | -0.7% |
| 12Stocks.com: Charts, Trends, Fundamental Data and Performances of Emerging Markets Stocks | |
|
We now take in-depth look at all Emerging Markets stocks including charts, multi-period performances and overall trends (as measured by Smart Investing & Trading Score ). One can sort Emerging Markets stocks (click link to choose) by Daily, Weekly and by Year-to-Date performances. Also, one can sort by size of the company or by market capitalization. |
| Select Your Default Chart Type: | |||||
| |||||
| Click on stock symbol or name for detailed view. Click on to add stock symbol to your watchlist and to view watchlist. Quick View: Move mouse or cursor over "Daily" to quickly view daily technical stock chart and over "Weekly" to view weekly technical stock chart. | |||||

 | ATAT Atour Lifestyle Holdings Limited |
| Sector: Services & Goods | |
| SubSector: Lodging | |
| MarketCap: 2120 Millions | |
| Recent Price: 18.25 Smart Investing & Trading Score : 83 | |
| Day Percent Change: 2.79% Day Change: 0.49 | |
| Week Change: 5.89% Year-to-date Change: 4.2% | |
| ATAT Links: Profile News Message Board | |
| Charts:- Daily , Weekly | |
| Add ATAT to Watchlist: View: Get Complete ATAT Trend Analysis ➞ | |
 | VTRU Vitru Limited |
| Sector: Consumer Staples | |
| SubSector: Education & Training Services | |
| MarketCap: 33347 Millions | |
| Recent Price: 13.04 Smart Investing & Trading Score : 35 | |
| Day Percent Change: -2.25% Day Change: -0.30 | |
| Week Change: 5.76% Year-to-date Change: -17.6% | |
| VTRU Links: Profile News Message Board | |
| Charts:- Daily , Weekly | |
| Add VTRU to Watchlist: View: Get Complete VTRU Trend Analysis ➞ | |
 | GGR Gogoro Inc. |
| Sector: Services & Goods | |
| SubSector: Auto Parts | |
| MarketCap: 856 Millions | |
| Recent Price: 1.49 Smart Investing & Trading Score : 45 | |
| Day Percent Change: -0.67% Day Change: -0.01 | |
| Week Change: 5.67% Year-to-date Change: -42.7% | |
| GGR Links: Profile News Message Board | |
| Charts:- Daily , Weekly | |
| Add GGR to Watchlist: View: Get Complete GGR Trend Analysis ➞ | |
 | ZTO ZTO Express (Cayman) Inc. |
| Sector: Transports | |
| SubSector: Air Delivery & Freight Services | |
| MarketCap: 20507 Millions | |
| Recent Price: 21.07 Smart Investing & Trading Score : 100 | |
| Day Percent Change: 4.10% Day Change: 0.83 | |
| Week Change: 5.67% Year-to-date Change: -1.0% | |
| ZTO Links: Profile News Message Board | |
| Charts:- Daily , Weekly | |
| Add ZTO to Watchlist: View: Get Complete ZTO Trend Analysis ➞ | |
 | GHG GreenTree Hospitality Group Ltd. |
| Sector: Services & Goods | |
| SubSector: Lodging | |
| MarketCap: 1195.36 Millions | |
| Recent Price: 2.99 Smart Investing & Trading Score : 10 | |
| Day Percent Change: 0.67% Day Change: 0.02 | |
| Week Change: 5.5% Year-to-date Change: -20.5% | |
| GHG Links: Profile News Message Board | |
| Charts:- Daily , Weekly | |
| Add GHG to Watchlist: View: Get Complete GHG Trend Analysis ➞ | |
 | TCOM Trip.com Group Limited |
| Sector: Services & Goods | |
| SubSector: Lodging | |
| MarketCap: 13449.6 Millions | |
| Recent Price: 50.60 Smart Investing & Trading Score : 80 | |
| Day Percent Change: 0.24% Day Change: 0.12 | |
| Week Change: 5.42% Year-to-date Change: 40.5% | |
| TCOM Links: Profile News Message Board | |
| Charts:- Daily , Weekly | |
| Add TCOM to Watchlist: View: Get Complete TCOM Trend Analysis ➞ | |
 | RLX RLX Technology Inc. |
| Sector: Consumer Staples | |
| SubSector: Tobacco | |
| MarketCap: 2800 Millions | |
| Recent Price: 1.88 Smart Investing & Trading Score : 90 | |
| Day Percent Change: 2.46% Day Change: 0.04 | |
| Week Change: 5.34% Year-to-date Change: -5.3% | |
| RLX Links: Profile News Message Board | |
| Charts:- Daily , Weekly | |
| Add RLX to Watchlist: View: Get Complete RLX Trend Analysis ➞ | |
 | YRD Yiren Digital Ltd. |
| Sector: Financials | |
| SubSector: Credit Services | |
| MarketCap: 330.208 Millions | |
| Recent Price: 5.08 Smart Investing & Trading Score : 73 | |
| Day Percent Change: 1.20% Day Change: 0.06 | |
| Week Change: 5.18% Year-to-date Change: 62.8% | |
| YRD Links: Profile News Message Board | |
| Charts:- Daily , Weekly | |
| Add YRD to Watchlist: View: Get Complete YRD Trend Analysis ➞ | |
 | TUYA Tuya Inc. |
| Sector: Technology | |
| SubSector: Software - Infrastructure | |
| MarketCap: 1050 Millions | |
| Recent Price: 1.65 Smart Investing & Trading Score : 42 | |
| Day Percent Change: -4.62% Day Change: -0.08 | |
| Week Change: 5.1% Year-to-date Change: -28.1% | |
| TUYA Links: Profile News Message Board | |
| Charts:- Daily , Weekly | |
| Add TUYA to Watchlist: View: Get Complete TUYA Trend Analysis ➞ | |
 | XNET Xunlei Limited |
| Sector: Technology | |
| SubSector: Application Software | |
| MarketCap: 203.662 Millions | |
| Recent Price: 1.55 Smart Investing & Trading Score : 90 | |
| Day Percent Change: -0.32% Day Change: -0.01 | |
| Week Change: 5.07% Year-to-date Change: -4.0% | |
| XNET Links: Profile News Message Board | |
| Charts:- Daily , Weekly | |
| Add XNET to Watchlist: View: Get Complete XNET Trend Analysis ➞ | |
 | XIN Xinyuan Real Estate Co., Ltd. |
| Sector: Financials | |
| SubSector: Real Estate Development | |
| MarketCap: 136.119 Millions | |
| Recent Price: 2.73 Smart Investing & Trading Score : 49 | |
| Day Percent Change: 0.74% Day Change: 0.02 | |
| Week Change: 5% Year-to-date Change: 0.4% | |
| XIN Links: Profile News Message Board | |
| Charts:- Daily , Weekly | |
| Add XIN to Watchlist: View: Get Complete XIN Trend Analysis ➞ | |
 | NOAH Noah Holdings Limited |
| Sector: Financials | |
| SubSector: Asset Management | |
| MarketCap: 1495.33 Millions | |
| Recent Price: 12.19 Smart Investing & Trading Score : 78 | |
| Day Percent Change: 0.41% Day Change: 0.05 | |
| Week Change: 4.91% Year-to-date Change: -11.7% | |
| NOAH Links: Profile News Message Board | |
| Charts:- Daily , Weekly | |
| Add NOAH to Watchlist: View: Get Complete NOAH Trend Analysis ➞ | |
 | DDL Dingdong (Cayman) Limited |
| Sector: Consumer Staples | |
| SubSector: Grocery Stores | |
| MarketCap: 708 Millions | |
| Recent Price: 1.21 Smart Investing & Trading Score : 54 | |
| Day Percent Change: -1.23% Day Change: -0.01 | |
| Week Change: 4.78% Year-to-date Change: -20.7% | |
| DDL Links: Profile News Message Board | |
| Charts:- Daily , Weekly | |
| Add DDL to Watchlist: View: Get Complete DDL Trend Analysis ➞ | |
 | UCL uCloudlink Group Inc. |
| Sector: Technology | |
| SubSector: Telecom Services | |
| MarketCap: 35837 Millions | |
| Recent Price: 1.44 Smart Investing & Trading Score : 30 | |
| Day Percent Change: 0.00% Day Change: 0.00 | |
| Week Change: 4.73% Year-to-date Change: -22.2% | |
| UCL Links: Profile News Message Board | |
| Charts:- Daily , Weekly | |
| Add UCL to Watchlist: View: Get Complete UCL Trend Analysis ➞ | |
 | SY So-Young International Inc. |
| Sector: Technology | |
| SubSector: Healthcare Information Services | |
| MarketCap: 1000.55 Millions | |
| Recent Price: 1.22 Smart Investing & Trading Score : 68 | |
| Day Percent Change: -3.17% Day Change: -0.04 | |
| Week Change: 4.72% Year-to-date Change: -5.4% | |
| SY Links: Profile News Message Board | |
| Charts:- Daily , Weekly | |
| Add SY to Watchlist: View: Get Complete SY Trend Analysis ➞ | |
 | TV Grupo Televisa, S.A.B. |
| Sector: Services & Goods | |
| SubSector: Broadcasting - TV | |
| MarketCap: 3740.43 Millions | |
| Recent Price: 2.94 Smart Investing & Trading Score : 42 | |
| Day Percent Change: -2.00% Day Change: -0.06 | |
| Week Change: 4.63% Year-to-date Change: -12.0% | |
| TV Links: Profile News Message Board | |
| Charts:- Daily , Weekly | |
| Add TV to Watchlist: View: Get Complete TV Trend Analysis ➞ | |
 | LU Lufax Holding Ltd |
| Sector: Financials | |
| SubSector: Credit Services | |
| MarketCap: 33457 Millions | |
| Recent Price: 4.55 Smart Investing & Trading Score : 90 | |
| Day Percent Change: 4.36% Day Change: 0.19 | |
| Week Change: 4.6% Year-to-date Change: 48.2% | |
| LU Links: Profile News Message Board | |
| Charts:- Daily , Weekly | |
| Add LU to Watchlist: View: Get Complete LU Trend Analysis ➞ | |
 | YUMC Yum China Holdings, Inc. |
| Sector: Services & Goods | |
| SubSector: Restaurants | |
| MarketCap: 16284.5 Millions | |
| Recent Price: 38.80 Smart Investing & Trading Score : 85 | |
| Day Percent Change: 1.15% Day Change: 0.44 | |
| Week Change: 4.58% Year-to-date Change: -8.6% | |
| YUMC Links: Profile News Message Board | |
| Charts:- Daily , Weekly | |
| Add YUMC to Watchlist: View: Get Complete YUMC Trend Analysis ➞ | |
 | HUYA HUYA Inc. |
| Sector: Services & Goods | |
| SubSector: Entertainment - Diversified | |
| MarketCap: 3358.17 Millions | |
| Recent Price: 4.61 Smart Investing & Trading Score : 48 | |
| Day Percent Change: 4.06% Day Change: 0.18 | |
| Week Change: 4.54% Year-to-date Change: 26.0% | |
| HUYA Links: Profile News Message Board | |
| Charts:- Daily , Weekly | |
| Add HUYA to Watchlist: View: Get Complete HUYA Trend Analysis ➞ | |
 | BIDU Baidu, Inc. |
| Sector: Technology | |
| SubSector: Internet Information Providers | |
| MarketCap: 33525.9 Millions | |
| Recent Price: 99.19 Smart Investing & Trading Score : 59 | |
| Day Percent Change: 0.98% Day Change: 0.96 | |
| Week Change: 4.36% Year-to-date Change: -16.7% | |
| BIDU Links: Profile News Message Board | |
| Charts:- Daily , Weekly | |
| Add BIDU to Watchlist: View: Get Complete BIDU Trend Analysis ➞ | |
 | LX LexinFintech Holdings Ltd. |
| Sector: Financials | |
| SubSector: Credit Services | |
| MarketCap: 1674.18 Millions | |
| Recent Price: 1.70 Smart Investing & Trading Score : 10 | |
| Day Percent Change: 0.59% Day Change: 0.01 | |
| Week Change: 4.29% Year-to-date Change: -7.6% | |
| LX Links: Profile News Message Board | |
| Charts:- Daily , Weekly | |
| Add LX to Watchlist: View: Get Complete LX Trend Analysis ➞ | |
 | VIPS Vipshop Holdings Limited |
| Sector: Services & Goods | |
| SubSector: Catalog & Mail Order Houses | |
| MarketCap: 10496.2 Millions | |
| Recent Price: 15.81 Smart Investing & Trading Score : 45 | |
| Day Percent Change: 0.13% Day Change: 0.02 | |
| Week Change: 4.29% Year-to-date Change: -11.0% | |
| VIPS Links: Profile News Message Board | |
| Charts:- Daily , Weekly | |
| Add VIPS to Watchlist: View: Get Complete VIPS Trend Analysis ➞ | |
 | WIT Wipro Limited |
| Sector: Technology | |
| SubSector: Information Technology Services | |
| MarketCap: 15101.3 Millions | |
| Recent Price: 5.47 Smart Investing & Trading Score : 42 | |
| Day Percent Change: -0.73% Day Change: -0.04 | |
| Week Change: 4.19% Year-to-date Change: -1.8% | |
| WIT Links: Profile News Message Board | |
| Charts:- Daily , Weekly | |
| Add WIT to Watchlist: View: Get Complete WIT Trend Analysis ➞ | |
 | TSM Taiwan Semiconductor Manufacturing Company Limited |
| Sector: Technology | |
| SubSector: Semiconductor - Integrated Circuits | |
| MarketCap: 239384 Millions | |
| Recent Price: 132.97 Smart Investing & Trading Score : 68 | |
| Day Percent Change: -0.34% Day Change: -0.46 | |
| Week Change: 4.13% Year-to-date Change: 27.9% | |
| TSM Links: Profile News Message Board | |
| Charts:- Daily , Weekly | |
| Add TSM to Watchlist: View: Get Complete TSM Trend Analysis ➞ | |
 | QFIN 360 Finance, Inc. |
| Sector: Financials | |
| SubSector: Credit Services | |
| MarketCap: 956.208 Millions | |
| Recent Price: 18.73 Smart Investing & Trading Score : 46 | |
| Day Percent Change: 1.19% Day Change: 0.22 | |
| Week Change: 4.06% Year-to-date Change: 18.4% | |
| QFIN Links: Profile News Message Board | |
| Charts:- Daily , Weekly | |
| Add QFIN to Watchlist: View: Get Complete QFIN Trend Analysis ➞ | |
| For tabular summary view of above stock list: Summary View ➞ 0 - 25 , 25 - 50 , 50 - 75 , 75 - 100 , 100 - 125 , 125 - 150 , 150 - 175 , 175 - 200 | ||
| Click To Change The Sort Order: By Market Cap or Company Size Performance: Year-to-date, Week and Day | |
| Select Chart Type: | ||
|
Best Stocks Today 12Stocks.com |
© 2024 12Stocks.com Terms & Conditions Privacy Contact Us
All Information Provided Only For Education And Not To Be Used For Investing or Trading. See Terms & Conditions


One More Thing ... Get Best Stocks Delivered Daily!
Never Ever Miss A Move With Our Top Ten Stocks Lists
Find Best Stocks In Any Market - Bull or Bear Market
Take A Peek At Our Top Ten Stocks Lists: Daily, Weekly, Year-to-Date & Top Trends
Find Best Stocks In Any Market - Bull or Bear Market
Take A Peek At Our Top Ten Stocks Lists: Daily, Weekly, Year-to-Date & Top Trends
Emerging Markets Stocks With Best Up Trends [0-bearish to 100-bullish]: Yatsen Holding[100], ZTO Express[100], Alibaba [100], JD.com [100], MINISO [100], Controladora Vuela[100], Full Truck[100], Grupo Aeroportuario[100], Grupo Aeroportuario[100], WiMi Hologram[95], Baozun [95]
Best Emerging Markets Stocks Year-to-Date:
U Power[3013.84%], DouYu [802.11%], MicroCloud Hologram[574.82%], China Liberal[531.99%], Yatsen Holding[479.55%], Zhongchao [325.91%], Uxin [169.61%], QuantaSing [106.48%], GigaCloud [96.01%], Cheetah Mobile[73.68%], Yiren Digital[62.82%] Best Emerging Markets Stocks This Week:
WiMi Hologram[64.85%], Aesthetic Medical[53.58%], Golden Heaven[20.85%], Intchains [20.36%], iQIYI [17.99%], Yatsen Holding[17.29%], Bilibili [16.87%], GDS [14.87%], Baozun [14.66%], Grupo Aeroportuario[12.81%], Pinduoduo [12.39%] Best Emerging Markets Stocks Daily:
WiMi Hologram[58.53%], Aesthetic Medical[44.75%], Intchains [22.28%], Uxin [13.86%], Golden Heaven[11.81%], 17 Education[11.70%], Bilibili [10.97%], AMTD Digital[8.33%], Yatsen Holding[7.89%], Dada Nexus[7.53%], U Power[7.31%]