
 Login Sign Up


| |||||
 |  | ||||

| 12Stocks.com Market Intelligence |
Best Emerging Markets Stocks
| In a hurry? Emerging Markets Stocks Lists: Trends Table, Stock Charts
Sort Emerging Markets stocks: Daily, Weekly, Year-to-Date, Market Cap & Trends. Filter Emerging Markets stocks list by sector: Show all, Tech, Finance, Energy, Staples, Retail, Industrial, Materials, Utilities and HealthCare Filter Emerging Markets stocks list by size:All Large Medium Small |
| 12Stocks.com Emerging Markets Stocks Performances & Trends Daily | |||||||||
|
|  The overall Smart Investing & Trading Score is 68 (0-bearish to 100-bullish) which puts Emerging Markets index in short term neutral to bullish trend. The Smart Investing & Trading Score from previous trading session is 63 and an improvement of trend continues.
| ||||||||
Here are the Smart Investing & Trading Scores of the most requested Emerging Markets stocks at 12Stocks.com (click stock name for detailed review):
|


| 12Stocks.com: Top Performing Emerging Markets Index Stocks | ||||||||||||||||||||||||||||||||||||||||||||||||
 The top performing Emerging Markets Index stocks year to date are
Now, more recently, over last week, the top performing Emerging Markets Index stocks on the move are


|
||||||||||||||||||||||||||||||||||||||||||||||||
| 12Stocks.com: Investing in Emerging Markets Index with Stocks | |
|
The following table helps investors and traders sort through current performance and trends (as measured by Smart Investing & Trading Score ) of various
stocks in the Emerging Markets Index. Quick View: Move mouse or cursor over stock symbol (ticker) to view short-term technical chart and over stock name to view long term chart. Click on  to add stock symbol to your watchlist and to add stock symbol to your watchlist and  to view watchlist. Click on any ticker or stock name for detailed market intelligence report for that stock. to view watchlist. Click on any ticker or stock name for detailed market intelligence report for that stock. |
12Stocks.com Performance of Stocks in Emerging Markets Index
| Ticker | Stock Name | Watchlist | Category | Recent Price | Smart Investing & Trading Score | Change % | YTD Change% |
| LU | Lufax Holding |   | Financials | 4.50 | 90 | 3.10% | 46.42% |
| VTRU | Vitru | | Consumer Staples | 13.29 | 35 | -0.37% | -15.99% |
| BQ | Boqii Holding | | Services & Goods | 0.26 | 25 | 2.12% | -42.52% |
| XPEV | XPeng | | Services & Goods | 7.16 | 42 | -0.35% | -50.96% |
| YQ | 17 Education | | Consumer Staples | 2.62 | 36 | 11.49% | 28.43% |
| EDTK | Skillful Craftsman | | Consumer Staples | 0.93 | 25 | 0.00% | -26.34% |
| CLEU | China Liberal | | Consumer Staples | 1.07 | 59 | 0.00% | 498.43% |
| IBN | ICICI Bank | | Financials | 26.13 | 90 | -0.61% | 9.61% |
| BBD | Banco Bradesco | | Financials | 2.65 | 25 | -0.56% | -24.43% |
| TAL | TAL Education | | Services & Goods | 12.00 | 78 | -1.56% | -4.99% |
| HDB | HDFC Bank | | Financials | 57.88 | 53 | -0.96% | -13.75% |
| LI | Li Auto | | Services & Goods | 24.23 | 0 | -2.36% | -35.30% |
| CHT | Chunghwa Telecom | | Technology | 38.25 | 51 | -0.88% | -2.10% |
| BNR | Burning Rock | | Health Care | 0.86 | 57 | 0.00% | -10.98% |
| BBDO | Banco Bradesco | | Financials | 2.35 | 27 | 0.21% | -26.10% |
| FMX | Fomento Economico | | Consumer Staples | 116.19 | 10 | -0.16% | -10.86% |
| BSBR | Banco Santander | | Financials | 5.25 | 34 | -0.76% | -19.85% |
| ZTO | ZTO Express | | Transports | 21.09 | 100 | 4.20% | -0.89% |
| VIV | Telefonica Brasil | | Technology | 9.30 | 18 | -0.91% | -14.95% |
| EDU | New Oriental | | Services & Goods | 77.51 | 26 | -13.48% | 5.77% |
| YUMC | Yum China | | Services & Goods | 38.37 | 85 | 0.03% | -9.57% |
| WIT | Wipro | | Technology | 5.42 | 42 | -1.54% | -2.60% |
| VSTA | Vasta Platform | | Consumer Staples | 3.80 | 35 | 0.00% | -13.64% |
| LXEH | Lixiang Education | | Consumer Staples | 0.41 | 45 | 0.67% | -62.46% |
| IH | iHuman | | Consumer Staples | 1.77 | 42 | 4.12% | -41.97% |
| For chart view version of above stock list: Chart View ➞ 0 - 25 , 25 - 50 , 50 - 75 , 75 - 100 , 100 - 125 , 125 - 150 , 150 - 175 | ||
 | Click To Change The Sort Order: By Market Cap or Company Size Performance: Year-to-date, Week and Day |  |
|
Get the most comprehensive stock market coverage daily at 12Stocks.com ➞ Best Stocks Today ➞ Best Stocks Weekly ➞ Best Stocks Year-to-Date ➞ Best Stocks Trends ➞  Best Stocks Today 12Stocks.com Best Nasdaq Stocks ➞ Best S&P 500 Stocks ➞ Best Tech Stocks ➞ Best Biotech Stocks ➞ |
| Detailed Overview of Emerging Markets Stocks |
| Emerging Markets Technical Overview, Leaders & Laggards, Top Emerging Markets ETF Funds & Detailed Emerging Markets Stocks List, Charts, Trends & More |
| Emerging Markets: Technical Analysis, Trends & YTD Performance | |
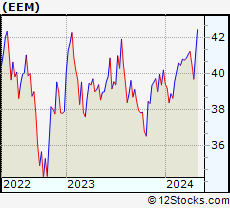
 EEM Weekly Chart |
|
| Long Term Trend: Very Good | |
| Medium Term Trend: Not Good | |
 EEM Daily Chart |
|
| Short Term Trend: Very Good | |
| Overall Trend Score: 68 | |
| YTD Performance: 0.88% | |
| **Trend Scores & Views Are Only For Educational Purposes And Not For Investing | |
| 12Stocks.com: Investing in Emerging Markets Index using Exchange Traded Funds | |
|
The following table shows list of key exchange traded funds (ETF) that
help investors play Emerging Markets stock market. For detailed view, check out our ETF Funds section of our website. Quick View: Move mouse or cursor over ETF symbol (ticker) to view short-term technical chart and over ETF name to view long term chart. Click on ticker or stock name for detailed view. Click on to add stock symbol to your watchlist and to view watchlist. |
12Stocks.com List of ETFs that track Emerging Markets Index
| Ticker | ETF Name | Watchlist | Recent Price | Smart Investing & Trading Score | Change % | Week % | Year-to-date % |
| EEM | Emerging Markets | | 40.56 | 68 | 0.23 | 2.15 | 0.88% |
| VWO | Emerging Markets | | 41.63 | 68 | 0.11 | 1.8 | 1.28% |
| SCHE | Emerging Markets Equity | | 25.21 | 68 | 0.44 | 2.11 | 1.69% |
| EET | Emerging Markets | | 49.75 | 68 | 0.87 | 4.26 | -2.18% |
| EDC | Emrg Mkts Bull | | 28.82 | 63 | 0.52 | 6.46 | -5.29% |
| EEV | Short Emerging | | 19.70 | 32 | -0.33 | -4.01 | -0.14% |
| EUM | Short Emerging | | 14.18 | 32 | -0.31 | -2.17 | 0.2% |
| PCY | Emerging Markets Sov | | 19.75 | 25 | -0.65 | -0.3 | -4.22% |
| 12Stocks.com: Charts, Trends, Fundamental Data and Performances of Emerging Markets Stocks | |
|
We now take in-depth look at all Emerging Markets stocks including charts, multi-period performances and overall trends (as measured by Smart Investing & Trading Score ). One can sort Emerging Markets stocks (click link to choose) by Daily, Weekly and by Year-to-Date performances. Also, one can sort by size of the company or by market capitalization. |
| Select Your Default Chart Type: | |||||
| |||||
| Click on stock symbol or name for detailed view. Click on to add stock symbol to your watchlist and to view watchlist. Quick View: Move mouse or cursor over "Daily" to quickly view daily technical stock chart and over "Weekly" to view weekly technical stock chart. | |||||

 | LU Lufax Holding Ltd |
| Sector: Financials | |
| SubSector: Credit Services | |
| MarketCap: 33457 Millions | |
| Recent Price: 4.50 Smart Investing & Trading Score : 90 | |
| Day Percent Change: 3.10% Day Change: 0.13 | |
| Week Change: 3.33% Year-to-date Change: 46.4% | |
| LU Links: Profile News Message Board | |
| Charts:- Daily , Weekly | |
| Add LU to Watchlist: View: Get Complete LU Trend Analysis ➞ | |
 | VTRU Vitru Limited |
| Sector: Consumer Staples | |
| SubSector: Education & Training Services | |
| MarketCap: 33347 Millions | |
| Recent Price: 13.29 Smart Investing & Trading Score : 35 | |
| Day Percent Change: -0.37% Day Change: -0.05 | |
| Week Change: 7.79% Year-to-date Change: -16.0% | |
| VTRU Links: Profile News Message Board | |
| Charts:- Daily , Weekly | |
| Add VTRU to Watchlist: View: Get Complete VTRU Trend Analysis ➞ | |
 | BQ Boqii Holding Limited |
| Sector: Services & Goods | |
| SubSector: Specialty Retail | |
| MarketCap: 33027 Millions | |
| Recent Price: 0.26 Smart Investing & Trading Score : 25 | |
| Day Percent Change: 2.12% Day Change: 0.01 | |
| Week Change: -4.16% Year-to-date Change: -42.5% | |
| BQ Links: Profile News Message Board | |
| Charts:- Daily , Weekly | |
| Add BQ to Watchlist: View: Get Complete BQ Trend Analysis ➞ | |
 | XPEV XPeng Inc. |
| Sector: Services & Goods | |
| SubSector: Auto Manufacturers | |
| MarketCap: 32917 Millions | |
| Recent Price: 7.16 Smart Investing & Trading Score : 42 | |
| Day Percent Change: -0.35% Day Change: -0.02 | |
| Week Change: 1.56% Year-to-date Change: -51.0% | |
| XPEV Links: Profile News Message Board | |
| Charts:- Daily , Weekly | |
| Add XPEV to Watchlist: View: Get Complete XPEV Trend Analysis ➞ | |
 | YQ 17 Education & Technology Group Inc. |
| Sector: Consumer Staples | |
| SubSector: Education & Training Services | |
| MarketCap: 32347 Millions | |
| Recent Price: 2.62 Smart Investing & Trading Score : 36 | |
| Day Percent Change: 11.49% Day Change: 0.27 | |
| Week Change: 6.29% Year-to-date Change: 28.4% | |
| YQ Links: Profile News Message Board | |
| Charts:- Daily , Weekly | |
| Add YQ to Watchlist: View: Get Complete YQ Trend Analysis ➞ | |
 | EDTK Skillful Craftsman Education Technology Limited |
| Sector: Consumer Staples | |
| SubSector: Education & Training Services | |
| MarketCap: 32347 Millions | |
| Recent Price: 0.93 Smart Investing & Trading Score : 25 | |
| Day Percent Change: 0.00% Day Change: 0.00 | |
| Week Change: 1.43% Year-to-date Change: -26.3% | |
| EDTK Links: Profile News Message Board | |
| Charts:- Daily , Weekly | |
| Add EDTK to Watchlist: View: Get Complete EDTK Trend Analysis ➞ | |
 | CLEU China Liberal Education Holdings Limited |
| Sector: Consumer Staples | |
| SubSector: Education & Training Services | |
| MarketCap: 32347 Millions | |
| Recent Price: 1.07 Smart Investing & Trading Score : 59 | |
| Day Percent Change: 0.00% Day Change: 0.00 | |
| Week Change: 3.8% Year-to-date Change: 498.4% | |
| CLEU Links: Profile News Message Board | |
| Charts:- Daily , Weekly | |
| Add CLEU to Watchlist: View: Get Complete CLEU Trend Analysis ➞ | |
 | IBN ICICI Bank Limited |
| Sector: Financials | |
| SubSector: Money Center Banks | |
| MarketCap: 31194.1 Millions | |
| Recent Price: 26.13 Smart Investing & Trading Score : 90 | |
| Day Percent Change: -0.61% Day Change: -0.16 | |
| Week Change: 1.75% Year-to-date Change: 9.6% | |
| IBN Links: Profile News Message Board | |
| Charts:- Daily , Weekly | |
| Add IBN to Watchlist: View: Get Complete IBN Trend Analysis ➞ | |
 | BBD Banco Bradesco S.A. |
| Sector: Financials | |
| SubSector: Foreign Regional Banks | |
| MarketCap: 30281.7 Millions | |
| Recent Price: 2.65 Smart Investing & Trading Score : 25 | |
| Day Percent Change: -0.56% Day Change: -0.02 | |
| Week Change: 0.19% Year-to-date Change: -24.4% | |
| BBD Links: Profile News Message Board | |
| Charts:- Daily , Weekly | |
| Add BBD to Watchlist: View: Get Complete BBD Trend Analysis ➞ | |
 | TAL TAL Education Group |
| Sector: Services & Goods | |
| SubSector: Education & Training Services | |
| MarketCap: 30103.1 Millions | |
| Recent Price: 12.00 Smart Investing & Trading Score : 78 | |
| Day Percent Change: -1.56% Day Change: -0.19 | |
| Week Change: 4.99% Year-to-date Change: -5.0% | |
| TAL Links: Profile News Message Board | |
| Charts:- Daily , Weekly | |
| Add TAL to Watchlist: View: Get Complete TAL Trend Analysis ➞ | |
 | HDB HDFC Bank Limited |
| Sector: Financials | |
| SubSector: Foreign Regional Banks | |
| MarketCap: 29894.1 Millions | |
| Recent Price: 57.88 Smart Investing & Trading Score : 53 | |
| Day Percent Change: -0.96% Day Change: -0.56 | |
| Week Change: -1.98% Year-to-date Change: -13.8% | |
| HDB Links: Profile News Message Board | |
| Charts:- Daily , Weekly | |
| Add HDB to Watchlist: View: Get Complete HDB Trend Analysis ➞ | |
 | LI Li Auto Inc. |
| Sector: Services & Goods | |
| SubSector: Auto Manufacturers | |
| MarketCap: 29167 Millions | |
| Recent Price: 24.23 Smart Investing & Trading Score : 0 | |
| Day Percent Change: -2.36% Day Change: -0.58 | |
| Week Change: -10.97% Year-to-date Change: -35.3% | |
| LI Links: Profile News Message Board | |
| Charts:- Daily , Weekly | |
| Add LI to Watchlist: View: Get Complete LI Trend Analysis ➞ | |
 | CHT Chunghwa Telecom Co., Ltd. |
| Sector: Technology | |
| SubSector: Telecom Services - Domestic | |
| MarketCap: 28101.3 Millions | |
| Recent Price: 38.25 Smart Investing & Trading Score : 51 | |
| Day Percent Change: -0.88% Day Change: -0.34 | |
| Week Change: 1.06% Year-to-date Change: -2.1% | |
| CHT Links: Profile News Message Board | |
| Charts:- Daily , Weekly | |
| Add CHT to Watchlist: View: Get Complete CHT Trend Analysis ➞ | |
 | BNR Burning Rock Biotech Limited |
| Sector: Health Care | |
| SubSector: Diagnostics & Research | |
| MarketCap: 27887 Millions | |
| Recent Price: 0.86 Smart Investing & Trading Score : 57 | |
| Day Percent Change: 0.00% Day Change: 0.00 | |
| Week Change: 7.38% Year-to-date Change: -11.0% | |
| BNR Links: Profile News Message Board | |
| Charts:- Daily , Weekly | |
| Add BNR to Watchlist: View: Get Complete BNR Trend Analysis ➞ | |
 | BBDO Banco Bradesco S.A. |
| Sector: Financials | |
| SubSector: Foreign Regional Banks | |
| MarketCap: 27711.4 Millions | |
| Recent Price: 2.35 Smart Investing & Trading Score : 27 | |
| Day Percent Change: 0.21% Day Change: 0.00 | |
| Week Change: 0.86% Year-to-date Change: -26.1% | |
| BBDO Links: Profile News Message Board | |
| Charts:- Daily , Weekly | |
| Add BBDO to Watchlist: View: Get Complete BBDO Trend Analysis ➞ | |
 | FMX Fomento Economico Mexicano, S.A.B. de C.V. |
| Sector: Consumer Staples | |
| SubSector: Beverages - Brewers | |
| MarketCap: 22018.7 Millions | |
| Recent Price: 116.19 Smart Investing & Trading Score : 10 | |
| Day Percent Change: -0.16% Day Change: -0.19 | |
| Week Change: -2.92% Year-to-date Change: -10.9% | |
| FMX Links: Profile News Message Board | |
| Charts:- Daily , Weekly | |
| Add FMX to Watchlist: View: Get Complete FMX Trend Analysis ➞ | |
 | BSBR Banco Santander (Brasil) S.A. |
| Sector: Financials | |
| SubSector: Foreign Regional Banks | |
| MarketCap: 21961.4 Millions | |
| Recent Price: 5.25 Smart Investing & Trading Score : 34 | |
| Day Percent Change: -0.76% Day Change: -0.04 | |
| Week Change: 0% Year-to-date Change: -19.9% | |
| BSBR Links: Profile News Message Board | |
| Charts:- Daily , Weekly | |
| Add BSBR to Watchlist: View: Get Complete BSBR Trend Analysis ➞ | |
 | ZTO ZTO Express (Cayman) Inc. |
| Sector: Transports | |
| SubSector: Air Delivery & Freight Services | |
| MarketCap: 20507 Millions | |
| Recent Price: 21.09 Smart Investing & Trading Score : 100 | |
| Day Percent Change: 4.20% Day Change: 0.85 | |
| Week Change: 5.77% Year-to-date Change: -0.9% | |
| ZTO Links: Profile News Message Board | |
| Charts:- Daily , Weekly | |
| Add ZTO to Watchlist: View: Get Complete ZTO Trend Analysis ➞ | |
 | VIV Telefonica Brasil S.A. |
| Sector: Technology | |
| SubSector: Wireless Communications | |
| MarketCap: 19611.1 Millions | |
| Recent Price: 9.30 Smart Investing & Trading Score : 18 | |
| Day Percent Change: -0.91% Day Change: -0.09 | |
| Week Change: -0.48% Year-to-date Change: -15.0% | |
| VIV Links: Profile News Message Board | |
| Charts:- Daily , Weekly | |
| Add VIV to Watchlist: View: Get Complete VIV Trend Analysis ➞ | |
 | EDU New Oriental Education & Technology Group Inc. |
| Sector: Services & Goods | |
| SubSector: Education & Training Services | |
| MarketCap: 18673.7 Millions | |
| Recent Price: 77.51 Smart Investing & Trading Score : 26 | |
| Day Percent Change: -13.48% Day Change: -12.08 | |
| Week Change: -8.8% Year-to-date Change: 5.8% | |
| EDU Links: Profile News Message Board | |
| Charts:- Daily , Weekly | |
| Add EDU to Watchlist: View: Get Complete EDU Trend Analysis ➞ | |
 | YUMC Yum China Holdings, Inc. |
| Sector: Services & Goods | |
| SubSector: Restaurants | |
| MarketCap: 16284.5 Millions | |
| Recent Price: 38.37 Smart Investing & Trading Score : 85 | |
| Day Percent Change: 0.03% Day Change: 0.01 | |
| Week Change: 3.42% Year-to-date Change: -9.6% | |
| YUMC Links: Profile News Message Board | |
| Charts:- Daily , Weekly | |
| Add YUMC to Watchlist: View: Get Complete YUMC Trend Analysis ➞ | |
 | WIT Wipro Limited |
| Sector: Technology | |
| SubSector: Information Technology Services | |
| MarketCap: 15101.3 Millions | |
| Recent Price: 5.42 Smart Investing & Trading Score : 42 | |
| Day Percent Change: -1.54% Day Change: -0.08 | |
| Week Change: 3.33% Year-to-date Change: -2.6% | |
| WIT Links: Profile News Message Board | |
| Charts:- Daily , Weekly | |
| Add WIT to Watchlist: View: Get Complete WIT Trend Analysis ➞ | |
 | VSTA Vasta Platform Limited |
| Sector: Consumer Staples | |
| SubSector: Education & Training Services | |
| MarketCap: 12747 Millions | |
| Recent Price: 3.80 Smart Investing & Trading Score : 35 | |
| Day Percent Change: 0.00% Day Change: 0.00 | |
| Week Change: 1.33% Year-to-date Change: -13.6% | |
| VSTA Links: Profile News Message Board | |
| Charts:- Daily , Weekly | |
| Add VSTA to Watchlist: View: Get Complete VSTA Trend Analysis ➞ | |
 | LXEH Lixiang Education Holding Co., Ltd. |
| Sector: Consumer Staples | |
| SubSector: Education & Training Services | |
| MarketCap: 12347 Millions | |
| Recent Price: 0.41 Smart Investing & Trading Score : 45 | |
| Day Percent Change: 0.67% Day Change: 0.00 | |
| Week Change: -0.42% Year-to-date Change: -62.5% | |
| LXEH Links: Profile News Message Board | |
| Charts:- Daily , Weekly | |
| Add LXEH to Watchlist: View: Get Complete LXEH Trend Analysis ➞ | |
 | IH iHuman Inc. |
| Sector: Consumer Staples | |
| SubSector: Education & Training Services | |
| MarketCap: 12247 Millions | |
| Recent Price: 1.77 Smart Investing & Trading Score : 42 | |
| Day Percent Change: 4.12% Day Change: 0.07 | |
| Week Change: 2.19% Year-to-date Change: -42.0% | |
| IH Links: Profile News Message Board | |
| Charts:- Daily , Weekly | |
| Add IH to Watchlist: View: Get Complete IH Trend Analysis ➞ | |
| For tabular summary view of above stock list: Summary View ➞ 0 - 25 , 25 - 50 , 50 - 75 , 75 - 100 , 100 - 125 , 125 - 150 , 150 - 175 | ||
| Click To Change The Sort Order: By Market Cap or Company Size Performance: Year-to-date, Week and Day | |
| Select Chart Type: | ||
|
Best Stocks Today 12Stocks.com |
© 2024 12Stocks.com Terms & Conditions Privacy Contact Us
All Information Provided Only For Education And Not To Be Used For Investing or Trading. See Terms & Conditions


One More Thing ... Get Best Stocks Delivered Daily!
Never Ever Miss A Move With Our Top Ten Stocks Lists
Find Best Stocks In Any Market - Bull or Bear Market
Take A Peek At Our Top Ten Stocks Lists: Daily, Weekly, Year-to-Date & Top Trends
Find Best Stocks In Any Market - Bull or Bear Market
Take A Peek At Our Top Ten Stocks Lists: Daily, Weekly, Year-to-Date & Top Trends
Emerging Markets Stocks With Best Up Trends [0-bearish to 100-bullish]: Yatsen Holding[100], ZTO Express[100], JD.com [100], Alibaba [100], Full Truck[100], Controladora Vuela[100], MINISO [100], Grupo Aeroportuario[100], BRF S.A[100], Grupo Aeroportuario[100], WiMi Hologram[95]
Best Emerging Markets Stocks Year-to-Date:
U Power[2785.04%], MicroCloud Hologram[625.18%], China Liberal[498.43%], Yatsen Holding[473.4%], Zhongchao [353.3%], Uxin [146.79%], QuantaSing [105.25%], GigaCloud [102.68%], Cheetah Mobile[71.49%], Yiren Digital[61.54%], Lufax Holding[46.42%] Best Emerging Markets Stocks This Week:
WiMi Hologram[29.01%], Yatsen Holding[16.04%], Baozun [12.72%], GDS [12.26%], Grupo Aeroportuario[12.24%], TOP Financial[11.91%], JD.com [10.62%], Controladora Vuela[10.51%], Cheetah Mobile[10.45%], AMTD Digital[9.74%], Grupo Aeroportuario[9.73%] Best Emerging Markets Stocks Daily:
WiMi Hologram[24.07%], 17 Education[11.49%], AMTD Digital[8.33%], Intchains [7.71%], Yatsen Holding[6.74%], TOP Financial[6.05%], GDS [4.80%], Uxin [4.22%], ZTO Express[4.20%], MingZhu Logistics[4.18%], iHuman [4.12%]