
 Login Sign Up


| |||||
 |  | ||||

| 12Stocks.com Market Intelligence |
Best Emerging Markets Stocks
| In a hurry? Emerging Markets Stocks Lists: Trends Table, Stock Charts
Sort Emerging Markets stocks: Daily, Weekly, Year-to-Date, Market Cap & Trends. Filter Emerging Markets stocks list by sector: Show all, Tech, Finance, Energy, Staples, Retail, Industrial, Materials, Utilities and HealthCare Filter Emerging Markets stocks list by size:All Large Medium Small |
| 12Stocks.com Emerging Markets Stocks Performances & Trends Daily | |||||||||
|
|  The overall Smart Investing & Trading Score is 44 (0-bearish to 100-bullish) which puts Emerging Markets index in short term neutral trend. The Smart Investing & Trading Score from previous trading session is 48 and hence a deterioration of trend.
| ||||||||
Here are the Smart Investing & Trading Scores of the most requested Emerging Markets stocks at 12Stocks.com (click stock name for detailed review):
|


| 12Stocks.com: Top Performing Emerging Markets Index Stocks | ||||||||||||||||||||||||||||||||||||||||||||||||
 The top performing Emerging Markets Index stocks year to date are
Now, more recently, over last week, the top performing Emerging Markets Index stocks on the move are


|
||||||||||||||||||||||||||||||||||||||||||||||||
| 12Stocks.com: Investing in Emerging Markets Index with Stocks | |
|
The following table helps investors and traders sort through current performance and trends (as measured by Smart Investing & Trading Score ) of various
stocks in the Emerging Markets Index. Quick View: Move mouse or cursor over stock symbol (ticker) to view short-term technical chart and over stock name to view long term chart. Click on  to add stock symbol to your watchlist and to add stock symbol to your watchlist and  to view watchlist. Click on any ticker or stock name for detailed market intelligence report for that stock. to view watchlist. Click on any ticker or stock name for detailed market intelligence report for that stock. |
12Stocks.com Performance of Stocks in Emerging Markets Index
| Ticker | Stock Name | Watchlist | Category | Recent Price | Smart Investing & Trading Score | Change % | YTD Change% |
| ABEV | Ambev S.A |   | Consumer Staples | 2.29 | 32 | 0.66% | -18.04% |
| VTRU | Vitru | | Consumer Staples | 12.33 | 20 | -0.76% | -22.06% |
| YQ | 17 Education | | Consumer Staples | 2.46 | 58 | 1.44% | 20.83% |
| EDTK | Skillful Craftsman | | Consumer Staples | 0.92 | 18 | -0.54% | -27.38% |
| CLEU | China Liberal | | Consumer Staples | 1.03 | 49 | 3.08% | 476.51% |
| FMX | Fomento Economico | | Consumer Staples | 119.69 | 25 | 0.52% | -8.17% |
| VSTA | Vasta Platform | | Consumer Staples | 3.75 | 10 | 0.00% | -14.77% |
| LXEH | Lixiang Education | | Consumer Staples | 0.41 | 35 | 2.00% | -62.30% |
| IH | iHuman | | Consumer Staples | 1.73 | 25 | 0.99% | -43.21% |
| SUZ | Suzano S.A | | Consumer Staples | 11.70 | 58 | 0.95% | 2.99% |
| ASAI | Sendas Distribuidora | | Consumer Staples | 12.92 | 32 | 3.36% | -6.34% |
| RLX | RLX | | Consumer Staples | 1.76 | 10 | -1.40% | -11.11% |
| NIO | NIO | | Consumer Staples | 3.87 | 42 | -3.38% | -57.39% |
| BRFS | BRF S.A | | Consumer Staples | 3.31 | 70 | 1.07% | 18.88% |
| KOF | Coca-Cola FEMSA | | Consumer Staples | 93.39 | 25 | 0.16% | -1.32% |
| BEST | BEST | | Consumer Staples | 2.09 | 25 | 0.48% | -18.09% |
| DDL | Dingdong (Cayman) | | Consumer Staples | 1.16 | 30 | 3.13% | -24.01% |
| NIU | Niu | | Consumer Staples | 2.00 | 56 | -1.48% | -8.68% |
| QSG | QuantaSing | | Consumer Staples | 3.43 | 35 | -0.44% | 111.73% |
| KNDI | Kandi | | Consumer Staples | 2.69 | 74 | 2.09% | -4.11% |
| TOUR | Tuniu | | Consumer Staples | 0.85 | 95 | 0.00% | 26.68% |
| For chart view version of above stock list: Chart View ➞ 0 - 25 | ||
 | Click To Change The Sort Order: By Market Cap or Company Size Performance: Year-to-date, Week and Day |  |
|
Get the most comprehensive stock market coverage daily at 12Stocks.com ➞ Best Stocks Today ➞ Best Stocks Weekly ➞ Best Stocks Year-to-Date ➞ Best Stocks Trends ➞  Best Stocks Today 12Stocks.com Best Nasdaq Stocks ➞ Best S&P 500 Stocks ➞ Best Tech Stocks ➞ Best Biotech Stocks ➞ |
| Detailed Overview of Emerging Markets Stocks |
| Emerging Markets Technical Overview, Leaders & Laggards, Top Emerging Markets ETF Funds & Detailed Emerging Markets Stocks List, Charts, Trends & More |
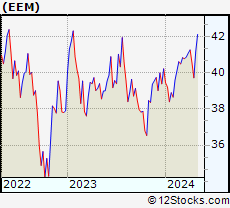
| Emerging Markets: Technical Analysis, Trends & YTD Performance | |
 EEM Weekly Chart |
|
| Long Term Trend: Very Good | |
| Medium Term Trend: Not Good | |
 EEM Daily Chart |
|
| Short Term Trend: Very Good | |
| Overall Trend Score: 44 | |
| YTD Performance: -1.02% | |
| **Trend Scores & Views Are Only For Educational Purposes And Not For Investing | |
| 12Stocks.com: Investing in Emerging Markets Index using Exchange Traded Funds | |
|
The following table shows list of key exchange traded funds (ETF) that
help investors play Emerging Markets stock market. For detailed view, check out our ETF Funds section of our website. Quick View: Move mouse or cursor over ETF symbol (ticker) to view short-term technical chart and over ETF name to view long term chart. Click on ticker or stock name for detailed view. Click on to add stock symbol to your watchlist and to view watchlist. |
12Stocks.com List of ETFs that track Emerging Markets Index
| Ticker | ETF Name | Watchlist | Recent Price | Smart Investing & Trading Score | Change % | Week % | Year-to-date % |
| EEM | Emerging Markets | | 39.80 | 44 | -0.18 | -1.8 | -1.02% |
| VWO | Emerging Markets | | 40.94 | 49 | -0.17 | -1.59 | -0.39% |
| EET | Emerging Markets | | 47.72 | 49 | -0.65 | -4.17 | -6.17% |
| EDC | Emrg Mkts Bull | | 27.16 | 41 | -1.09 | -5.96 | -10.75% |
| EUM | Short Emerging | | 14.48 | 62 | 0.42 | 2.08 | 2.33% |
| EMIF | Emerging Markets Infrastructure | | 21.38 | 51 | 0.14 | -1.85 | -0.09% |
| CEW | Emerging Currency Strat | | 17.57 | 21 | -0.13 | -0.68 | -2.44% |
| EMCB | Emerging Markets Corp | | 63.59 | 0 | -0.41 | -0.79 | -0.49% |
| EEMA | Emerging Markets Asia | | 66.09 | 49 | -0.40 | -1.85 | -0.03% |
| SDEM | SuperDividend Em Mkts | | 25.80 | 83 | 0.35 | 0.38 | 4.04% |
| DBEM | Em Mkts Hdgd | | 23.14 | 44 | -0.34 | -1.62 | 0.3% |
| 12Stocks.com: Charts, Trends, Fundamental Data and Performances of Emerging Markets Stocks | |
|
We now take in-depth look at all Emerging Markets stocks including charts, multi-period performances and overall trends (as measured by Smart Investing & Trading Score ). One can sort Emerging Markets stocks (click link to choose) by Daily, Weekly and by Year-to-Date performances. Also, one can sort by size of the company or by market capitalization. |
| Select Your Default Chart Type: | |||||
| |||||
| Click on stock symbol or name for detailed view. Click on to add stock symbol to your watchlist and to view watchlist. Quick View: Move mouse or cursor over "Daily" to quickly view daily technical stock chart and over "Weekly" to view weekly technical stock chart. | |||||

 | ABEV Ambev S.A. |
| Sector: Consumer Staples | |
| SubSector: Beverages - Brewers | |
| MarketCap: 37753.5 Millions | |
| Recent Price: 2.29 Smart Investing & Trading Score : 32 | |
| Day Percent Change: 0.66% Day Change: 0.02 | |
| Week Change: -2.34% Year-to-date Change: -18.0% | |
| ABEV Links: Profile News Message Board | |
| Charts:- Daily , Weekly | |
| Add ABEV to Watchlist: View: Get Complete ABEV Trend Analysis ➞ | |
 | VTRU Vitru Limited |
| Sector: Consumer Staples | |
| SubSector: Education & Training Services | |
| MarketCap: 33347 Millions | |
| Recent Price: 12.33 Smart Investing & Trading Score : 20 | |
| Day Percent Change: -0.76% Day Change: -0.10 | |
| Week Change: -11.93% Year-to-date Change: -22.1% | |
| VTRU Links: Profile News Message Board | |
| Charts:- Daily , Weekly | |
| Add VTRU to Watchlist: View: Get Complete VTRU Trend Analysis ➞ | |
 | YQ 17 Education & Technology Group Inc. |
| Sector: Consumer Staples | |
| SubSector: Education & Training Services | |
| MarketCap: 32347 Millions | |
| Recent Price: 2.46 Smart Investing & Trading Score : 58 | |
| Day Percent Change: 1.44% Day Change: 0.03 | |
| Week Change: -5.19% Year-to-date Change: 20.8% | |
| YQ Links: Profile News Message Board | |
| Charts:- Daily , Weekly | |
| Add YQ to Watchlist: View: Get Complete YQ Trend Analysis ➞ | |
 | EDTK Skillful Craftsman Education Technology Limited |
| Sector: Consumer Staples | |
| SubSector: Education & Training Services | |
| MarketCap: 32347 Millions | |
| Recent Price: 0.92 Smart Investing & Trading Score : 18 | |
| Day Percent Change: -0.54% Day Change: -0.01 | |
| Week Change: -0.54% Year-to-date Change: -27.4% | |
| EDTK Links: Profile News Message Board | |
| Charts:- Daily , Weekly | |
| Add EDTK to Watchlist: View: Get Complete EDTK Trend Analysis ➞ | |
 | CLEU China Liberal Education Holdings Limited |
| Sector: Consumer Staples | |
| SubSector: Education & Training Services | |
| MarketCap: 32347 Millions | |
| Recent Price: 1.03 Smart Investing & Trading Score : 49 | |
| Day Percent Change: 3.08% Day Change: 0.03 | |
| Week Change: 6.27% Year-to-date Change: 476.5% | |
| CLEU Links: Profile News Message Board | |
| Charts:- Daily , Weekly | |
| Add CLEU to Watchlist: View: Get Complete CLEU Trend Analysis ➞ | |
 | FMX Fomento Economico Mexicano, S.A.B. de C.V. |
| Sector: Consumer Staples | |
| SubSector: Beverages - Brewers | |
| MarketCap: 22018.7 Millions | |
| Recent Price: 119.69 Smart Investing & Trading Score : 25 | |
| Day Percent Change: 0.52% Day Change: 0.63 | |
| Week Change: -3.66% Year-to-date Change: -8.2% | |
| FMX Links: Profile News Message Board | |
| Charts:- Daily , Weekly | |
| Add FMX to Watchlist: View: Get Complete FMX Trend Analysis ➞ | |
 | VSTA Vasta Platform Limited |
| Sector: Consumer Staples | |
| SubSector: Education & Training Services | |
| MarketCap: 12747 Millions | |
| Recent Price: 3.75 Smart Investing & Trading Score : 10 | |
| Day Percent Change: 0.00% Day Change: 0.00 | |
| Week Change: -1.57% Year-to-date Change: -14.8% | |
| VSTA Links: Profile News Message Board | |
| Charts:- Daily , Weekly | |
| Add VSTA to Watchlist: View: Get Complete VSTA Trend Analysis ➞ | |
 | LXEH Lixiang Education Holding Co., Ltd. |
| Sector: Consumer Staples | |
| SubSector: Education & Training Services | |
| MarketCap: 12347 Millions | |
| Recent Price: 0.41 Smart Investing & Trading Score : 35 | |
| Day Percent Change: 2.00% Day Change: 0.01 | |
| Week Change: -6.62% Year-to-date Change: -62.3% | |
| LXEH Links: Profile News Message Board | |
| Charts:- Daily , Weekly | |
| Add LXEH to Watchlist: View: Get Complete LXEH Trend Analysis ➞ | |
 | IH iHuman Inc. |
| Sector: Consumer Staples | |
| SubSector: Education & Training Services | |
| MarketCap: 12247 Millions | |
| Recent Price: 1.73 Smart Investing & Trading Score : 25 | |
| Day Percent Change: 0.99% Day Change: 0.02 | |
| Week Change: -2.7% Year-to-date Change: -43.2% | |
| IH Links: Profile News Message Board | |
| Charts:- Daily , Weekly | |
| Add IH to Watchlist: View: Get Complete IH Trend Analysis ➞ | |
 | SUZ Suzano S.A. |
| Sector: Consumer Staples | |
| SubSector: Paper & Paper Products | |
| MarketCap: 7042.93 Millions | |
| Recent Price: 11.70 Smart Investing & Trading Score : 58 | |
| Day Percent Change: 0.95% Day Change: 0.11 | |
| Week Change: -1.68% Year-to-date Change: 3.0% | |
| SUZ Links: Profile News Message Board | |
| Charts:- Daily , Weekly | |
| Add SUZ to Watchlist: View: Get Complete SUZ Trend Analysis ➞ | |
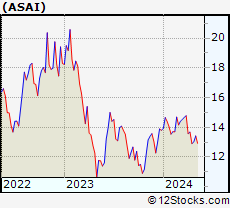 | ASAI Sendas Distribuidora S.A. |
| Sector: Consumer Staples | |
| SubSector: Grocery Stores | |
| MarketCap: 3790 Millions | |
| Recent Price: 12.92 Smart Investing & Trading Score : 32 | |
| Day Percent Change: 3.36% Day Change: 0.42 | |
| Week Change: -5.56% Year-to-date Change: -6.3% | |
| ASAI Links: Profile News Message Board | |
| Charts:- Daily , Weekly | |
| Add ASAI to Watchlist: View: Get Complete ASAI Trend Analysis ➞ | |
 | RLX RLX Technology Inc. |
| Sector: Consumer Staples | |
| SubSector: Tobacco | |
| MarketCap: 2800 Millions | |
| Recent Price: 1.76 Smart Investing & Trading Score : 10 | |
| Day Percent Change: -1.40% Day Change: -0.02 | |
| Week Change: 0% Year-to-date Change: -11.1% | |
| RLX Links: Profile News Message Board | |
| Charts:- Daily , Weekly | |
| Add RLX to Watchlist: View: Get Complete RLX Trend Analysis ➞ | |
 | NIO NIO Limited |
| Sector: Consumer Staples | |
| SubSector: Auto Manufacturers - Major | |
| MarketCap: 2679.71 Millions | |
| Recent Price: 3.87 Smart Investing & Trading Score : 42 | |
| Day Percent Change: -3.38% Day Change: -0.13 | |
| Week Change: -5.96% Year-to-date Change: -57.4% | |
| NIO Links: Profile News Message Board | |
| Charts:- Daily , Weekly | |
| Add NIO to Watchlist: View: Get Complete NIO Trend Analysis ➞ | |
 | BRFS BRF S.A. |
| Sector: Consumer Staples | |
| SubSector: Meat Products | |
| MarketCap: 2635.51 Millions | |
| Recent Price: 3.31 Smart Investing & Trading Score : 70 | |
| Day Percent Change: 1.07% Day Change: 0.04 | |
| Week Change: 3.61% Year-to-date Change: 18.9% | |
| BRFS Links: Profile News Message Board | |
| Charts:- Daily , Weekly | |
| Add BRFS to Watchlist: View: Get Complete BRFS Trend Analysis ➞ | |
 | KOF Coca-Cola FEMSA, S.A.B. de C.V. |
| Sector: Consumer Staples | |
| SubSector: Beverages - Soft Drinks | |
| MarketCap: 2258.9 Millions | |
| Recent Price: 93.39 Smart Investing & Trading Score : 25 | |
| Day Percent Change: 0.16% Day Change: 0.15 | |
| Week Change: -3.84% Year-to-date Change: -1.3% | |
| KOF Links: Profile News Message Board | |
| Charts:- Daily , Weekly | |
| Add KOF to Watchlist: View: Get Complete KOF Trend Analysis ➞ | |
 | BEST BEST Inc. |
| Sector: Consumer Staples | |
| SubSector: Packaging & Containers | |
| MarketCap: 1981.73 Millions | |
| Recent Price: 2.09 Smart Investing & Trading Score : 25 | |
| Day Percent Change: 0.48% Day Change: 0.01 | |
| Week Change: -0.48% Year-to-date Change: -18.1% | |
| BEST Links: Profile News Message Board | |
| Charts:- Daily , Weekly | |
| Add BEST to Watchlist: View: Get Complete BEST Trend Analysis ➞ | |
 | DDL Dingdong (Cayman) Limited |
| Sector: Consumer Staples | |
| SubSector: Grocery Stores | |
| MarketCap: 708 Millions | |
| Recent Price: 1.16 Smart Investing & Trading Score : 30 | |
| Day Percent Change: 3.13% Day Change: 0.03 | |
| Week Change: -4.55% Year-to-date Change: -24.0% | |
| DDL Links: Profile News Message Board | |
| Charts:- Daily , Weekly | |
| Add DDL to Watchlist: View: Get Complete DDL Trend Analysis ➞ | |
 | NIU Niu Technologies |
| Sector: Consumer Staples | |
| SubSector: Auto Manufacturers - Major | |
| MarketCap: 543.271 Millions | |
| Recent Price: 2.00 Smart Investing & Trading Score : 56 | |
| Day Percent Change: -1.48% Day Change: -0.03 | |
| Week Change: -9.09% Year-to-date Change: -8.7% | |
| NIU Links: Profile News Message Board | |
| Charts:- Daily , Weekly | |
| Add NIU to Watchlist: View: Get Complete NIU Trend Analysis ➞ | |
 | QSG QuantaSing Group Limited |
| Sector: Consumer Staples | |
| SubSector: Education & Training Services | |
| MarketCap: 433 Millions | |
| Recent Price: 3.43 Smart Investing & Trading Score : 35 | |
| Day Percent Change: -0.44% Day Change: -0.01 | |
| Week Change: 2.08% Year-to-date Change: 111.7% | |
| QSG Links: Profile News Message Board | |
| Charts:- Daily , Weekly | |
| Add QSG to Watchlist: View: Get Complete QSG Trend Analysis ➞ | |
 | KNDI Kandi Technologies Group, Inc. |
| Sector: Consumer Staples | |
| SubSector: Auto Manufacturers - Major | |
| MarketCap: 137.471 Millions | |
| Recent Price: 2.69 Smart Investing & Trading Score : 74 | |
| Day Percent Change: 2.09% Day Change: 0.06 | |
| Week Change: 28.47% Year-to-date Change: -4.1% | |
| KNDI Links: Profile News Message Board | |
| Charts:- Daily , Weekly | |
| Add KNDI to Watchlist: View: Get Complete KNDI Trend Analysis ➞ | |
 | TOUR Tuniu Corporation |
| Sector: Consumer Staples | |
| SubSector: Recreational Goods, Other | |
| MarketCap: 124.459 Millions | |
| Recent Price: 0.85 Smart Investing & Trading Score : 95 | |
| Day Percent Change: 0.00% Day Change: 0.00 | |
| Week Change: 8.99% Year-to-date Change: 26.7% | |
| TOUR Links: Profile News Message Board | |
| Charts:- Daily , Weekly | |
| Add TOUR to Watchlist: View: Get Complete TOUR Trend Analysis ➞ | |
| For tabular summary view of above stock list: Summary View ➞ 0 - 25 | ||
| Click To Change The Sort Order: By Market Cap or Company Size Performance: Year-to-date, Week and Day | |
| Select Chart Type: | ||
|
Best Stocks Today 12Stocks.com |
© 2024 12Stocks.com Terms & Conditions Privacy Contact Us
All Information Provided Only For Education And Not To Be Used For Investing or Trading. See Terms & Conditions


One More Thing ... Get Best Stocks Delivered Daily!
Never Ever Miss A Move With Our Top Ten Stocks Lists
Find Best Stocks In Any Market - Bull or Bear Market
Take A Peek At Our Top Ten Stocks Lists: Daily, Weekly, Year-to-Date & Top Trends
Find Best Stocks In Any Market - Bull or Bear Market
Take A Peek At Our Top Ten Stocks Lists: Daily, Weekly, Year-to-Date & Top Trends
Emerging Markets Stocks With Best Up Trends [0-bearish to 100-bullish]: HDFC Bank[93], Full Truck[93], Bright Scholar[90], DouYu [90], GDS [88], GigaCloud [88], Smart Share[86], Gold Fields[85], Lufax Holding[83], So-Young [83], DRDGOLD [81]
Best Emerging Markets Stocks Year-to-Date:
U Power[2818.53%], DouYu [746.84%], MicroCloud Hologram[664.03%], China Liberal[476.51%], Zhongchao [412.19%], Yatsen Holding[394.12%], Uxin [141.08%], QuantaSing [111.73%], GigaCloud [95.49%], Bright Scholar[68%], Cheetah Mobile[58.33%] Best Emerging Markets Stocks This Week:
Regencell Bioscience[37.01%], Yatsen Holding[20.1%], MingZhu Logistics[17.48%], Secoo Holding[15.24%], Bright Scholar[14.13%], Zhongchao [14.02%], Controladora Vuela[12.34%], Smart Share[9.26%], Quhuo [8.87%], EHang [7.46%], Momo [6.79%] Best Emerging Markets Stocks Daily:
Hywin [17.78%], Ambipar Emergency[13.26%], Bright Scholar[11.70%], MingZhu Logistics[10.31%], Fanhua [9.68%], Cheetah Mobile[7.12%], Lanvin [6.99%], Aesthetic Medical[6.77%], GreenTree Hospitality[4.56%], Inter & Co[4.34%], Fangdd Network[4.00%]