
 Login Sign Up


| |||||
 |  | ||||

| 12Stocks.com Market Intelligence |
Best LargeCap Emerging Markets Stocks
| In a hurry? Emerging Markets Stocks Lists: Trends Table, Stock Charts
Sort Emerging Markets stocks: Daily, Weekly, Year-to-Date, Market Cap & Trends. Filter Emerging Markets stocks list by sector: Show all, Tech, Finance, Energy, Staples, Retail, Industrial, Materials, Utilities and HealthCare Filter Emerging Markets stocks list by size:All Large Medium Small |
| 12Stocks.com Emerging Markets Stocks Performances & Trends Daily | |||||||||
|
|  The overall Smart Investing & Trading Score is 48 (0-bearish to 100-bullish) which puts Emerging Markets index in short term neutral trend. The Smart Investing & Trading Score from previous trading session is 38 and hence an improvement of trend.
| ||||||||
Here are the Smart Investing & Trading Scores of the most requested Emerging Markets stocks at 12Stocks.com (click stock name for detailed review):
|


| 12Stocks.com: Top Performing Emerging Markets Index Stocks | ||||||||||||||||||||||||||||||||||||||||||||||||
 The top performing Emerging Markets Index stocks year to date are
Now, more recently, over last week, the top performing Emerging Markets Index stocks on the move are


|
||||||||||||||||||||||||||||||||||||||||||||||||
| 12Stocks.com: Investing in Emerging Markets Index with Stocks | |
|
The following table helps investors and traders sort through current performance and trends (as measured by Smart Investing & Trading Score ) of various
stocks in the Emerging Markets Index. Quick View: Move mouse or cursor over stock symbol (ticker) to view short-term technical chart and over stock name to view long term chart. Click on  to add stock symbol to your watchlist and to add stock symbol to your watchlist and  to view watchlist. Click on any ticker or stock name for detailed market intelligence report for that stock. to view watchlist. Click on any ticker or stock name for detailed market intelligence report for that stock. |
12Stocks.com Performance of Stocks in Emerging Markets Index
| Ticker | Stock Name | Watchlist | Category | Recent Price | Smart Investing & Trading Score | Change % | YTD Change% |
| ZCMD | Zhongchao |   | Health Care | 3.38 | 100 | 146.72% | 825.77% |
| CLEU | China Liberal | | Consumer Staples | 1.00 | 22 | 1.01% | 459.28% |
| YSG | Yatsen Holding | | Services & Goods | 3.58 | 83 | -0.83% | 389.34% |
| LU | Lufax Holding | | Financials | 4.27 | 83 | 2.64% | 39.09% |
| TCOM | Trip.com | | Services & Goods | 48.72 | 63 | 0.95% | 35.30% |
| NU | Nu | | Financials | 10.91 | 49 | 1.11% | 30.82% |
| TME | Tencent Music | | Technology | 11.58 | 83 | 2.75% | 28.52% |
| TSM | Taiwan Semiconductor | | Technology | 132.27 | 36 | -4.86% | 27.18% |
| YQ | 17 Education | | Consumer Staples | 2.43 | 43 | 7.05% | 19.12% |
| EDU | New Oriental | | Services & Goods | 86.89 | 73 | 2.77% | 18.57% |
| HTHT | Huazhu | | Services & Goods | 37.36 | 36 | -1.01% | 11.72% |
| ASX | ASE | | Technology | 10.35 | 26 | -2.27% | 9.99% |
| IBN | ICICI Bank | | Financials | 25.43 | 44 | -0.78% | 6.67% |
| MNSO | MINISO | | Services & Goods | 20.88 | 76 | 1.56% | 2.35% |
| NTES | NetEase | | Technology | 92.50 | 25 | 2.85% | -0.71% |
| CHT | Chunghwa Telecom | | Technology | 38.16 | 43 | 0.42% | -2.33% |
| PBR | Petroleo Brasileiro | | Energy | 15.58 | 39 | -0.70% | -2.44% |
| AMX | America Movil | | Technology | 17.75 | 20 | -1.55% | -4.16% |
| IMAB | I Mab | | Health Care | 1.80 | 48 | -0.55% | -5.26% |
| ZTO | ZTO Express | | Transports | 20.00 | 68 | 3.57% | -6.02% |
| WIT | Wipro | | Technology | 5.16 | 0 | -1.71% | -7.36% |
| API | Agora | | Technology | 2.44 | 32 | 1.24% | -7.58% |
| TAL | TAL Education | | Services & Goods | 11.65 | 70 | 0.26% | -7.76% |
| FMX | Fomento Economico | | Consumer Staples | 119.07 | 17 | 0.11% | -8.65% |
| YGMZ | MingZhu Logistics | | Industrials | 0.43 | 74 | 9.54% | -9.84% |
| For chart view version of above stock list: Chart View ➞ 0 - 25 , 25 - 50 , 50 - 75 | ||
 | Click To Change The Sort Order: By Market Cap or Company Size Performance: Year-to-date, Week and Day |  |
|
Get the most comprehensive stock market coverage daily at 12Stocks.com ➞ Best Stocks Today ➞ Best Stocks Weekly ➞ Best Stocks Year-to-Date ➞ Best Stocks Trends ➞  Best Stocks Today 12Stocks.com Best Nasdaq Stocks ➞ Best S&P 500 Stocks ➞ Best Tech Stocks ➞ Best Biotech Stocks ➞ |
| Detailed Overview of Emerging Markets Stocks |
| Emerging Markets Technical Overview, Leaders & Laggards, Top Emerging Markets ETF Funds & Detailed Emerging Markets Stocks List, Charts, Trends & More |
| Emerging Markets: Technical Analysis, Trends & YTD Performance | |
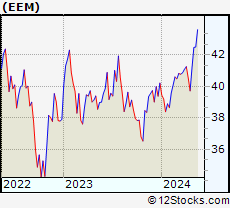
 EEM Weekly Chart |
|
| Long Term Trend: Very Good | |
| Medium Term Trend: Not Good | |
 EEM Daily Chart |
|
| Short Term Trend: Not Good | |
| Overall Trend Score: 48 | |
| YTD Performance: -0.85% | |
| **Trend Scores & Views Are Only For Educational Purposes And Not For Investing | |
| 12Stocks.com: Investing in Emerging Markets Index using Exchange Traded Funds | |
|
The following table shows list of key exchange traded funds (ETF) that
help investors play Emerging Markets stock market. For detailed view, check out our ETF Funds section of our website. Quick View: Move mouse or cursor over ETF symbol (ticker) to view short-term technical chart and over ETF name to view long term chart. Click on ticker or stock name for detailed view. Click on to add stock symbol to your watchlist and to view watchlist. |
12Stocks.com List of ETFs that track Emerging Markets Index
| Ticker | ETF Name | Watchlist | Recent Price | Smart Investing & Trading Score | Change % | Week % | Year-to-date % |
| EEM | Emerging Markets | | 39.87 | 48 | 0.40 | -1.63 | -0.85% |
| VWO | Emerging Markets | | 41.01 | 53 | 0.27 | -1.42 | -0.22% |
| SCHE | Emerging Markets Equity | | 24.78 | 53 | 0.32 | -1.39 | -0.04% |
| EWX | Emerging Markets Small | | 55.61 | 58 | 0.47 | -0.8 | -1.51% |
| EET | Emerging Markets | | 48.03 | 41 | 0.17 | -3.55 | -5.56% |
| EDC | Emrg Mkts Bull | | 27.46 | 48 | 1.25 | -4.92 | -9.76% |
| EEV | Short Emerging | | 20.37 | 62 | -0.92 | 3.19 | 3.28% |
| EUM | Short Emerging | | 14.42 | 62 | -0.55 | 1.65 | 1.91% |
| EDIV | Emerging Markets Dividend | | 32.90 | 51 | 0.58 | -0.12 | 1.17% |
| EMIF | Emerging Markets Infrastructure | | 21.35 | 26 | -0.05 | -1.99 | -0.23% |
| CEW | Emerging Currency Strat | | 17.59 | 21 | 0.04 | -0.55 | -2.32% |
| EBND | Em Mkts Lcl | | 19.86 | 18 | -0.15 | -1.05 | -6.5% |
| EMCB | Emerging Markets Corp | | 63.85 | 21 | -0.19 | -0.39 | -0.08% |
| VWOB | Emerging Mkts Govt | | 62.16 | 18 | -0.03 | -0.8 | -2.49% |
| EEMA | Emerging Markets Asia | | 66.36 | 48 | 0.69 | -1.46 | 0.37% |
| EELV | Em Mkts Low | | 23.21 | 17 | 0.43 | -1.3 | -3.45% |
| DVYE | Emerging Markets Dividend | | 26.28 | 46 | -0.11 | -0.68 | -0.79% |
| SDEM | SuperDividend Em Mkts | | 25.71 | 66 | 0.51 | 0.03 | 3.68% |
| DBEM | Em Mkts Hdgd | | 23.22 | 41 | 0.65 | -1.28 | 0.65% |
| PCY | Emerging Markets Sov | | 19.76 | 18 | -0.20 | -1.3 | -4.17% |
| QEMM | Emerging Mkts StratcFacts | | 56.18 | 36 | 0.23 | -1.23 | -1.71% |
| 12Stocks.com: Charts, Trends, Fundamental Data and Performances of Emerging Markets Stocks | |
|
We now take in-depth look at all Emerging Markets stocks including charts, multi-period performances and overall trends (as measured by Smart Investing & Trading Score ). One can sort Emerging Markets stocks (click link to choose) by Daily, Weekly and by Year-to-Date performances. Also, one can sort by size of the company or by market capitalization. |
| Select Your Default Chart Type: | |||||
| |||||
| Click on stock symbol or name for detailed view. Click on to add stock symbol to your watchlist and to view watchlist. Quick View: Move mouse or cursor over "Daily" to quickly view daily technical stock chart and over "Weekly" to view weekly technical stock chart. | |||||

 | ZCMD Zhongchao Inc. |
| Sector: Health Care | |
| SubSector: Health Information Services | |
| MarketCap: 41487 Millions | |
| Recent Price: 3.38 Smart Investing & Trading Score : 100 | |
| Day Percent Change: 146.72% Day Change: 2.01 | |
| Week Change: 106.1% Year-to-date Change: 825.8% | |
| ZCMD Links: Profile News Message Board | |
| Charts:- Daily , Weekly | |
| Add ZCMD to Watchlist: View: Get Complete ZCMD Trend Analysis ➞ | |
 | CLEU China Liberal Education Holdings Limited |
| Sector: Consumer Staples | |
| SubSector: Education & Training Services | |
| MarketCap: 32347 Millions | |
| Recent Price: 1.00 Smart Investing & Trading Score : 22 | |
| Day Percent Change: 1.01% Day Change: 0.01 | |
| Week Change: 3.09% Year-to-date Change: 459.3% | |
| CLEU Links: Profile News Message Board | |
| Charts:- Daily , Weekly | |
| Add CLEU to Watchlist: View: Get Complete CLEU Trend Analysis ➞ | |
 | YSG Yatsen Holding Limited |
| Sector: Services & Goods | |
| SubSector: Specialty Retail | |
| MarketCap: 11827 Millions | |
| Recent Price: 3.58 Smart Investing & Trading Score : 83 | |
| Day Percent Change: -0.83% Day Change: -0.03 | |
| Week Change: 18.94% Year-to-date Change: 389.3% | |
| YSG Links: Profile News Message Board | |
| Charts:- Daily , Weekly | |
| Add YSG to Watchlist: View: Get Complete YSG Trend Analysis ➞ | |
 | LU Lufax Holding Ltd |
| Sector: Financials | |
| SubSector: Credit Services | |
| MarketCap: 33457 Millions | |
| Recent Price: 4.27 Smart Investing & Trading Score : 83 | |
| Day Percent Change: 2.64% Day Change: 0.11 | |
| Week Change: 3.14% Year-to-date Change: 39.1% | |
| LU Links: Profile News Message Board | |
| Charts:- Daily , Weekly | |
| Add LU to Watchlist: View: Get Complete LU Trend Analysis ➞ | |
 | TCOM Trip.com Group Limited |
| Sector: Services & Goods | |
| SubSector: Lodging | |
| MarketCap: 13449.6 Millions | |
| Recent Price: 48.72 Smart Investing & Trading Score : 63 | |
| Day Percent Change: 0.95% Day Change: 0.46 | |
| Week Change: -0.27% Year-to-date Change: 35.3% | |
| TCOM Links: Profile News Message Board | |
| Charts:- Daily , Weekly | |
| Add TCOM to Watchlist: View: Get Complete TCOM Trend Analysis ➞ | |
 | NU Nu Holdings Ltd. |
| Sector: Financials | |
| SubSector: Banks - Diversified | |
| MarketCap: 37240 Millions | |
| Recent Price: 10.91 Smart Investing & Trading Score : 49 | |
| Day Percent Change: 1.11% Day Change: 0.12 | |
| Week Change: -3.37% Year-to-date Change: 30.8% | |
| NU Links: Profile News Message Board | |
| Charts:- Daily , Weekly | |
| Add NU to Watchlist: View: Get Complete NU Trend Analysis ➞ | |
 | TME Tencent Music Entertainment Group |
| Sector: Technology | |
| SubSector: Internet Information Providers | |
| MarketCap: 16195 Millions | |
| Recent Price: 11.58 Smart Investing & Trading Score : 83 | |
| Day Percent Change: 2.75% Day Change: 0.31 | |
| Week Change: 1.85% Year-to-date Change: 28.5% | |
| TME Links: Profile News Message Board | |
| Charts:- Daily , Weekly | |
| Add TME to Watchlist: View: Get Complete TME Trend Analysis ➞ | |
 | TSM Taiwan Semiconductor Manufacturing Company Limited |
| Sector: Technology | |
| SubSector: Semiconductor - Integrated Circuits | |
| MarketCap: 239384 Millions | |
| Recent Price: 132.27 Smart Investing & Trading Score : 36 | |
| Day Percent Change: -4.86% Day Change: -6.76 | |
| Week Change: -7.19% Year-to-date Change: 27.2% | |
| TSM Links: Profile News Message Board | |
| Charts:- Daily , Weekly | |
| Add TSM to Watchlist: View: Get Complete TSM Trend Analysis ➞ | |
 | YQ 17 Education & Technology Group Inc. |
| Sector: Consumer Staples | |
| SubSector: Education & Training Services | |
| MarketCap: 32347 Millions | |
| Recent Price: 2.43 Smart Investing & Trading Score : 43 | |
| Day Percent Change: 7.05% Day Change: 0.16 | |
| Week Change: -6.54% Year-to-date Change: 19.1% | |
| YQ Links: Profile News Message Board | |
| Charts:- Daily , Weekly | |
| Add YQ to Watchlist: View: Get Complete YQ Trend Analysis ➞ | |
 | EDU New Oriental Education & Technology Group Inc. |
| Sector: Services & Goods | |
| SubSector: Education & Training Services | |
| MarketCap: 18673.7 Millions | |
| Recent Price: 86.89 Smart Investing & Trading Score : 73 | |
| Day Percent Change: 2.77% Day Change: 2.34 | |
| Week Change: 0.38% Year-to-date Change: 18.6% | |
| EDU Links: Profile News Message Board | |
| Charts:- Daily , Weekly | |
| Add EDU to Watchlist: View: Get Complete EDU Trend Analysis ➞ | |
 | HTHT Huazhu Group Limited |
| Sector: Services & Goods | |
| SubSector: Lodging | |
| MarketCap: 9164.46 Millions | |
| Recent Price: 37.36 Smart Investing & Trading Score : 36 | |
| Day Percent Change: -1.01% Day Change: -0.38 | |
| Week Change: -0.32% Year-to-date Change: 11.7% | |
| HTHT Links: Profile News Message Board | |
| Charts:- Daily , Weekly | |
| Add HTHT to Watchlist: View: Get Complete HTHT Trend Analysis ➞ | |
 | ASX ASE Technology Holding Co., Ltd. |
| Sector: Technology | |
| SubSector: Semiconductor Equipment & Materials | |
| MarketCap: 8513.18 Millions | |
| Recent Price: 10.35 Smart Investing & Trading Score : 26 | |
| Day Percent Change: -2.27% Day Change: -0.24 | |
| Week Change: -4.61% Year-to-date Change: 10.0% | |
| ASX Links: Profile News Message Board | |
| Charts:- Daily , Weekly | |
| Add ASX to Watchlist: View: Get Complete ASX Trend Analysis ➞ | |
 | IBN ICICI Bank Limited |
| Sector: Financials | |
| SubSector: Money Center Banks | |
| MarketCap: 31194.1 Millions | |
| Recent Price: 25.43 Smart Investing & Trading Score : 44 | |
| Day Percent Change: -0.78% Day Change: -0.20 | |
| Week Change: -2.72% Year-to-date Change: 6.7% | |
| IBN Links: Profile News Message Board | |
| Charts:- Daily , Weekly | |
| Add IBN to Watchlist: View: Get Complete IBN Trend Analysis ➞ | |
 | MNSO MINISO Group Holding Limited |
| Sector: Services & Goods | |
| SubSector: Specialty Retail | |
| MarketCap: 69427 Millions | |
| Recent Price: 20.88 Smart Investing & Trading Score : 76 | |
| Day Percent Change: 1.56% Day Change: 0.32 | |
| Week Change: -1.37% Year-to-date Change: 2.4% | |
| MNSO Links: Profile News Message Board | |
| Charts:- Daily , Weekly | |
| Add MNSO to Watchlist: View: Get Complete MNSO Trend Analysis ➞ | |
 | NTES NetEase, Inc. |
| Sector: Technology | |
| SubSector: Internet Software & Services | |
| MarketCap: 40105.1 Millions | |
| Recent Price: 92.50 Smart Investing & Trading Score : 25 | |
| Day Percent Change: 2.85% Day Change: 2.56 | |
| Week Change: 0.38% Year-to-date Change: -0.7% | |
| NTES Links: Profile News Message Board | |
| Charts:- Daily , Weekly | |
| Add NTES to Watchlist: View: Get Complete NTES Trend Analysis ➞ | |
 | CHT Chunghwa Telecom Co., Ltd. |
| Sector: Technology | |
| SubSector: Telecom Services - Domestic | |
| MarketCap: 28101.3 Millions | |
| Recent Price: 38.16 Smart Investing & Trading Score : 43 | |
| Day Percent Change: 0.42% Day Change: 0.16 | |
| Week Change: -0.88% Year-to-date Change: -2.3% | |
| CHT Links: Profile News Message Board | |
| Charts:- Daily , Weekly | |
| Add CHT to Watchlist: View: Get Complete CHT Trend Analysis ➞ | |
 | PBR Petroleo Brasileiro S.A. - Petrobras |
| Sector: Energy | |
| SubSector: Oil & Gas Drilling & Exploration | |
| MarketCap: 38939.2 Millions | |
| Recent Price: 15.58 Smart Investing & Trading Score : 39 | |
| Day Percent Change: -0.70% Day Change: -0.11 | |
| Week Change: -0.89% Year-to-date Change: -2.4% | |
| PBR Links: Profile News Message Board | |
| Charts:- Daily , Weekly | |
| Add PBR to Watchlist: View: Get Complete PBR Trend Analysis ➞ | |
 | AMX America Movil, S.A.B. de C.V. |
| Sector: Technology | |
| SubSector: Wireless Communications | |
| MarketCap: 44726.6 Millions | |
| Recent Price: 17.75 Smart Investing & Trading Score : 20 | |
| Day Percent Change: -1.55% Day Change: -0.28 | |
| Week Change: -1.66% Year-to-date Change: -4.2% | |
| AMX Links: Profile News Message Board | |
| Charts:- Daily , Weekly | |
| Add AMX to Watchlist: View: Get Complete AMX Trend Analysis ➞ | |
 | IMAB I Mab |
| Sector: Health Care | |
| SubSector: Biotechnology | |
| MarketCap: 26187 Millions | |
| Recent Price: 1.80 Smart Investing & Trading Score : 48 | |
| Day Percent Change: -0.55% Day Change: -0.01 | |
| Week Change: -0.55% Year-to-date Change: -5.3% | |
| IMAB Links: Profile News Message Board | |
| Charts:- Daily , Weekly | |
| Add IMAB to Watchlist: View: Get Complete IMAB Trend Analysis ➞ | |
 | ZTO ZTO Express (Cayman) Inc. |
| Sector: Transports | |
| SubSector: Air Delivery & Freight Services | |
| MarketCap: 20507 Millions | |
| Recent Price: 20.00 Smart Investing & Trading Score : 68 | |
| Day Percent Change: 3.57% Day Change: 0.69 | |
| Week Change: 3.84% Year-to-date Change: -6.0% | |
| ZTO Links: Profile News Message Board | |
| Charts:- Daily , Weekly | |
| Add ZTO to Watchlist: View: Get Complete ZTO Trend Analysis ➞ | |
 | WIT Wipro Limited |
| Sector: Technology | |
| SubSector: Information Technology Services | |
| MarketCap: 15101.3 Millions | |
| Recent Price: 5.16 Smart Investing & Trading Score : 0 | |
| Day Percent Change: -1.71% Day Change: -0.09 | |
| Week Change: -5.49% Year-to-date Change: -7.4% | |
| WIT Links: Profile News Message Board | |
| Charts:- Daily , Weekly | |
| Add WIT to Watchlist: View: Get Complete WIT Trend Analysis ➞ | |
 | API Agora, Inc. |
| Sector: Technology | |
| SubSector: Software Application | |
| MarketCap: 42787 Millions | |
| Recent Price: 2.44 Smart Investing & Trading Score : 32 | |
| Day Percent Change: 1.24% Day Change: 0.03 | |
| Week Change: 0% Year-to-date Change: -7.6% | |
| API Links: Profile News Message Board | |
| Charts:- Daily , Weekly | |
| Add API to Watchlist: View: Get Complete API Trend Analysis ➞ | |
 | TAL TAL Education Group |
| Sector: Services & Goods | |
| SubSector: Education & Training Services | |
| MarketCap: 30103.1 Millions | |
| Recent Price: 11.65 Smart Investing & Trading Score : 70 | |
| Day Percent Change: 0.26% Day Change: 0.03 | |
| Week Change: -0.43% Year-to-date Change: -7.8% | |
| TAL Links: Profile News Message Board | |
| Charts:- Daily , Weekly | |
| Add TAL to Watchlist: View: Get Complete TAL Trend Analysis ➞ | |
 | FMX Fomento Economico Mexicano, S.A.B. de C.V. |
| Sector: Consumer Staples | |
| SubSector: Beverages - Brewers | |
| MarketCap: 22018.7 Millions | |
| Recent Price: 119.07 Smart Investing & Trading Score : 17 | |
| Day Percent Change: 0.11% Day Change: 0.13 | |
| Week Change: -4.16% Year-to-date Change: -8.7% | |
| FMX Links: Profile News Message Board | |
| Charts:- Daily , Weekly | |
| Add FMX to Watchlist: View: Get Complete FMX Trend Analysis ➞ | |
 | YGMZ MingZhu Logistics Holdings Limited |
| Sector: Industrials | |
| SubSector: Trucking | |
| MarketCap: 41627 Millions | |
| Recent Price: 0.43 Smart Investing & Trading Score : 74 | |
| Day Percent Change: 9.54% Day Change: 0.04 | |
| Week Change: 6.5% Year-to-date Change: -9.8% | |
| YGMZ Links: Profile News Message Board | |
| Charts:- Daily , Weekly | |
| Add YGMZ to Watchlist: View: Get Complete YGMZ Trend Analysis ➞ | |
| For tabular summary view of above stock list: Summary View ➞ 0 - 25 , 25 - 50 , 50 - 75 | ||
| Click To Change The Sort Order: By Market Cap or Company Size Performance: Year-to-date, Week and Day | |
| Select Chart Type: | ||
|
Best Stocks Today 12Stocks.com |
© 2024 12Stocks.com Terms & Conditions Privacy Contact Us
All Information Provided Only For Education And Not To Be Used For Investing or Trading. See Terms & Conditions


One More Thing ... Get Best Stocks Delivered Daily!
Never Ever Miss A Move With Our Top Ten Stocks Lists
Find Best Stocks In Any Market - Bull or Bear Market
Take A Peek At Our Top Ten Stocks Lists: Daily, Weekly, Year-to-Date & Top Trends
Find Best Stocks In Any Market - Bull or Bear Market
Take A Peek At Our Top Ten Stocks Lists: Daily, Weekly, Year-to-Date & Top Trends
Emerging Markets Stocks With Best Up Trends [0-bearish to 100-bullish]: Zhongchao [100], GigaCloud [100], Smart Share[93], HDFC Bank[93], DouYu [90], So-Young [88], GDS [88], JOYY [88], Gold Fields[85], U Power[83], Tencent Music[83]
Best Emerging Markets Stocks Year-to-Date:
U Power[2874.33%], Zhongchao [825.77%], DouYu [745.26%], MicroCloud Hologram[734.53%], China Liberal[459.28%], Yatsen Holding[389.34%], Uxin [136.8%], QuantaSing [112.65%], GigaCloud [100.82%], Yiren Digital[55.45%], Bright Scholar[50.4%] Best Emerging Markets Stocks This Week:
Zhongchao [106.1%], Regencell Bioscience[37.01%], Yatsen Holding[18.94%], TH [18.18%], Secoo Holding[11.83%], Controladora Vuela[11.35%], Smart Share[9.93%], GigaCloud [8.8%], EHang [8.29%], Momo [7.17%], SunCar [7%] Best Emerging Markets Stocks Daily:
Zhongchao [146.72%], MicroCloud Hologram[30.04%], TH [25.00%], Golden Heaven[21.20%], Regencell Bioscience[10.20%], MingZhu Logistics[9.54%], Secoo Holding[9.32%], Cheetah Mobile[9.06%], Quhuo [8.36%], U Power[8.11%], 17 Education[7.05%]