
 Login Sign Up


| |||||
 |  | ||||

| 12Stocks.com Market Intelligence |
Best SmallCap Emerging Markets Stocks
| In a hurry? Emerging Markets Stocks Lists: Trends Table, Stock Charts
Sort Emerging Markets stocks: Daily, Weekly, Year-to-Date, Market Cap & Trends. Filter Emerging Markets stocks list by sector: Show all, Tech, Finance, Energy, Staples, Retail, Industrial, Materials, Utilities and HealthCare Filter Emerging Markets stocks list by size:All Large Medium Small |
| 12Stocks.com Emerging Markets Stocks Performances & Trends Daily | |||||||||
|
|  The overall Smart Investing & Trading Score is 49 (0-bearish to 100-bullish) which puts Emerging Markets index in short term neutral trend. The Smart Investing & Trading Score from previous trading session is 48 and hence an improvement of trend.
| ||||||||
Here are the Smart Investing & Trading Scores of the most requested Emerging Markets stocks at 12Stocks.com (click stock name for detailed review):
|


| 12Stocks.com: Top Performing Emerging Markets Index Stocks | ||||||||||||||||||||||||||||||||||||||||||||||||
 The top performing Emerging Markets Index stocks year to date are
Now, more recently, over last week, the top performing Emerging Markets Index stocks on the move are


|
||||||||||||||||||||||||||||||||||||||||||||||||
| 12Stocks.com: Investing in Emerging Markets Index with Stocks | |
|
The following table helps investors and traders sort through current performance and trends (as measured by Smart Investing & Trading Score ) of various
stocks in the Emerging Markets Index. Quick View: Move mouse or cursor over stock symbol (ticker) to view short-term technical chart and over stock name to view long term chart. Click on  to add stock symbol to your watchlist and to add stock symbol to your watchlist and  to view watchlist. Click on any ticker or stock name for detailed market intelligence report for that stock. to view watchlist. Click on any ticker or stock name for detailed market intelligence report for that stock. |
12Stocks.com Performance of Stocks in Emerging Markets Index
| Ticker | Stock Name | Watchlist | Category | Recent Price | Smart Investing & Trading Score | Change % | YTD Change% |
| LANV | Lanvin |   | Services & Goods | 1.59 | 59 | 11.19 | -48.04% |
| BEDU | Bright Scholar | | Services & Goods | 2.01 | 85 | 6.91 | 60.80% |
| RGC | Regencell Bioscience | | Health Care | 5.55 | 24 | 6.32 | -47.14% |
| AMBI | Ambipar Emergency | | Industrials | 4.88 | 42 | 6.09 | -37.91% |
| MOGU | MOGU | | Services & Goods | 1.99 | 83 | 5.85 | 4.19% |
| CMCM | Cheetah Mobile | | Technology | 3.54 | 51 | 5.04 | 55.26% |
| SECO | Secoo Holding | | Services & Goods | 0.42 | 49 | 4.75 | -25.84% |
| LND | BrasilAgro - | | Financials | 5.01 | 67 | 4.38 | -5.11% |
| DDL | Dingdong (Cayman) | | Consumer Staples | 1.15 | 30 | 2.68 | -24.34% |
| SFWL | Shengfeng Development | | Industrials | 1.63 | 43 | 2.52 | -40.73% |
| ICG | Intchains | | Technology | 8.30 | 49 | 2.47 | -32.52% |
| YI | 111 | | Services & Goods | 1.02 | 32 | 2.00 | -34.19% |
| STG | Sunlands | | Services & Goods | 8.16 | 10 | 1.94 | -19.71% |
| UXIN | Uxin | | Technology | 1.69 | 32 | 1.81 | 141.08% |
| RC | Ready Capital | | Financials | 8.62 | 52 | 1.77 | -15.90% |
| JFIN | Jiayin | | Technology | 6.45 | 58 | 1.49 | 24.52% |
| CANG | Cango | | Technology | 1.40 | 56 | 1.45 | 37.25% |
| QD | Qudian | | Technology | 2.28 | 43 | 1.33 | 11.76% |
| TOP | TOP Financial | | Financials | 2.35 | 42 | 1.29 | -36.83% |
| VINP | Vi Partners | | Financials | 10.25 | 17 | 0.99 | -6.73% |
| HOLI | Hollysys Automation | | Industrials | 24.55 | 31 | 0.99 | -6.83% |
| DRD | DRDGOLD | | Materials | 8.55 | 81 | 0.83 | 7.55% |
| LVRO | Lavoro | | Materials | 5.88 | 42 | 0.60 | -33.78% |
| SOHU | Sohu.com | | Technology | 10.97 | 66 | 0.55 | 10.47% |
| XNET | Xunlei | | Technology | 1.48 | 20 | 0.34 | -8.64% |
| For chart view version of above stock list: Chart View ➞ 0 - 25 , 25 - 50 , 50 - 75 | ||
 | Click To Change The Sort Order: By Market Cap or Company Size Performance: Year-to-date, Week and Day |  |
|
Get the most comprehensive stock market coverage daily at 12Stocks.com ➞ Best Stocks Today ➞ Best Stocks Weekly ➞ Best Stocks Year-to-Date ➞ Best Stocks Trends ➞  Best Stocks Today 12Stocks.com Best Nasdaq Stocks ➞ Best S&P 500 Stocks ➞ Best Tech Stocks ➞ Best Biotech Stocks ➞ |
| Detailed Overview of Emerging Markets Stocks |
| Emerging Markets Technical Overview, Leaders & Laggards, Top Emerging Markets ETF Funds & Detailed Emerging Markets Stocks List, Charts, Trends & More |
| Emerging Markets: Technical Analysis, Trends & YTD Performance | |
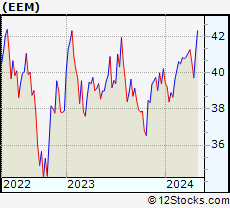
 EEM Weekly Chart |
|
| Long Term Trend: Good | |
| Medium Term Trend: Not Good | |
 EEM Daily Chart |
|
| Short Term Trend: Not Good | |
| Overall Trend Score: 49 | |
| YTD Performance: -1.24% | |
| **Trend Scores & Views Are Only For Educational Purposes And Not For Investing | |
| 12Stocks.com: Investing in Emerging Markets Index using Exchange Traded Funds | |
|
The following table shows list of key exchange traded funds (ETF) that
help investors play Emerging Markets stock market. For detailed view, check out our ETF Funds section of our website. Quick View: Move mouse or cursor over ETF symbol (ticker) to view short-term technical chart and over ETF name to view long term chart. Click on ticker or stock name for detailed view. Click on to add stock symbol to your watchlist and to view watchlist. |
12Stocks.com List of ETFs that track Emerging Markets Index
| Ticker | ETF Name | Watchlist | Recent Price | Smart Investing & Trading Score | Change % | Week % | Year-to-date % |
| EEM | Emerging Markets | | 39.71 | 49 | -0.40 | -2.02 | -1.24% |
| VWO | Emerging Markets | | 40.89 | 49 | -0.29 | -1.71 | -0.51% |
| SCHE | Emerging Markets Equity | | 24.69 | 41 | -0.36 | -1.75 | -0.4% |
| EWX | Emerging Markets Small | | 55.17 | 41 | -0.79 | -1.59 | -2.28% |
| EET | Emerging Markets | | 47.72 | 49 | -0.65 | -4.18 | -6.18% |
| EDC | Emrg Mkts Bull | | 27.07 | 49 | -1.42 | -6.27 | -11.04% |
| EEV | Short Emerging | | 20.52 | 62 | 0.73 | 3.94 | 4.03% |
| EUM | Short Emerging | | 14.49 | 62 | 0.50 | 2.16 | 2.42% |
| EDIV | Emerging Markets Dividend | | 33.01 | 51 | 0.33 | 0.21 | 1.51% |
| EMIF | Emerging Markets Infrastructure | | 21.38 | 51 | 0.14 | -1.85 | -0.09% |
| CEW | Emerging Currency Strat | | 17.61 | 38 | 0.10 | -0.45 | -2.22% |
| EBND | Em Mkts Lcl | | 19.93 | 32 | 0.35 | -0.7 | -6.17% |
| EMCB | Emerging Markets Corp | | 63.59 | 0 | -0.41 | -0.79 | -0.49% |
| VWOB | Emerging Mkts Govt | | 62.33 | 32 | 0.27 | -0.53 | -2.23% |
| EEMA | Emerging Markets Asia | | 66.09 | 49 | -0.40 | -1.85 | -0.03% |
| EELV | Em Mkts Low | | 23.16 | 18 | -0.22 | -1.51 | -3.66% |
| DVYE | Emerging Markets Dividend | | 26.48 | 88 | 0.76 | 0.08 | -0.04% |
| SDEM | SuperDividend Em Mkts | | 25.86 | 83 | 0.58 | 0.61 | 4.29% |
| DBEM | Em Mkts Hdgd | | 23.10 | 49 | -0.52 | -1.79 | 0.13% |
| PCY | Emerging Markets Sov | | 19.81 | 32 | 0.25 | -1.05 | -3.93% |
| QEMM | Emerging Mkts StratcFacts | | 56.16 | 44 | -0.04 | -1.27 | -1.74% |
| 12Stocks.com: Charts, Trends, Fundamental Data and Performances of Emerging Markets Stocks | |
|
We now take in-depth look at all Emerging Markets stocks including charts, multi-period performances and overall trends (as measured by Smart Investing & Trading Score ). One can sort Emerging Markets stocks (click link to choose) by Daily, Weekly and by Year-to-Date performances. Also, one can sort by size of the company or by market capitalization. |
| Select Your Default Chart Type: | |||||
| |||||
| Click on stock symbol or name for detailed view. Click on to add stock symbol to your watchlist and to view watchlist. Quick View: Move mouse or cursor over "Daily" to quickly view daily technical stock chart and over "Weekly" to view weekly technical stock chart. | |||||

 | LANV Lanvin Group Holdings Limited |
| Sector: Services & Goods | |
| SubSector: Luxury Goods | |
| MarketCap: 712 Millions | |
| Recent Price: 1.59 Smart Investing & Trading Score : 59 | |
| Day Percent Change: 11.19% Day Change: 0.16 | |
| Week Change: -0.63% Year-to-date Change: -48.0% | |
| LANV Links: Profile News Message Board | |
| Charts:- Daily , Weekly | |
| Add LANV to Watchlist: View: Get Complete LANV Trend Analysis ➞ | |
 | BEDU Bright Scholar Education Holdings Limited |
| Sector: Services & Goods | |
| SubSector: Education & Training Services | |
| MarketCap: 792.406 Millions | |
| Recent Price: 2.01 Smart Investing & Trading Score : 85 | |
| Day Percent Change: 6.91% Day Change: 0.13 | |
| Week Change: 9.24% Year-to-date Change: 60.8% | |
| BEDU Links: Profile News Message Board | |
| Charts:- Daily , Weekly | |
| Add BEDU to Watchlist: View: Get Complete BEDU Trend Analysis ➞ | |
 | RGC Regencell Bioscience Holdings Limited |
| Sector: Health Care | |
| SubSector: Drug Manufacturers - Specialty & Generic | |
| MarketCap: 284 Millions | |
| Recent Price: 5.55 Smart Investing & Trading Score : 24 | |
| Day Percent Change: 6.32% Day Change: 0.33 | |
| Week Change: 45.67% Year-to-date Change: -47.1% | |
| RGC Links: Profile News Message Board | |
| Charts:- Daily , Weekly | |
| Add RGC to Watchlist: View: Get Complete RGC Trend Analysis ➞ | |
 | AMBI Ambipar Emergency Response |
| Sector: Industrials | |
| SubSector: Waste Management | |
| MarketCap: 462 Millions | |
| Recent Price: 4.88 Smart Investing & Trading Score : 42 | |
| Day Percent Change: 6.09% Day Change: 0.28 | |
| Week Change: -3.94% Year-to-date Change: -37.9% | |
| AMBI Links: Profile News Message Board | |
| Charts:- Daily , Weekly | |
| Add AMBI to Watchlist: View: Get Complete AMBI Trend Analysis ➞ | |
 | MOGU MOGU Inc. |
| Sector: Services & Goods | |
| SubSector: Specialty Retail, Other | |
| MarketCap: 168.844 Millions | |
| Recent Price: 1.99 Smart Investing & Trading Score : 83 | |
| Day Percent Change: 5.85% Day Change: 0.11 | |
| Week Change: 1.02% Year-to-date Change: 4.2% | |
| MOGU Links: Profile News Message Board | |
| Charts:- Daily , Weekly | |
| Add MOGU to Watchlist: View: Get Complete MOGU Trend Analysis ➞ | |
 | CMCM Cheetah Mobile Inc. |
| Sector: Technology | |
| SubSector: Application Software | |
| MarketCap: 343.362 Millions | |
| Recent Price: 3.54 Smart Investing & Trading Score : 51 | |
| Day Percent Change: 5.04% Day Change: 0.17 | |
| Week Change: -23.21% Year-to-date Change: 55.3% | |
| CMCM Links: Profile News Message Board | |
| Charts:- Daily , Weekly | |
| Add CMCM to Watchlist: View: Get Complete CMCM Trend Analysis ➞ | |
 | SECO Secoo Holding Limited |
| Sector: Services & Goods | |
| SubSector: Specialty Retail, Other | |
| MarketCap: 209.144 Millions | |
| Recent Price: 0.42 Smart Investing & Trading Score : 49 | |
| Day Percent Change: 4.75% Day Change: 0.02 | |
| Week Change: 17.14% Year-to-date Change: -25.8% | |
| SECO Links: Profile News Message Board | |
| Charts:- Daily , Weekly | |
| Add SECO to Watchlist: View: Get Complete SECO Trend Analysis ➞ | |
 | LND BrasilAgro - Companhia Brasileira de Propriedades Agricolas |
| Sector: Financials | |
| SubSector: Property Management | |
| MarketCap: 157.842 Millions | |
| Recent Price: 5.01 Smart Investing & Trading Score : 67 | |
| Day Percent Change: 4.38% Day Change: 0.21 | |
| Week Change: 4.16% Year-to-date Change: -5.1% | |
| LND Links: Profile News Message Board | |
| Charts:- Daily , Weekly | |
| Add LND to Watchlist: View: Get Complete LND Trend Analysis ➞ | |
 | DDL Dingdong (Cayman) Limited |
| Sector: Consumer Staples | |
| SubSector: Grocery Stores | |
| MarketCap: 708 Millions | |
| Recent Price: 1.15 Smart Investing & Trading Score : 30 | |
| Day Percent Change: 2.68% Day Change: 0.03 | |
| Week Change: -4.96% Year-to-date Change: -24.3% | |
| DDL Links: Profile News Message Board | |
| Charts:- Daily , Weekly | |
| Add DDL to Watchlist: View: Get Complete DDL Trend Analysis ➞ | |
 | SFWL Shengfeng Development Limited |
| Sector: Industrials | |
| SubSector: Integrated Freight & Logistics | |
| MarketCap: 747 Millions | |
| Recent Price: 1.63 Smart Investing & Trading Score : 43 | |
| Day Percent Change: 2.52% Day Change: 0.04 | |
| Week Change: -9.44% Year-to-date Change: -40.7% | |
| SFWL Links: Profile News Message Board | |
| Charts:- Daily , Weekly | |
| Add SFWL to Watchlist: View: Get Complete SFWL Trend Analysis ➞ | |
 | ICG Intchains Group Limited |
| Sector: Technology | |
| SubSector: Semiconductors | |
| MarketCap: 450 Millions | |
| Recent Price: 8.30 Smart Investing & Trading Score : 49 | |
| Day Percent Change: 2.47% Day Change: 0.20 | |
| Week Change: 0.61% Year-to-date Change: -32.5% | |
| ICG Links: Profile News Message Board | |
| Charts:- Daily , Weekly | |
| Add ICG to Watchlist: View: Get Complete ICG Trend Analysis ➞ | |
 | YI 111, Inc. |
| Sector: Services & Goods | |
| SubSector: Drug Stores | |
| MarketCap: 520.351 Millions | |
| Recent Price: 1.02 Smart Investing & Trading Score : 32 | |
| Day Percent Change: 2.00% Day Change: 0.02 | |
| Week Change: -7.27% Year-to-date Change: -34.2% | |
| YI Links: Profile News Message Board | |
| Charts:- Daily , Weekly | |
| Add YI to Watchlist: View: Get Complete YI Trend Analysis ➞ | |
 | STG Sunlands Technology Group |
| Sector: Services & Goods | |
| SubSector: Education & Training Services | |
| MarketCap: 295.706 Millions | |
| Recent Price: 8.16 Smart Investing & Trading Score : 10 | |
| Day Percent Change: 1.94% Day Change: 0.15 | |
| Week Change: -7.02% Year-to-date Change: -19.7% | |
| STG Links: Profile News Message Board | |
| Charts:- Daily , Weekly | |
| Add STG to Watchlist: View: Get Complete STG Trend Analysis ➞ | |
 | UXIN Uxin Limited |
| Sector: Technology | |
| SubSector: Internet Information Providers | |
| MarketCap: 414.58 Millions | |
| Recent Price: 1.69 Smart Investing & Trading Score : 32 | |
| Day Percent Change: 1.81% Day Change: 0.03 | |
| Week Change: -9.63% Year-to-date Change: 141.1% | |
| UXIN Links: Profile News Message Board | |
| Charts:- Daily , Weekly | |
| Add UXIN to Watchlist: View: Get Complete UXIN Trend Analysis ➞ | |
 | RC Ready Capital Corporation |
| Sector: Financials | |
| SubSector: Mortgage Investment | |
| MarketCap: 358.039 Millions | |
| Recent Price: 8.62 Smart Investing & Trading Score : 52 | |
| Day Percent Change: 1.77% Day Change: 0.15 | |
| Week Change: 3.61% Year-to-date Change: -15.9% | |
| RC Links: Profile News Message Board | |
| Charts:- Daily , Weekly | |
| Add RC to Watchlist: View: Get Complete RC Trend Analysis ➞ | |
 | JFIN Jiayin Group Inc. |
| Sector: Technology | |
| SubSector: Internet Information Providers | |
| MarketCap: 131.48 Millions | |
| Recent Price: 6.45 Smart Investing & Trading Score : 58 | |
| Day Percent Change: 1.49% Day Change: 0.09 | |
| Week Change: -0.15% Year-to-date Change: 24.5% | |
| JFIN Links: Profile News Message Board | |
| Charts:- Daily , Weekly | |
| Add JFIN to Watchlist: View: Get Complete JFIN Trend Analysis ➞ | |
 | CANG Cango Inc. |
| Sector: Technology | |
| SubSector: Internet Information Providers | |
| MarketCap: 947.48 Millions | |
| Recent Price: 1.40 Smart Investing & Trading Score : 56 | |
| Day Percent Change: 1.45% Day Change: 0.02 | |
| Week Change: -4.11% Year-to-date Change: 37.3% | |
| CANG Links: Profile News Message Board | |
| Charts:- Daily , Weekly | |
| Add CANG to Watchlist: View: Get Complete CANG Trend Analysis ➞ | |
 | QD Qudian Inc. |
| Sector: Technology | |
| SubSector: Information Technology Services | |
| MarketCap: 544.968 Millions | |
| Recent Price: 2.28 Smart Investing & Trading Score : 43 | |
| Day Percent Change: 1.33% Day Change: 0.03 | |
| Week Change: -5.79% Year-to-date Change: 11.8% | |
| QD Links: Profile News Message Board | |
| Charts:- Daily , Weekly | |
| Add QD to Watchlist: View: Get Complete QD Trend Analysis ➞ | |
 | TOP TOP Financial Group Limited |
| Sector: Financials | |
| SubSector: Capital Markets | |
| MarketCap: 329 Millions | |
| Recent Price: 2.35 Smart Investing & Trading Score : 42 | |
| Day Percent Change: 1.29% Day Change: 0.03 | |
| Week Change: -8.91% Year-to-date Change: -36.8% | |
| TOP Links: Profile News Message Board | |
| Charts:- Daily , Weekly | |
| Add TOP to Watchlist: View: Get Complete TOP Trend Analysis ➞ | |
 | VINP Vinci Partners Investments Ltd. |
| Sector: Financials | |
| SubSector: Asset Management | |
| MarketCap: 537 Millions | |
| Recent Price: 10.25 Smart Investing & Trading Score : 17 | |
| Day Percent Change: 0.99% Day Change: 0.10 | |
| Week Change: -5.09% Year-to-date Change: -6.7% | |
| VINP Links: Profile News Message Board | |
| Charts:- Daily , Weekly | |
| Add VINP to Watchlist: View: Get Complete VINP Trend Analysis ➞ | |
 | HOLI Hollysys Automation Technologies Ltd. |
| Sector: Industrials | |
| SubSector: Industrial Electrical Equipment | |
| MarketCap: 668.379 Millions | |
| Recent Price: 24.55 Smart Investing & Trading Score : 31 | |
| Day Percent Change: 0.99% Day Change: 0.24 | |
| Week Change: -3.31% Year-to-date Change: -6.8% | |
| HOLI Links: Profile News Message Board | |
| Charts:- Daily , Weekly | |
| Add HOLI to Watchlist: View: Get Complete HOLI Trend Analysis ➞ | |
 | DRD DRDGOLD Limited |
| Sector: Materials | |
| SubSector: Gold | |
| MarketCap: 556.919 Millions | |
| Recent Price: 8.55 Smart Investing & Trading Score : 81 | |
| Day Percent Change: 0.83% Day Change: 0.07 | |
| Week Change: 1.18% Year-to-date Change: 7.6% | |
| DRD Links: Profile News Message Board | |
| Charts:- Daily , Weekly | |
| Add DRD to Watchlist: View: Get Complete DRD Trend Analysis ➞ | |
 | LVRO Lavoro Limited |
| Sector: Materials | |
| SubSector: Agricultural Inputs | |
| MarketCap: 686 Millions | |
| Recent Price: 5.88 Smart Investing & Trading Score : 42 | |
| Day Percent Change: 0.60% Day Change: 0.04 | |
| Week Change: -3.45% Year-to-date Change: -33.8% | |
| LVRO Links: Profile News Message Board | |
| Charts:- Daily , Weekly | |
| Add LVRO to Watchlist: View: Get Complete LVRO Trend Analysis ➞ | |
 | SOHU Sohu.com Limited |
| Sector: Technology | |
| SubSector: Internet Information Providers | |
| MarketCap: 243.48 Millions | |
| Recent Price: 10.97 Smart Investing & Trading Score : 66 | |
| Day Percent Change: 0.55% Day Change: 0.06 | |
| Week Change: -4.02% Year-to-date Change: 10.5% | |
| SOHU Links: Profile News Message Board | |
| Charts:- Daily , Weekly | |
| Add SOHU to Watchlist: View: Get Complete SOHU Trend Analysis ➞ | |
 | XNET Xunlei Limited |
| Sector: Technology | |
| SubSector: Application Software | |
| MarketCap: 203.662 Millions | |
| Recent Price: 1.48 Smart Investing & Trading Score : 20 | |
| Day Percent Change: 0.34% Day Change: 0.00 | |
| Week Change: -1% Year-to-date Change: -8.6% | |
| XNET Links: Profile News Message Board | |
| Charts:- Daily , Weekly | |
| Add XNET to Watchlist: View: Get Complete XNET Trend Analysis ➞ | |
| For tabular summary view of above stock list: Summary View ➞ 0 - 25 , 25 - 50 , 50 - 75 | ||
| Click To Change The Sort Order: By Market Cap or Company Size Performance: Year-to-date, Week and Day | |
| Select Chart Type: | ||
|
Best Stocks Today 12Stocks.com |
© 2024 12Stocks.com Terms & Conditions Privacy Contact Us
All Information Provided Only For Education And Not To Be Used For Investing or Trading. See Terms & Conditions


One More Thing ... Get Best Stocks Delivered Daily!
Never Ever Miss A Move With Our Top Ten Stocks Lists
Find Best Stocks In Any Market - Bull or Bear Market
Take A Peek At Our Top Ten Stocks Lists: Daily, Weekly, Year-to-Date & Top Trends
Find Best Stocks In Any Market - Bull or Bear Market
Take A Peek At Our Top Ten Stocks Lists: Daily, Weekly, Year-to-Date & Top Trends
Emerging Markets Stocks With Best Up Trends [0-bearish to 100-bullish]: HDFC Bank[93], Full Truck[93], DouYu [90], Harmony Gold[88], GDS [88], Bright Scholar[85], Gold Fields[85], MOGU [83], Lufax Holding[83], So-Young [83], DRDGOLD [81]
Best Emerging Markets Stocks Year-to-Date:
U Power[2768.3%], DouYu [747.37%], MicroCloud Hologram[702.88%], China Liberal[476.51%], Zhongchao [412.19%], Yatsen Holding[394.12%], Uxin [141.08%], QuantaSing [106.79%], GigaCloud [89.46%], Bright Scholar[60.8%], Cheetah Mobile[55.26%] Best Emerging Markets Stocks This Week:
Regencell Bioscience[45.67%], Yatsen Holding[20.1%], MingZhu Logistics[17.48%], Secoo Holding[17.14%], Zhongchao [14.02%], TH [11.82%], Controladora Vuela[10.64%], Bright Scholar[9.24%], Quhuo [8.87%], Smart Share[7.58%], DouYu [6.62%] Best Emerging Markets Stocks Daily:
Lanvin [11.19%], MingZhu Logistics[10.31%], Bright Scholar[6.91%], Regencell Bioscience[6.32%], Ambipar Emergency[6.09%], MOGU [5.85%], Petroleo Brasileiro[5.71%], Cheetah Mobile[5.04%], Secoo Holding[4.75%], BrasilAgro -[4.38%], Companhia Siderurgica[3.68%]