
 Login Sign Up


| |||||
 |  | ||||

| 12Stocks.com Market Intelligence |
Best Consumer Services Stocks
| In a hurry? Services & Goods Stocks: Performance Trends Table, Stock Charts
Sort Consumer Services: Daily, Weekly, Year-to-Date, Market Cap & Trends. Filter Services & Goods stocks list by size: All Large Mid-Range Small |
| 12Stocks.com Consumer Services Stocks Performances & Trends Daily | |||||||||
|
|  The overall Smart Investing & Trading Score is 58 (0-bearish to 100-bullish) which puts Consumer Services sector in short term neutral trend. The Smart Investing & Trading Score from previous trading session is 23 and an improvement of trend continues.
| ||||||||
Here are the Smart Investing & Trading Scores of the most requested Consumer Services stocks at 12Stocks.com (click stock name for detailed review):
|


| Consider signing up for our daily 12Stocks.com "Best Stocks Newsletter". You will never ever miss a big stock move again! |
| 12Stocks.com: Investing in Consumer Services sector with Stocks | |
|
The following table helps investors and traders sort through current performance and trends (as measured by Smart Investing & Trading Score) of various
stocks in the Consumer Services sector. Quick View: Move mouse or cursor over stock symbol (ticker) to view short-term Technical chart and over stock name to view long term chart. Click on  to add stock symbol to your watchlist and to add stock symbol to your watchlist and  to view watchlist. Click on any ticker or stock name for detailed market intelligence report for that stock. to view watchlist. Click on any ticker or stock name for detailed market intelligence report for that stock. |
12Stocks.com Performance of Stocks in Consumer Services Sector
| Ticker | Stock Name | Watchlist | Category | Recent Price | Smart Investing & Trading Score | Change % | YTD Change% |
| PGRU | PropertyGuru |   | Internet Content & Information | 3.64 | 83 | -2.93 | 8.49% |
| UONEK | Urban One | | Broadcasting | 1.61 | 10 | -3.01 | -53.20% |
| WISH | ContextLogic | | Internet Retail | 5.81 | 83 | -3.01 | -2.27% |
| RBLX | Roblox | | Electronic Gaming & Multimedia | 35.19 | 8 | -3.06 | -23.74% |
| SDA | SunCar Technology | | Auto & Truck Dealerships | 7.36 | 57 | -3.10 | -5.34% |
| PSNY | Polestar Automotive | | Auto Manufacturers | 1.23 | 10 | -3.16 | -46.15% |
| PSNYW | Polestar Automotive | | Auto Manufacturers | 0.15 | 25 | -3.23 | -38.14% |
| AMC | AMC Entertainment | | Entertainment | 3.28 | 57 | -3.24 | -46.41% |
| OMI | Owens & Minor | | Medical | 24.74 | 61 | -3.25 | 28.39% |
| CHWY | Chewy | | Retail | 15.09 | 20 | -3.27 | -36.14% |
| COE | China Online | | Education | 7.00 | 32 | -3.31 | -12.84% |
| ONEW | OneWater Marine | | Recreational | 23.37 | 28 | -3.31 | -30.84% |
| MG | Mistras | | Security | 8.93 | 51 | -3.35 | 21.99% |
| WW | WW | | Services | 1.66 | 25 | -3.49 | -81.03% |
| DRVN | Driven Brands | | Auto & Truck Dealerships | 14.52 | 68 | -3.49 | 1.15% |
| FYBR | Frontier | | Telecom Services | 22.05 | 22 | -3.61 | -12.62% |
| LI | Li Auto | | Auto Manufacturers | 23.86 | 0 | -3.81 | -36.26% |
| GPS | Gap | | Apparel | 20.11 | 36 | -3.83 | -3.83% |
| ANF | Abercrombie & Fitch Co | | Apparel | 115.09 | 65 | -3.86 | 30.46% |
| MYPS | PLAYSTUDIOS | | Electronic Gaming & Multimedia | 2.20 | 46 | -3.93 | -17.76% |
| THCH | TH | | Restaurants | 1.21 | 40 | -3.98 | -30.75% |
| CCO | Clear Channel | | Marketing | 1.44 | 20 | -4.00 | -20.88% |
| LE | Lands | | Retail | 13.11 | 90 | -4.52 | 37.13% |
| AUVI | Applied UV | | Furnishings, Fixtures & Appliances | 0.55 | 0 | -4.94 | -76.36% |
| PLAY | Dave & Buster s Entertainment | | Restaurants | 53.32 | 51 | -5.01 | -0.98% |
| For chart view version of above stock list: Chart View ➞ 0 - 25 , 25 - 50 , 50 - 75 , 75 - 100 , 100 - 125 , 125 - 150 , 150 - 175 , 175 - 200 , 200 - 225 , 225 - 250 , 250 - 275 , 275 - 300 , 300 - 325 , 325 - 350 , 350 - 375 , 375 - 400 , 400 - 425 , 425 - 450 , 450 - 475 | ||
 | Click To Change The Sort Order: By Market Cap or Company Size Performance: Year-to-date, Week and Day |  |
|
Get the most comprehensive stock market coverage daily at 12Stocks.com ➞ Best Stocks Today ➞ Best Stocks Weekly ➞ Best Stocks Year-to-Date ➞ Best Stocks Trends ➞  Best Stocks Today 12Stocks.com Best Nasdaq Stocks ➞ Best S&P 500 Stocks ➞ Best Tech Stocks ➞ Best Biotech Stocks ➞ |
| Detailed Overview of Consumer Services Stocks |
| Consumer Services Technical Overview, Leaders & Laggards, Top Consumer Services ETF Funds & Detailed Consumer Services Stocks List, Charts, Trends & More |
| Consumer Services Sector: Technical Analysis, Trends & YTD Performance | |
| Consumer Services sector is composed of stocks
from retail, entertainment, media/publishing, consumer goods
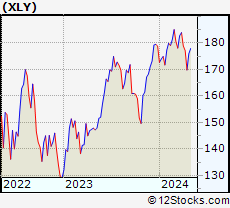
and services subsectors. Consumer Services sector, as represented by XLY, an exchange-traded fund [ETF] that holds basket of Consumer Services stocks (e.g, Walmart, Alibaba) is down by -2.58% and is currently underperforming the overall market by -8.24% year-to-date. Below is a quick view of Technical charts and trends: |
|
 XLY Weekly Chart |
|
| Long Term Trend: Good | |
| Medium Term Trend: Not Good | |
 XLY Daily Chart |
|
| Short Term Trend: Very Good | |
| Overall Trend Score: 58 | |
| YTD Performance: -2.58% | |
| **Trend Scores & Views Are Only For Educational Purposes And Not For Investing | |
| 12Stocks.com: Top Performing Consumer Services Sector Stocks | ||||||||||||||||||||||||||||||||||||||||||||||||
 The top performing Consumer Services sector stocks year to date are
Now, more recently, over last week, the top performing Consumer Services sector stocks on the move are


|
||||||||||||||||||||||||||||||||||||||||||||||||
| 12Stocks.com: Investing in Consumer Services Sector using Exchange Traded Funds | |
|
The following table shows list of key exchange traded funds (ETF) that
help investors track Consumer Services Index. For detailed view, check out our ETF Funds section of our website. Quick View: Move mouse or cursor over ETF symbol (ticker) to view short-term Technical chart and over ETF name to view long term chart. Click on ticker or stock name for detailed view. Click on to add stock symbol to your watchlist and to view watchlist. |
12Stocks.com List of ETFs that track Consumer Services Index
| Ticker | ETF Name | Watchlist | Recent Price | Smart Investing & Trading Score | Change % | Week % | Year-to-date % |
| XLY | Consumer Discret Sel | | 174.19 | 58 | 0.96 | 2.61 | -2.58% |
| RTH | Retail | | 200.56 | 58 | 0.03 | 0.97 | 6.55% |
| IYC | Consumer Services | | 77.83 | 43 | 0.31 | 2.05 | 2.72% |
| XRT | Retail | | 72.52 | 65 | -0.71 | 1.9 | 0.28% |
| IYK | Consumer Goods | | 67.20 | 75 | 0.99 | 2.11 | 5.16% |
| UCC | Consumer Services | | 33.37 | 73 | 2.12 | 5.68 | -7.07% |
| RETL | Retail Bull 3X | | 8.59 | 48 | -1.60 | 5.79 | -5.81% |
| RXI | Globl Consumer Discretionary | | 160.29 | 43 | 0.63 | 2 | 0.77% |
| SCC | Short Consumer Services | | 16.15 | 35 | -1.67 | -4.74 | 5.39% |
| UGE | Consumer Goods | | 17.02 | 83 | -0.09 | 2.33 | 8.09% |
| 12Stocks.com: Charts, Trends, Fundamental Data and Performances of Consumer Services Stocks | |
|
We now take in-depth look at all Consumer Services stocks including charts, multi-period performances and overall trends (as measured by Smart Investing & Trading Score). One can sort Consumer Services stocks (click link to choose) by Daily, Weekly and by Year-to-Date performances. Also, one can sort by size of the company or by market capitalization. |
| Select Your Default Chart Type: | |||||
| |||||
| Click on stock symbol or name for detailed view. Click on to add stock symbol to your watchlist and to view watchlist. Quick View: Move mouse or cursor over "Daily" to quickly view daily Technical stock chart and over "Weekly" to view weekly Technical stock chart. | |||||

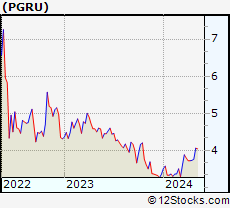 | PGRU PropertyGuru Group Limited |
| Sector: Services & Goods | |
| SubSector: Internet Content & Information | |
| MarketCap: 720 Millions | |
| Recent Price: 3.64 Smart Investing & Trading Score: 83 | |
| Day Percent Change: -2.93% Day Change: -0.11 | |
| Week Change: -2.41% Year-to-date Change: 8.5% | |
| PGRU Links: Profile News Message Board | |
| Charts:- Daily , Weekly | |
| Add PGRU to Watchlist: View: Get Complete PGRU Trend Analysis ➞ | |
 | UONEK Urban One, Inc. |
| Sector: Services & Goods | |
| SubSector: Broadcasting - Radio | |
| MarketCap: 601.795 Millions | |
| Recent Price: 1.61 Smart Investing & Trading Score: 10 | |
| Day Percent Change: -3.01% Day Change: -0.05 | |
| Week Change: -5.29% Year-to-date Change: -53.2% | |
| UONEK Links: Profile News Message Board | |
| Charts:- Daily , Weekly | |
| Add UONEK to Watchlist: View: Get Complete UONEK Trend Analysis ➞ | |
 | WISH ContextLogic Inc. |
| Sector: Services & Goods | |
| SubSector: Internet Retail | |
| MarketCap: 165 Millions | |
| Recent Price: 5.81 Smart Investing & Trading Score: 83 | |
| Day Percent Change: -3.01% Day Change: -0.18 | |
| Week Change: -0.51% Year-to-date Change: -2.3% | |
| WISH Links: Profile News Message Board | |
| Charts:- Daily , Weekly | |
| Add WISH to Watchlist: View: Get Complete WISH Trend Analysis ➞ | |
 | RBLX Roblox Corporation |
| Sector: Services & Goods | |
| SubSector: Electronic Gaming & Multimedia | |
| MarketCap: 25420 Millions | |
| Recent Price: 35.19 Smart Investing & Trading Score: 8 | |
| Day Percent Change: -3.06% Day Change: -1.11 | |
| Week Change: -0.42% Year-to-date Change: -23.7% | |
| RBLX Links: Profile News Message Board | |
| Charts:- Daily , Weekly | |
| Add RBLX to Watchlist: View: Get Complete RBLX Trend Analysis ➞ | |
 | SDA SunCar Technology Group Inc. |
| Sector: Services & Goods | |
| SubSector: Auto & Truck Dealerships | |
| MarketCap: 2680 Millions | |
| Recent Price: 7.36 Smart Investing & Trading Score: 57 | |
| Day Percent Change: -3.10% Day Change: -0.23 | |
| Week Change: 3.74% Year-to-date Change: -5.3% | |
| SDA Links: Profile News Message Board | |
| Charts:- Daily , Weekly | |
| Add SDA to Watchlist: View: Get Complete SDA Trend Analysis ➞ | |
 | PSNY Polestar Automotive Holding UK PLC |
| Sector: Services & Goods | |
| SubSector: Auto Manufacturers | |
| MarketCap: 7870 Millions | |
| Recent Price: 1.23 Smart Investing & Trading Score: 10 | |
| Day Percent Change: -3.16% Day Change: -0.04 | |
| Week Change: -9.26% Year-to-date Change: -46.2% | |
| PSNY Links: Profile News Message Board | |
| Charts:- Daily , Weekly | |
| Add PSNY to Watchlist: View: Get Complete PSNY Trend Analysis ➞ | |
 | PSNYW Polestar Automotive Holding UK PLC |
| Sector: Services & Goods | |
| SubSector: Auto Manufacturers | |
| MarketCap: 1450 Millions | |
| Recent Price: 0.15 Smart Investing & Trading Score: 25 | |
| Day Percent Change: -3.23% Day Change: -0.01 | |
| Week Change: 2.04% Year-to-date Change: -38.1% | |
| PSNYW Links: Profile News Message Board | |
| Charts:- Daily , Weekly | |
| Add PSNYW to Watchlist: View: Get Complete PSNYW Trend Analysis ➞ | |
 | AMC AMC Entertainment Holdings, Inc. |
| Sector: Services & Goods | |
| SubSector: Movie Production, Theaters | |
| MarketCap: 415.929 Millions | |
| Recent Price: 3.28 Smart Investing & Trading Score: 57 | |
| Day Percent Change: -3.24% Day Change: -0.11 | |
| Week Change: 3.8% Year-to-date Change: -46.4% | |
| AMC Links: Profile News Message Board | |
| Charts:- Daily , Weekly | |
| Add AMC to Watchlist: View: Get Complete AMC Trend Analysis ➞ | |
 | OMI Owens & Minor, Inc. |
| Sector: Services & Goods | |
| SubSector: Medical Equipment Wholesale | |
| MarketCap: 403.92 Millions | |
| Recent Price: 24.74 Smart Investing & Trading Score: 61 | |
| Day Percent Change: -3.25% Day Change: -0.83 | |
| Week Change: -0.2% Year-to-date Change: 28.4% | |
| OMI Links: Profile News Message Board | |
| Charts:- Daily , Weekly | |
| Add OMI to Watchlist: View: Get Complete OMI Trend Analysis ➞ | |
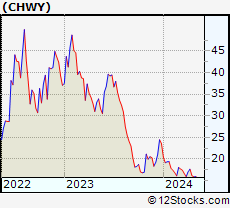 | CHWY Chewy, Inc. |
| Sector: Services & Goods | |
| SubSector: Specialty Retail, Other | |
| MarketCap: 14226.4 Millions | |
| Recent Price: 15.09 Smart Investing & Trading Score: 20 | |
| Day Percent Change: -3.27% Day Change: -0.51 | |
| Week Change: -6.56% Year-to-date Change: -36.1% | |
| CHWY Links: Profile News Message Board | |
| Charts:- Daily , Weekly | |
| Add CHWY to Watchlist: View: Get Complete CHWY Trend Analysis ➞ | |
 | COE China Online Education Group |
| Sector: Services & Goods | |
| SubSector: Education & Training Services | |
| MarketCap: 643.406 Millions | |
| Recent Price: 7.00 Smart Investing & Trading Score: 32 | |
| Day Percent Change: -3.31% Day Change: -0.24 | |
| Week Change: 8.19% Year-to-date Change: -12.8% | |
| COE Links: Profile News Message Board | |
| Charts:- Daily , Weekly | |
| Add COE to Watchlist: View: Get Complete COE Trend Analysis ➞ | |
 | ONEW OneWater Marine Inc. |
| Sector: Services & Goods | |
| SubSector: Recreational Vehicles | |
| MarketCap: 42027 Millions | |
| Recent Price: 23.37 Smart Investing & Trading Score: 28 | |
| Day Percent Change: -3.31% Day Change: -0.80 | |
| Week Change: -1.93% Year-to-date Change: -30.8% | |
| ONEW Links: Profile News Message Board | |
| Charts:- Daily , Weekly | |
| Add ONEW to Watchlist: View: Get Complete ONEW Trend Analysis ➞ | |
 | MG Mistras Group, Inc. |
| Sector: Services & Goods | |
| SubSector: Security & Protection Services | |
| MarketCap: 136.903 Millions | |
| Recent Price: 8.93 Smart Investing & Trading Score: 51 | |
| Day Percent Change: -3.35% Day Change: -0.31 | |
| Week Change: -1.65% Year-to-date Change: 22.0% | |
| MG Links: Profile News Message Board | |
| Charts:- Daily , Weekly | |
| Add MG to Watchlist: View: Get Complete MG Trend Analysis ➞ | |
 | WW WW International, Inc. |
| Sector: Services & Goods | |
| SubSector: Personal Services | |
| MarketCap: 1186.25 Millions | |
| Recent Price: 1.66 Smart Investing & Trading Score: 25 | |
| Day Percent Change: -3.49% Day Change: -0.06 | |
| Week Change: -2.92% Year-to-date Change: -81.0% | |
| WW Links: Profile News Message Board | |
| Charts:- Daily , Weekly | |
| Add WW to Watchlist: View: Get Complete WW Trend Analysis ➞ | |
 | DRVN Driven Brands Holdings Inc. |
| Sector: Services & Goods | |
| SubSector: Auto & Truck Dealerships | |
| MarketCap: 4490 Millions | |
| Recent Price: 14.52 Smart Investing & Trading Score: 68 | |
| Day Percent Change: -3.49% Day Change: -0.53 | |
| Week Change: 2.91% Year-to-date Change: 1.2% | |
| DRVN Links: Profile News Message Board | |
| Charts:- Daily , Weekly | |
| Add DRVN to Watchlist: View: Get Complete DRVN Trend Analysis ➞ | |
 | FYBR Frontier Communications Parent, Inc. |
| Sector: Services & Goods | |
| SubSector: Telecom Services | |
| MarketCap: 4460 Millions | |
| Recent Price: 22.05 Smart Investing & Trading Score: 22 | |
| Day Percent Change: -3.61% Day Change: -0.82 | |
| Week Change: 1.59% Year-to-date Change: -12.6% | |
| FYBR Links: Profile News Message Board | |
| Charts:- Daily , Weekly | |
| Add FYBR to Watchlist: View: Get Complete FYBR Trend Analysis ➞ | |
 | LI Li Auto Inc. |
| Sector: Services & Goods | |
| SubSector: Auto Manufacturers | |
| MarketCap: 29167 Millions | |
| Recent Price: 23.86 Smart Investing & Trading Score: 0 | |
| Day Percent Change: -3.81% Day Change: -0.95 | |
| Week Change: -12.29% Year-to-date Change: -36.3% | |
| LI Links: Profile News Message Board | |
| Charts:- Daily , Weekly | |
| Add LI to Watchlist: View: Get Complete LI Trend Analysis ➞ | |
 | GPS The Gap, Inc. |
| Sector: Services & Goods | |
| SubSector: Apparel Stores | |
| MarketCap: 2936.08 Millions | |
| Recent Price: 20.11 Smart Investing & Trading Score: 36 | |
| Day Percent Change: -3.83% Day Change: -0.80 | |
| Week Change: -3.13% Year-to-date Change: -3.8% | |
| GPS Links: Profile News Message Board | |
| Charts:- Daily , Weekly | |
| Add GPS to Watchlist: View: Get Complete GPS Trend Analysis ➞ | |
 | ANF Abercrombie & Fitch Co. |
| Sector: Services & Goods | |
| SubSector: Apparel Stores | |
| MarketCap: 589.108 Millions | |
| Recent Price: 115.09 Smart Investing & Trading Score: 65 | |
| Day Percent Change: -3.86% Day Change: -4.62 | |
| Week Change: 4.29% Year-to-date Change: 30.5% | |
| ANF Links: Profile News Message Board | |
| Charts:- Daily , Weekly | |
| Add ANF to Watchlist: View: Get Complete ANF Trend Analysis ➞ | |
 | MYPS PLAYSTUDIOS, Inc. |
| Sector: Services & Goods | |
| SubSector: Electronic Gaming & Multimedia | |
| MarketCap: 635 Millions | |
| Recent Price: 2.20 Smart Investing & Trading Score: 46 | |
| Day Percent Change: -3.93% Day Change: -0.09 | |
| Week Change: -4.76% Year-to-date Change: -17.8% | |
| MYPS Links: Profile News Message Board | |
| Charts:- Daily , Weekly | |
| Add MYPS to Watchlist: View: Get Complete MYPS Trend Analysis ➞ | |
 | THCH TH International Limited |
| Sector: Services & Goods | |
| SubSector: Restaurants | |
| MarketCap: 452 Millions | |
| Recent Price: 1.21 Smart Investing & Trading Score: 40 | |
| Day Percent Change: -3.98% Day Change: -0.05 | |
| Week Change: -2.03% Year-to-date Change: -30.8% | |
| THCH Links: Profile News Message Board | |
| Charts:- Daily , Weekly | |
| Add THCH to Watchlist: View: Get Complete THCH Trend Analysis ➞ | |
 | CCO Clear Channel Outdoor Holdings, Inc. |
| Sector: Services & Goods | |
| SubSector: Marketing Services | |
| MarketCap: 312.715 Millions | |
| Recent Price: 1.44 Smart Investing & Trading Score: 20 | |
| Day Percent Change: -4.00% Day Change: -0.06 | |
| Week Change: -3.36% Year-to-date Change: -20.9% | |
| CCO Links: Profile News Message Board | |
| Charts:- Daily , Weekly | |
| Add CCO to Watchlist: View: Get Complete CCO Trend Analysis ➞ | |
 | LE Lands End, Inc. |
| Sector: Services & Goods | |
| SubSector: Catalog & Mail Order Houses | |
| MarketCap: 268.692 Millions | |
| Recent Price: 13.11 Smart Investing & Trading Score: 90 | |
| Day Percent Change: -4.52% Day Change: -0.62 | |
| Week Change: 2.66% Year-to-date Change: 37.1% | |
| LE Links: Profile News Message Board | |
| Charts:- Daily , Weekly | |
| Add LE to Watchlist: View: Get Complete LE Trend Analysis ➞ | |
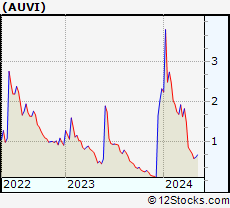 | AUVI Applied UV, Inc. |
| Sector: Services & Goods | |
| SubSector: Furnishings, Fixtures & Appliances | |
| MarketCap: 49027 Millions | |
| Recent Price: 0.55 Smart Investing & Trading Score: 0 | |
| Day Percent Change: -4.94% Day Change: -0.03 | |
| Week Change: -21.5% Year-to-date Change: -76.4% | |
| AUVI Links: Profile News Message Board | |
| Charts:- Daily , Weekly | |
| Add AUVI to Watchlist: View: Get Complete AUVI Trend Analysis ➞ | |
 | PLAY Dave & Buster s Entertainment, Inc. |
| Sector: Services & Goods | |
| SubSector: Restaurants | |
| MarketCap: 283.07 Millions | |
| Recent Price: 53.32 Smart Investing & Trading Score: 51 | |
| Day Percent Change: -5.01% Day Change: -2.81 | |
| Week Change: -0.71% Year-to-date Change: -1.0% | |
| PLAY Links: Profile News Message Board | |
| Charts:- Daily , Weekly | |
| Add PLAY to Watchlist: View: Get Complete PLAY Trend Analysis ➞ | |
| For tabular summary view of above stock list: Summary View ➞ 0 - 25 , 25 - 50 , 50 - 75 , 75 - 100 , 100 - 125 , 125 - 150 , 150 - 175 , 175 - 200 , 200 - 225 , 225 - 250 , 250 - 275 , 275 - 300 , 300 - 325 , 325 - 350 , 350 - 375 , 375 - 400 , 400 - 425 , 425 - 450 , 450 - 475 | ||
| Click To Change The Sort Order: By Market Cap or Company Size Performance: Year-to-date, Week and Day | |
| Select Chart Type: | ||
|
Best Stocks Today 12Stocks.com |
© 2024 12Stocks.com Terms & Conditions Privacy Contact Us
All Information Provided Only For Education And Not To Be Used For Investing or Trading. See Terms & Conditions


One More Thing ... Get Best Stocks Delivered Daily!
Never Ever Miss A Move With Our Top Ten Stocks Lists
Find Best Stocks In Any Market - Bull or Bear Market
Take A Peek At Our Top Ten Stocks Lists: Daily, Weekly, Year-to-Date & Top Trends
Find Best Stocks In Any Market - Bull or Bear Market
Take A Peek At Our Top Ten Stocks Lists: Daily, Weekly, Year-to-Date & Top Trends
Consumer Services Stocks With Best Up Trends [0-bearish to 100-bullish]: Yatsen Holding[100], 1[100], Alibaba [100], MINISO [100], Omnicom [100], Napco Security[100], ASGN [100], IMAX [100], Yum! Brands[100], Dillard s[100], Carriage Services[100]
Best Consumer Services Stocks Year-to-Date:
U Power[3013.84%], Vroom [1807.84%], Yatsen Holding[479.55%], Fluent [308.96%], Codere Online[134.25%], Research[105.46%], Sweetgreen [92.21%], RealReal [71.64%], PaySign [60.36%], DXP Enterprises[54.12%], Bright Scholar[52%] Best Consumer Services Stocks This Week:
Chicken Soup[307.5%], Hibbett Sports[21.56%], Golden Heaven[20.85%], Yatsen Holding[17.29%], Baozun [14.44%], Jumia Technologies[14.21%], Zumiez [13.45%], Ameresco [13.24%], 1[12.87%], Pinduoduo [12.42%], K12 [11.85%] Best Consumer Services Stocks Daily:
Chicken Soup[288.10%], Golden Heaven[11.81%], K12 [8.64%], Yatsen Holding[7.89%], GameStop [7.58%], Dada Nexus[7.53%], U Power[7.31%], Yunji [7.26%], 1[7.23%], Value Line[6.81%], Watsco [6.54%]