
 Login Sign Up


| |||||
 |  | ||||

| 12Stocks.com Market Intelligence |
Best Consumer Services Stocks
| In a hurry? Services & Goods Stocks: Performance Trends Table, Stock Charts
Sort Consumer Services: Daily, Weekly, Year-to-Date, Market Cap & Trends. Filter Services & Goods stocks list by size: All Large Mid-Range Small |
| 12Stocks.com Consumer Services Stocks Performances & Trends Daily | |||||||||
|
|  The overall Smart Investing & Trading Score is 38 (0-bearish to 100-bullish) which puts Consumer Services sector in short term bearish to neutral trend. The Smart Investing & Trading Score from previous trading session is 23 and hence an improvement of trend.
| ||||||||
Here are the Smart Investing & Trading Scores of the most requested Consumer Services stocks at 12Stocks.com (click stock name for detailed review):
|


| Consider signing up for our daily 12Stocks.com "Best Stocks Newsletter". You will never ever miss a big stock move again! |
| 12Stocks.com: Investing in Consumer Services sector with Stocks | |
|
The following table helps investors and traders sort through current performance and trends (as measured by Smart Investing & Trading Score) of various
stocks in the Consumer Services sector. Quick View: Move mouse or cursor over stock symbol (ticker) to view short-term Technical chart and over stock name to view long term chart. Click on  to add stock symbol to your watchlist and to add stock symbol to your watchlist and  to view watchlist. Click on any ticker or stock name for detailed market intelligence report for that stock. to view watchlist. Click on any ticker or stock name for detailed market intelligence report for that stock. |
12Stocks.com Performance of Stocks in Consumer Services Sector
| Ticker | Stock Name | Watchlist | Category | Recent Price | Smart Investing & Trading Score | Change % | YTD Change% |
| NGVC | Natural Grocers |   | Grocery | 16.28 | 51 | 0.43 | 1.75% |
| PDCO | Patterson | | Medical | 26.02 | 57 | 0.41 | -8.56% |
| SDA | SunCar Technology | | Auto & Truck Dealerships | 7.26 | 45 | 0.41 | -6.56% |
| VAC | Marriott Vacations | | Casinos | 99.30 | 68 | 0.41 | 16.97% |
| CURV | Torrid | | Apparel Retail | 4.88 | 69 | 0.41 | -16.58% |
| RBA | Ritchie Bros. | | Services | 73.11 | 63 | 0.40 | 9.30% |
| BH | Biglari | | Restaurants | 201.82 | 90 | 0.40 | 22.37% |
| DRI | Darden Restaurants | | Restaurants | 155.16 | 49 | 0.39 | -5.56% |
| LOW | Lowe s | | Retail | 232.10 | 58 | 0.38 | 4.29% |
| HRB | H&R Block | | Services | 47.45 | 90 | 0.36 | -1.90% |
| BBY | Best Buy | | Retail | 75.38 | 44 | 0.35 | -3.70% |
| CTAS | Cintas | | Services | 667.34 | 51 | 0.35 | 10.73% |
| CHH | Choice Hotels | | Lodging | 117.30 | 35 | 0.33 | 3.53% |
| AMZN | Amazon.com | | Retail | 177.78 | 41 | 0.31 | 17.01% |
| ULTA | Ulta Beauty | | Retail | 419.27 | 25 | 0.31 | -14.43% |
| CPNG | Coupang | | Internet Retail | 22.53 | 83 | 0.31 | 39.07% |
| MGA | Magna | | Auto Parts | 49.46 | 32 | 0.30 | -16.28% |
| EBAY | eBay | | Retail | 51.09 | 68 | 0.29 | 17.13% |
| IMAX | IMAX | | Entertainment | 17.20 | 78 | 0.29 | 14.51% |
| ASPS | Altisource Portfolio | | Services | 1.71 | 59 | 0.29 | -52.11% |
| TGNA | TEGNA | | Broadcasting | 13.89 | 59 | 0.29 | -9.22% |
| AMBP | Ardagh Metal | | Packaging | 3.64 | 74 | 0.28 | -4.84% |
| MCD | McDonald s | | Restaurants | 276.24 | 64 | 0.24 | -6.84% |
| MANU | Manchester United | | Sporting | 15.46 | 74 | 0.23 | -24.17% |
| TNET | TriNet | | Services | 129.97 | 58 | 0.22 | 9.28% |
| For chart view version of above stock list: Chart View ➞ 0 - 25 , 25 - 50 , 50 - 75 , 75 - 100 , 100 - 125 , 125 - 150 , 150 - 175 , 175 - 200 , 200 - 225 , 225 - 250 , 250 - 275 , 275 - 300 , 300 - 325 , 325 - 350 , 350 - 375 , 375 - 400 | ||
 | Click To Change The Sort Order: By Market Cap or Company Size Performance: Year-to-date, Week and Day |  |
|
Get the most comprehensive stock market coverage daily at 12Stocks.com ➞ Best Stocks Today ➞ Best Stocks Weekly ➞ Best Stocks Year-to-Date ➞ Best Stocks Trends ➞  Best Stocks Today 12Stocks.com Best Nasdaq Stocks ➞ Best S&P 500 Stocks ➞ Best Tech Stocks ➞ Best Biotech Stocks ➞ |
| Detailed Overview of Consumer Services Stocks |
| Consumer Services Technical Overview, Leaders & Laggards, Top Consumer Services ETF Funds & Detailed Consumer Services Stocks List, Charts, Trends & More |
| Consumer Services Sector: Technical Analysis, Trends & YTD Performance | |
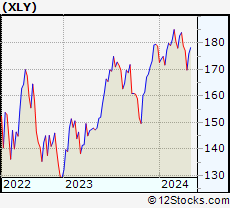
| Consumer Services sector is composed of stocks
from retail, entertainment, media/publishing, consumer goods
and services subsectors. Consumer Services sector, as represented by XLY, an exchange-traded fund [ETF] that holds basket of Consumer Services stocks (e.g, Walmart, Alibaba) is down by -3.89% and is currently underperforming the overall market by -9.38% year-to-date. Below is a quick view of Technical charts and trends: |
|
 XLY Weekly Chart |
|
| Long Term Trend: Good | |
| Medium Term Trend: Not Good | |
 XLY Daily Chart |
|
| Short Term Trend: Very Good | |
| Overall Trend Score: 38 | |
| YTD Performance: -3.89% | |
| **Trend Scores & Views Are Only For Educational Purposes And Not For Investing | |
| 12Stocks.com: Top Performing Consumer Services Sector Stocks | ||||||||||||||||||||||||||||||||||||||||||||||||
 The top performing Consumer Services sector stocks year to date are
Now, more recently, over last week, the top performing Consumer Services sector stocks on the move are


|
||||||||||||||||||||||||||||||||||||||||||||||||
| 12Stocks.com: Investing in Consumer Services Sector using Exchange Traded Funds | |
|
The following table shows list of key exchange traded funds (ETF) that
help investors track Consumer Services Index. For detailed view, check out our ETF Funds section of our website. Quick View: Move mouse or cursor over ETF symbol (ticker) to view short-term Technical chart and over ETF name to view long term chart. Click on ticker or stock name for detailed view. Click on to add stock symbol to your watchlist and to view watchlist. |
12Stocks.com List of ETFs that track Consumer Services Index
| Ticker | ETF Name | Watchlist | Recent Price | Smart Investing & Trading Score | Change % | Week % | Year-to-date % |
| XLY | Consumer Discret Sel | | 171.85 | 38 | 0.79 | 1.23 | -3.89% |
| RTH | Retail | | 200.28 | 51 | 0.05 | 0.83 | 6.4% |
| IYC | Consumer Services | | 77.33 | 36 | 0.93 | 1.39 | 2.06% |
| XRT | Retail | | 72.75 | 58 | 1.78 | 2.21 | 0.59% |
| IYK | Consumer Goods | | 66.61 | 100 | 0.28 | 1.21 | 4.23% |
| UCC | Consumer Services | | 32.17 | 25 | 0.06 | 1.88 | -10.41% |
| RETL | Retail Bull 3X | | 8.68 | 56 | 5.36 | 6.92 | -4.8% |
| SCC | Short Consumer Services | | 16.52 | 70 | -1.67 | -2.56 | 7.81% |
| UGE | Consumer Goods | | 16.93 | 80 | -0.29 | 1.82 | 7.55% |
| 12Stocks.com: Charts, Trends, Fundamental Data and Performances of Consumer Services Stocks | |
|
We now take in-depth look at all Consumer Services stocks including charts, multi-period performances and overall trends (as measured by Smart Investing & Trading Score). One can sort Consumer Services stocks (click link to choose) by Daily, Weekly and by Year-to-Date performances. Also, one can sort by size of the company or by market capitalization. |
| Select Your Default Chart Type: | |||||
| |||||
| Click on stock symbol or name for detailed view. Click on to add stock symbol to your watchlist and to view watchlist. Quick View: Move mouse or cursor over "Daily" to quickly view daily Technical stock chart and over "Weekly" to view weekly Technical stock chart. | |||||

 | NGVC Natural Grocers by Vitamin Cottage, Inc. |
| Sector: Services & Goods | |
| SubSector: Grocery Stores | |
| MarketCap: 185.475 Millions | |
| Recent Price: 16.28 Smart Investing & Trading Score: 51 | |
| Day Percent Change: 0.43% Day Change: 0.07 | |
| Week Change: -1.21% Year-to-date Change: 1.8% | |
| NGVC Links: Profile News Message Board | |
| Charts:- Daily , Weekly | |
| Add NGVC to Watchlist: View: Get Complete NGVC Trend Analysis ➞ | |
 | PDCO Patterson Companies, Inc. |
| Sector: Services & Goods | |
| SubSector: Medical Equipment Wholesale | |
| MarketCap: 1672.2 Millions | |
| Recent Price: 26.02 Smart Investing & Trading Score: 57 | |
| Day Percent Change: 0.41% Day Change: 0.11 | |
| Week Change: -0.02% Year-to-date Change: -8.6% | |
| PDCO Links: Profile News Message Board | |
| Charts:- Daily , Weekly | |
| Add PDCO to Watchlist: View: Get Complete PDCO Trend Analysis ➞ | |
 | SDA SunCar Technology Group Inc. |
| Sector: Services & Goods | |
| SubSector: Auto & Truck Dealerships | |
| MarketCap: 2680 Millions | |
| Recent Price: 7.26 Smart Investing & Trading Score: 45 | |
| Day Percent Change: 0.41% Day Change: 0.03 | |
| Week Change: 2.4% Year-to-date Change: -6.6% | |
| SDA Links: Profile News Message Board | |
| Charts:- Daily , Weekly | |
| Add SDA to Watchlist: View: Get Complete SDA Trend Analysis ➞ | |
 | VAC Marriott Vacations Worldwide Corporation |
| Sector: Services & Goods | |
| SubSector: Resorts & Casinos | |
| MarketCap: 2173.54 Millions | |
| Recent Price: 99.30 Smart Investing & Trading Score: 68 | |
| Day Percent Change: 0.41% Day Change: 0.41 | |
| Week Change: 1.34% Year-to-date Change: 17.0% | |
| VAC Links: Profile News Message Board | |
| Charts:- Daily , Weekly | |
| Add VAC to Watchlist: View: Get Complete VAC Trend Analysis ➞ | |
 | CURV Torrid Holdings Inc. |
| Sector: Services & Goods | |
| SubSector: Apparel Retail | |
| MarketCap: 278 Millions | |
| Recent Price: 4.88 Smart Investing & Trading Score: 69 | |
| Day Percent Change: 0.41% Day Change: 0.02 | |
| Week Change: 1.04% Year-to-date Change: -16.6% | |
| CURV Links: Profile News Message Board | |
| Charts:- Daily , Weekly | |
| Add CURV to Watchlist: View: Get Complete CURV Trend Analysis ➞ | |
 | RBA Ritchie Bros. Auctioneers Incorporated |
| Sector: Services & Goods | |
| SubSector: Business Services | |
| MarketCap: 3491.02 Millions | |
| Recent Price: 73.11 Smart Investing & Trading Score: 63 | |
| Day Percent Change: 0.40% Day Change: 0.29 | |
| Week Change: 0.69% Year-to-date Change: 9.3% | |
| RBA Links: Profile News Message Board | |
| Charts:- Daily , Weekly | |
| Add RBA to Watchlist: View: Get Complete RBA Trend Analysis ➞ | |
 | BH Biglari Holdings Inc. |
| Sector: Services & Goods | |
| SubSector: Restaurants | |
| MarketCap: 149.07 Millions | |
| Recent Price: 201.82 Smart Investing & Trading Score: 90 | |
| Day Percent Change: 0.40% Day Change: 0.80 | |
| Week Change: 1.05% Year-to-date Change: 22.4% | |
| BH Links: Profile News Message Board | |
| Charts:- Daily , Weekly | |
| Add BH to Watchlist: View: Get Complete BH Trend Analysis ➞ | |
 | DRI Darden Restaurants, Inc. |
| Sector: Services & Goods | |
| SubSector: Restaurants | |
| MarketCap: 5623.1 Millions | |
| Recent Price: 155.16 Smart Investing & Trading Score: 49 | |
| Day Percent Change: 0.39% Day Change: 0.61 | |
| Week Change: 1.74% Year-to-date Change: -5.6% | |
| DRI Links: Profile News Message Board | |
| Charts:- Daily , Weekly | |
| Add DRI to Watchlist: View: Get Complete DRI Trend Analysis ➞ | |
 | LOW Lowe s Companies, Inc. |
| Sector: Services & Goods | |
| SubSector: Home Improvement Stores | |
| MarketCap: 56084.2 Millions | |
| Recent Price: 232.10 Smart Investing & Trading Score: 58 | |
| Day Percent Change: 0.38% Day Change: 0.87 | |
| Week Change: 0.81% Year-to-date Change: 4.3% | |
| LOW Links: Profile News Message Board | |
| Charts:- Daily , Weekly | |
| Add LOW to Watchlist: View: Get Complete LOW Trend Analysis ➞ | |
 | HRB H&R Block, Inc. |
| Sector: Services & Goods | |
| SubSector: Personal Services | |
| MarketCap: 3052.45 Millions | |
| Recent Price: 47.45 Smart Investing & Trading Score: 90 | |
| Day Percent Change: 0.36% Day Change: 0.17 | |
| Week Change: 1.3% Year-to-date Change: -1.9% | |
| HRB Links: Profile News Message Board | |
| Charts:- Daily , Weekly | |
| Add HRB to Watchlist: View: Get Complete HRB Trend Analysis ➞ | |
 | BBY Best Buy Co., Inc. |
| Sector: Services & Goods | |
| SubSector: Electronics Stores | |
| MarketCap: 15771.3 Millions | |
| Recent Price: 75.38 Smart Investing & Trading Score: 44 | |
| Day Percent Change: 0.35% Day Change: 0.26 | |
| Week Change: -1.01% Year-to-date Change: -3.7% | |
| BBY Links: Profile News Message Board | |
| Charts:- Daily , Weekly | |
| Add BBY to Watchlist: View: Get Complete BBY Trend Analysis ➞ | |
 | CTAS Cintas Corporation |
| Sector: Services & Goods | |
| SubSector: Business Services | |
| MarketCap: 20154.6 Millions | |
| Recent Price: 667.34 Smart Investing & Trading Score: 51 | |
| Day Percent Change: 0.35% Day Change: 2.34 | |
| Week Change: 0.91% Year-to-date Change: 10.7% | |
| CTAS Links: Profile News Message Board | |
| Charts:- Daily , Weekly | |
| Add CTAS to Watchlist: View: Get Complete CTAS Trend Analysis ➞ | |
 | CHH Choice Hotels International, Inc. |
| Sector: Services & Goods | |
| SubSector: Lodging | |
| MarketCap: 3427.56 Millions | |
| Recent Price: 117.30 Smart Investing & Trading Score: 35 | |
| Day Percent Change: 0.33% Day Change: 0.39 | |
| Week Change: 0.82% Year-to-date Change: 3.5% | |
| CHH Links: Profile News Message Board | |
| Charts:- Daily , Weekly | |
| Add CHH to Watchlist: View: Get Complete CHH Trend Analysis ➞ | |
 | AMZN Amazon.com, Inc. |
| Sector: Services & Goods | |
| SubSector: Catalog & Mail Order Houses | |
| MarketCap: 998070 Millions | |
| Recent Price: 177.78 Smart Investing & Trading Score: 41 | |
| Day Percent Change: 0.31% Day Change: 0.55 | |
| Week Change: 1.8% Year-to-date Change: 17.0% | |
| AMZN Links: Profile News Message Board | |
| Charts:- Daily , Weekly | |
| Add AMZN to Watchlist: View: Get Complete AMZN Trend Analysis ➞ | |
 | ULTA Ulta Beauty, Inc. |
| Sector: Services & Goods | |
| SubSector: Specialty Retail, Other | |
| MarketCap: 9429.94 Millions | |
| Recent Price: 419.27 Smart Investing & Trading Score: 25 | |
| Day Percent Change: 0.31% Day Change: 1.29 | |
| Week Change: 1.4% Year-to-date Change: -14.4% | |
| ULTA Links: Profile News Message Board | |
| Charts:- Daily , Weekly | |
| Add ULTA to Watchlist: View: Get Complete ULTA Trend Analysis ➞ | |
 | CPNG Coupang, Inc. |
| Sector: Services & Goods | |
| SubSector: Internet Retail | |
| MarketCap: 30840 Millions | |
| Recent Price: 22.53 Smart Investing & Trading Score: 83 | |
| Day Percent Change: 0.31% Day Change: 0.07 | |
| Week Change: 2.36% Year-to-date Change: 39.1% | |
| CPNG Links: Profile News Message Board | |
| Charts:- Daily , Weekly | |
| Add CPNG to Watchlist: View: Get Complete CPNG Trend Analysis ➞ | |
 | MGA Magna International Inc. |
| Sector: Services & Goods | |
| SubSector: Auto Parts Wholesale | |
| MarketCap: 8967.3 Millions | |
| Recent Price: 49.46 Smart Investing & Trading Score: 32 | |
| Day Percent Change: 0.30% Day Change: 0.15 | |
| Week Change: 2.32% Year-to-date Change: -16.3% | |
| MGA Links: Profile News Message Board | |
| Charts:- Daily , Weekly | |
| Add MGA to Watchlist: View: Get Complete MGA Trend Analysis ➞ | |
 | EBAY eBay Inc. |
| Sector: Services & Goods | |
| SubSector: Specialty Retail, Other | |
| MarketCap: 23152.3 Millions | |
| Recent Price: 51.09 Smart Investing & Trading Score: 68 | |
| Day Percent Change: 0.29% Day Change: 0.15 | |
| Week Change: 1.39% Year-to-date Change: 17.1% | |
| EBAY Links: Profile News Message Board | |
| Charts:- Daily , Weekly | |
| Add EBAY to Watchlist: View: Get Complete EBAY Trend Analysis ➞ | |
 | IMAX IMAX Corporation |
| Sector: Services & Goods | |
| SubSector: Entertainment - Diversified | |
| MarketCap: 874.237 Millions | |
| Recent Price: 17.20 Smart Investing & Trading Score: 78 | |
| Day Percent Change: 0.29% Day Change: 0.05 | |
| Week Change: 0.41% Year-to-date Change: 14.5% | |
| IMAX Links: Profile News Message Board | |
| Charts:- Daily , Weekly | |
| Add IMAX to Watchlist: View: Get Complete IMAX Trend Analysis ➞ | |
 | ASPS Altisource Portfolio Solutions S.A. |
| Sector: Services & Goods | |
| SubSector: Business Services | |
| MarketCap: 120.382 Millions | |
| Recent Price: 1.71 Smart Investing & Trading Score: 59 | |
| Day Percent Change: 0.29% Day Change: 0.01 | |
| Week Change: 3.33% Year-to-date Change: -52.1% | |
| ASPS Links: Profile News Message Board | |
| Charts:- Daily , Weekly | |
| Add ASPS to Watchlist: View: Get Complete ASPS Trend Analysis ➞ | |
 | TGNA TEGNA Inc. |
| Sector: Services & Goods | |
| SubSector: Broadcasting - TV | |
| MarketCap: 2791.83 Millions | |
| Recent Price: 13.89 Smart Investing & Trading Score: 59 | |
| Day Percent Change: 0.29% Day Change: 0.04 | |
| Week Change: 0.51% Year-to-date Change: -9.2% | |
| TGNA Links: Profile News Message Board | |
| Charts:- Daily , Weekly | |
| Add TGNA to Watchlist: View: Get Complete TGNA Trend Analysis ➞ | |
 | AMBP Ardagh Metal Packaging S.A. |
| Sector: Services & Goods | |
| SubSector: Packaging & Containers | |
| MarketCap: 2170 Millions | |
| Recent Price: 3.64 Smart Investing & Trading Score: 74 | |
| Day Percent Change: 0.28% Day Change: 0.01 | |
| Week Change: 4.3% Year-to-date Change: -4.8% | |
| AMBP Links: Profile News Message Board | |
| Charts:- Daily , Weekly | |
| Add AMBP to Watchlist: View: Get Complete AMBP Trend Analysis ➞ | |
 | MCD McDonald s Corporation |
| Sector: Services & Goods | |
| SubSector: Restaurants | |
| MarketCap: 122481 Millions | |
| Recent Price: 276.24 Smart Investing & Trading Score: 64 | |
| Day Percent Change: 0.24% Day Change: 0.66 | |
| Week Change: 1.56% Year-to-date Change: -6.8% | |
| MCD Links: Profile News Message Board | |
| Charts:- Daily , Weekly | |
| Add MCD to Watchlist: View: Get Complete MCD Trend Analysis ➞ | |
 | MANU Manchester United plc |
| Sector: Services & Goods | |
| SubSector: Sporting Activities | |
| MarketCap: 2537.74 Millions | |
| Recent Price: 15.46 Smart Investing & Trading Score: 74 | |
| Day Percent Change: 0.23% Day Change: 0.04 | |
| Week Change: 2.35% Year-to-date Change: -24.2% | |
| MANU Links: Profile News Message Board | |
| Charts:- Daily , Weekly | |
| Add MANU to Watchlist: View: Get Complete MANU Trend Analysis ➞ | |
 | TNET TriNet Group, Inc. |
| Sector: Services & Goods | |
| SubSector: Business Services | |
| MarketCap: 2648.72 Millions | |
| Recent Price: 129.97 Smart Investing & Trading Score: 58 | |
| Day Percent Change: 0.22% Day Change: 0.28 | |
| Week Change: 1.33% Year-to-date Change: 9.3% | |
| TNET Links: Profile News Message Board | |
| Charts:- Daily , Weekly | |
| Add TNET to Watchlist: View: Get Complete TNET Trend Analysis ➞ | |
| For tabular summary view of above stock list: Summary View ➞ 0 - 25 , 25 - 50 , 50 - 75 , 75 - 100 , 100 - 125 , 125 - 150 , 150 - 175 , 175 - 200 , 200 - 225 , 225 - 250 , 250 - 275 , 275 - 300 , 300 - 325 , 325 - 350 , 350 - 375 , 375 - 400 | ||
| Click To Change The Sort Order: By Market Cap or Company Size Performance: Year-to-date, Week and Day | |
| Select Chart Type: | ||
|
Best Stocks Today 12Stocks.com |
© 2024 12Stocks.com Terms & Conditions Privacy Contact Us
All Information Provided Only For Education And Not To Be Used For Investing or Trading. See Terms & Conditions


One More Thing ... Get Best Stocks Delivered Daily!
Never Ever Miss A Move With Our Top Ten Stocks Lists
Find Best Stocks In Any Market - Bull or Bear Market
Take A Peek At Our Top Ten Stocks Lists: Daily, Weekly, Year-to-Date & Top Trends
Find Best Stocks In Any Market - Bull or Bear Market
Take A Peek At Our Top Ten Stocks Lists: Daily, Weekly, Year-to-Date & Top Trends
Consumer Services Stocks With Best Up Trends [0-bearish to 100-bullish]: Gannett Co[100], Napco Security[100], MYT Netherlands[100], Wendy s[100], ASGN [100], FTI Consulting[100], Manpower [100], Reservoir Media[100], Genuine Parts[100], Gaia [100], Hibbett Sports[95]
Best Consumer Services Stocks Year-to-Date:
U Power[2793.42%], Codere Online[145.89%], Research[96.15%], DoubleDown Interactive[56.49%], DXP Enterprises[52.39%], CRA [50.7%], Lands [43.1%], Gaia [42.59%], Williams-Sonoma [41.09%], Boot Barn[40.78%], CAVA [40.77%] Best Consumer Services Stocks This Week:
Hibbett Sports[21.34%], DoubleDown Interactive[15.86%], Noodles & [15.13%], Kohl s[11%], AMC Entertainment[9.65%], Ameresco [9.6%], Boot Barn[8.47%], Grupo Televisa[7.3%], Allbirds [7.26%], Lands [7.13%], Baozun [6.9%] Best Consumer Services Stocks Daily:
Hibbett Sports[19.08%], SES AI[16.52%], DoubleDown Interactive[8.64%], Ameresco [7.94%], U Power[6.69%], Noodles & [6.61%], Roblox [5.23%], Cross Country[5.17%], CareDx [5.02%], Wayfair [4.84%], Codere Online[4.82%]