
 Login Sign Up


| |||||
 |  | ||||

| 12Stocks.com Market Intelligence |
Best Consumer Services Stocks
| In a hurry? Services & Goods Stocks: Performance Trends Table, Stock Charts
Sort Consumer Services: Daily, Weekly, Year-to-Date, Market Cap & Trends. Filter Services & Goods stocks list by size: All Large Mid-Range Small |
| 12Stocks.com Consumer Services Stocks Performances & Trends Daily | |||||||||
|
|  The overall Smart Investing & Trading Score is 13 (0-bearish to 100-bullish) which puts Consumer Services sector in short term bearish trend. The Smart Investing & Trading Score from previous trading session is 26 and a deterioration of trend continues.
| ||||||||
Here are the Smart Investing & Trading Scores of the most requested Consumer Services stocks at 12Stocks.com (click stock name for detailed review):
|


| Consider signing up for our daily 12Stocks.com "Best Stocks Newsletter". You will never ever miss a big stock move again! |
| 12Stocks.com: Investing in Consumer Services sector with Stocks | |
|
The following table helps investors and traders sort through current performance and trends (as measured by Smart Investing & Trading Score) of various
stocks in the Consumer Services sector. Quick View: Move mouse or cursor over stock symbol (ticker) to view short-term Technical chart and over stock name to view long term chart. Click on  to add stock symbol to your watchlist and to add stock symbol to your watchlist and  to view watchlist. Click on any ticker or stock name for detailed market intelligence report for that stock. to view watchlist. Click on any ticker or stock name for detailed market intelligence report for that stock. |
12Stocks.com Performance of Stocks in Consumer Services Sector
| Ticker | Stock Name | Watchlist | Category | Recent Price | Smart Investing & Trading Score | Change % | YTD Change% |
| TDUP | ThredUp |   | Internet Retail | 1.55 | 25 | 0.97 | -31.19% |
| ASO | Academy Sports | | Specialty Retail | 57.06 | 17 | 0.96 | -13.57% |
| JWN | Nordstrom | | Apparel | 18.92 | 68 | 0.96 | 2.55% |
| RHI | Robert Half | | Staffing | 70.23 | 18 | 0.96 | -20.12% |
| COOK | Traeger | | Furnishings, Fixtures & Appliances | 2.11 | 15 | 0.96 | -25.31% |
| ANF | Abercrombie & Fitch Co | | Apparel | 110.36 | 36 | 0.95 | 25.10% |
| CBZ | CBIZ | | Services | 74.92 | 51 | 0.94 | 19.70% |
| MGM | MGM Resorts | | Casinos | 42.42 | 18 | 0.90 | -5.06% |
| GPI | 1 | | Automobile | 265.53 | 36 | 0.90 | -12.87% |
| EBAY | eBay | | Retail | 50.39 | 61 | 0.88 | 15.52% |
| GHC | Graham | | Education | 704.35 | 18 | 0.88 | 1.12% |
| WH | Wyndham Hotels | | Lodging | 69.92 | 10 | 0.88 | -13.05% |
| BCO | Brink s | | Security | 87.04 | 56 | 0.87 | -1.03% |
| KBR | KBR | | Services | 62.67 | 68 | 0.87 | 13.10% |
| REYN | Reynolds Consumer | | Packaging | 28.19 | 54 | 0.86 | 5.03% |
| NDLS | Noodles & | | Restaurants | 1.19 | 10 | 0.85 | -62.22% |
| CHGG | Chegg | | Education | 7.09 | 47 | 0.85 | -37.59% |
| ACTG | Acacia Research | | Services | 4.88 | 54 | 0.83 | 24.49% |
| LQDT | Liquidity Services | | Retail | 17.05 | 17 | 0.83 | -0.93% |
| DFIN | Donnelley Financial | | Services | 62.22 | 70 | 0.83 | -0.24% |
| BBSI | Barrett Business | | Staffing | 122.35 | 63 | 0.82 | 5.66% |
| PGRU | PropertyGuru | | Internet Content & Information | 3.73 | 43 | 0.81 | 11.18% |
| SCI | Service | | Services | 68.79 | 44 | 0.78 | 0.50% |
| VSEC | VSE | | Services | 75.68 | 41 | 0.77 | 17.13% |
| TJX | TJX | | Department | 93.36 | 18 | 0.76 | -0.48% |
| For chart view version of above stock list: Chart View ➞ 0 - 25 , 25 - 50 , 50 - 75 , 75 - 100 , 100 - 125 , 125 - 150 , 150 - 175 , 175 - 200 , 200 - 225 , 225 - 250 , 250 - 275 , 275 - 300 , 300 - 325 , 325 - 350 , 350 - 375 , 375 - 400 , 400 - 425 , 425 - 450 , 450 - 475 | ||
 | Click To Change The Sort Order: By Market Cap or Company Size Performance: Year-to-date, Week and Day |  |
|
Get the most comprehensive stock market coverage daily at 12Stocks.com ➞ Best Stocks Today ➞ Best Stocks Weekly ➞ Best Stocks Year-to-Date ➞ Best Stocks Trends ➞  Best Stocks Today 12Stocks.com Best Nasdaq Stocks ➞ Best S&P 500 Stocks ➞ Best Tech Stocks ➞ Best Biotech Stocks ➞ |
| Detailed Overview of Consumer Services Stocks |
| Consumer Services Technical Overview, Leaders & Laggards, Top Consumer Services ETF Funds & Detailed Consumer Services Stocks List, Charts, Trends & More |
| Consumer Services Sector: Technical Analysis, Trends & YTD Performance | |
| Consumer Services sector is composed of stocks
from retail, entertainment, media/publishing, consumer goods
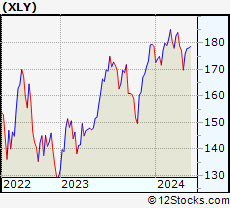
and services subsectors. Consumer Services sector, as represented by XLY, an exchange-traded fund [ETF] that holds basket of Consumer Services stocks (e.g, Walmart, Alibaba) is down by -5.06% and is currently underperforming the overall market by -8.44% year-to-date. Below is a quick view of Technical charts and trends: |
|
 XLY Weekly Chart |
|
| Long Term Trend: Not Good | |
| Medium Term Trend: Not Good | |
 XLY Daily Chart |
|
| Short Term Trend: Not Good | |
| Overall Trend Score: 13 | |
| YTD Performance: -5.06% | |
| **Trend Scores & Views Are Only For Educational Purposes And Not For Investing | |
| 12Stocks.com: Top Performing Consumer Services Sector Stocks | ||||||||||||||||||||||||||||||||||||||||||||||||
 The top performing Consumer Services sector stocks year to date are
Now, more recently, over last week, the top performing Consumer Services sector stocks on the move are


|
||||||||||||||||||||||||||||||||||||||||||||||||
| 12Stocks.com: Investing in Consumer Services Sector using Exchange Traded Funds | |
|
The following table shows list of key exchange traded funds (ETF) that
help investors track Consumer Services Index. For detailed view, check out our ETF Funds section of our website. Quick View: Move mouse or cursor over ETF symbol (ticker) to view short-term Technical chart and over ETF name to view long term chart. Click on ticker or stock name for detailed view. Click on to add stock symbol to your watchlist and to view watchlist. |
12Stocks.com List of ETFs that track Consumer Services Index
| Ticker | ETF Name | Watchlist | Recent Price | Smart Investing & Trading Score | Change % | Week % | Year-to-date % |
| XLY | Consumer Discret Sel | | 169.76 | 13 | -0.88 | -4.15 | -5.06% |
| RTH | Retail | | 198.08 | 44 | -0.28 | -1.79 | 5.23% |
| IYC | Consumer Services | | 76.27 | 36 | -1.03 | -3.69 | 0.66% |
| XRT | Retail | | 71.17 | 51 | 0.68 | -0.99 | -1.59% |
| IYK | Consumer Goods | | 65.81 | 60 | 1.29 | 2.57 | 2.98% |
| UCC | Consumer Services | | 31.53 | 20 | -3.40 | -8.42 | -12.19% |
| RETL | Retail Bull 3X | | 8.12 | 41 | 2.14 | -3.45 | -10.96% |
| RXI | Globl Consumer Discretionary | | 157.15 | 44 | -0.19 | -2.26 | -1.2% |
| SCC | Short Consumer Services | | 17.08 | 100 | 2.89 | 9.72 | 11.46% |
| UGE | Consumer Goods | | 16.53 | 73 | 1.66 | 2.11 | 5.01% |
| 12Stocks.com: Charts, Trends, Fundamental Data and Performances of Consumer Services Stocks | |
|
We now take in-depth look at all Consumer Services stocks including charts, multi-period performances and overall trends (as measured by Smart Investing & Trading Score). One can sort Consumer Services stocks (click link to choose) by Daily, Weekly and by Year-to-Date performances. Also, one can sort by size of the company or by market capitalization. |
| Select Your Default Chart Type: | |||||
| |||||
| Click on stock symbol or name for detailed view. Click on to add stock symbol to your watchlist and to view watchlist. Quick View: Move mouse or cursor over "Daily" to quickly view daily Technical stock chart and over "Weekly" to view weekly Technical stock chart. | |||||

 | TDUP ThredUp Inc. |
| Sector: Services & Goods | |
| SubSector: Internet Retail | |
| MarketCap: 258 Millions | |
| Recent Price: 1.55 Smart Investing & Trading Score: 25 | |
| Day Percent Change: 0.97% Day Change: 0.01 | |
| Week Change: -6.89% Year-to-date Change: -31.2% | |
| TDUP Links: Profile News Message Board | |
| Charts:- Daily , Weekly | |
| Add TDUP to Watchlist: View: Get Complete TDUP Trend Analysis ➞ | |
 | ASO Academy Sports and Outdoors, Inc. |
| Sector: Services & Goods | |
| SubSector: Specialty Retail | |
| MarketCap: 16027 Millions | |
| Recent Price: 57.06 Smart Investing & Trading Score: 17 | |
| Day Percent Change: 0.96% Day Change: 0.55 | |
| Week Change: -3.33% Year-to-date Change: -13.6% | |
| ASO Links: Profile News Message Board | |
| Charts:- Daily , Weekly | |
| Add ASO to Watchlist: View: Get Complete ASO Trend Analysis ➞ | |
 | JWN Nordstrom, Inc. |
| Sector: Services & Goods | |
| SubSector: Apparel Stores | |
| MarketCap: 3351.68 Millions | |
| Recent Price: 18.92 Smart Investing & Trading Score: 68 | |
| Day Percent Change: 0.96% Day Change: 0.18 | |
| Week Change: -0.73% Year-to-date Change: 2.6% | |
| JWN Links: Profile News Message Board | |
| Charts:- Daily , Weekly | |
| Add JWN to Watchlist: View: Get Complete JWN Trend Analysis ➞ | |
 | RHI Robert Half International Inc. |
| Sector: Services & Goods | |
| SubSector: Staffing & Outsourcing Services | |
| MarketCap: 4302 Millions | |
| Recent Price: 70.23 Smart Investing & Trading Score: 18 | |
| Day Percent Change: 0.96% Day Change: 0.67 | |
| Week Change: -2.55% Year-to-date Change: -20.1% | |
| RHI Links: Profile News Message Board | |
| Charts:- Daily , Weekly | |
| Add RHI to Watchlist: View: Get Complete RHI Trend Analysis ➞ | |
 | COOK Traeger, Inc. |
| Sector: Services & Goods | |
| SubSector: Furnishings, Fixtures & Appliances | |
| MarketCap: 524 Millions | |
| Recent Price: 2.11 Smart Investing & Trading Score: 15 | |
| Day Percent Change: 0.96% Day Change: 0.02 | |
| Week Change: -2.31% Year-to-date Change: -25.3% | |
| COOK Links: Profile News Message Board | |
| Charts:- Daily , Weekly | |
| Add COOK to Watchlist: View: Get Complete COOK Trend Analysis ➞ | |
 | ANF Abercrombie & Fitch Co. |
| Sector: Services & Goods | |
| SubSector: Apparel Stores | |
| MarketCap: 589.108 Millions | |
| Recent Price: 110.36 Smart Investing & Trading Score: 36 | |
| Day Percent Change: 0.95% Day Change: 1.04 | |
| Week Change: -1.31% Year-to-date Change: 25.1% | |
| ANF Links: Profile News Message Board | |
| Charts:- Daily , Weekly | |
| Add ANF to Watchlist: View: Get Complete ANF Trend Analysis ➞ | |
 | CBZ CBIZ, Inc. |
| Sector: Services & Goods | |
| SubSector: Business Services | |
| MarketCap: 1121.32 Millions | |
| Recent Price: 74.92 Smart Investing & Trading Score: 51 | |
| Day Percent Change: 0.94% Day Change: 0.70 | |
| Week Change: 1.23% Year-to-date Change: 19.7% | |
| CBZ Links: Profile News Message Board | |
| Charts:- Daily , Weekly | |
| Add CBZ to Watchlist: View: Get Complete CBZ Trend Analysis ➞ | |
 | MGM MGM Resorts International |
| Sector: Services & Goods | |
| SubSector: Resorts & Casinos | |
| MarketCap: 5315.04 Millions | |
| Recent Price: 42.42 Smart Investing & Trading Score: 18 | |
| Day Percent Change: 0.90% Day Change: 0.38 | |
| Week Change: -0.14% Year-to-date Change: -5.1% | |
| MGM Links: Profile News Message Board | |
| Charts:- Daily , Weekly | |
| Add MGM to Watchlist: View: Get Complete MGM Trend Analysis ➞ | |
 | GPI Group 1 Automotive, Inc. |
| Sector: Services & Goods | |
| SubSector: Auto Dealerships | |
| MarketCap: 921.021 Millions | |
| Recent Price: 265.53 Smart Investing & Trading Score: 36 | |
| Day Percent Change: 0.90% Day Change: 2.37 | |
| Week Change: -1.45% Year-to-date Change: -12.9% | |
| GPI Links: Profile News Message Board | |
| Charts:- Daily , Weekly | |
| Add GPI to Watchlist: View: Get Complete GPI Trend Analysis ➞ | |
 | EBAY eBay Inc. |
| Sector: Services & Goods | |
| SubSector: Specialty Retail, Other | |
| MarketCap: 23152.3 Millions | |
| Recent Price: 50.39 Smart Investing & Trading Score: 61 | |
| Day Percent Change: 0.88% Day Change: 0.44 | |
| Week Change: -1.79% Year-to-date Change: 15.5% | |
| EBAY Links: Profile News Message Board | |
| Charts:- Daily , Weekly | |
| Add EBAY to Watchlist: View: Get Complete EBAY Trend Analysis ➞ | |
 | GHC Graham Holdings Company |
| Sector: Services & Goods | |
| SubSector: Education & Training Services | |
| MarketCap: 1871.06 Millions | |
| Recent Price: 704.35 Smart Investing & Trading Score: 18 | |
| Day Percent Change: 0.88% Day Change: 6.17 | |
| Week Change: -1.67% Year-to-date Change: 1.1% | |
| GHC Links: Profile News Message Board | |
| Charts:- Daily , Weekly | |
| Add GHC to Watchlist: View: Get Complete GHC Trend Analysis ➞ | |
 | WH Wyndham Hotels & Resorts, Inc. |
| Sector: Services & Goods | |
| SubSector: Lodging | |
| MarketCap: 2656.66 Millions | |
| Recent Price: 69.92 Smart Investing & Trading Score: 10 | |
| Day Percent Change: 0.88% Day Change: 0.61 | |
| Week Change: -3.12% Year-to-date Change: -13.1% | |
| WH Links: Profile News Message Board | |
| Charts:- Daily , Weekly | |
| Add WH to Watchlist: View: Get Complete WH Trend Analysis ➞ | |
 | BCO The Brink s Company |
| Sector: Services & Goods | |
| SubSector: Security & Protection Services | |
| MarketCap: 2544.73 Millions | |
| Recent Price: 87.04 Smart Investing & Trading Score: 56 | |
| Day Percent Change: 0.87% Day Change: 0.75 | |
| Week Change: 0.08% Year-to-date Change: -1.0% | |
| BCO Links: Profile News Message Board | |
| Charts:- Daily , Weekly | |
| Add BCO to Watchlist: View: Get Complete BCO Trend Analysis ➞ | |
 | KBR KBR, Inc. |
| Sector: Services & Goods | |
| SubSector: Technical Services | |
| MarketCap: 2526.1 Millions | |
| Recent Price: 62.67 Smart Investing & Trading Score: 68 | |
| Day Percent Change: 0.87% Day Change: 0.54 | |
| Week Change: -0.11% Year-to-date Change: 13.1% | |
| KBR Links: Profile News Message Board | |
| Charts:- Daily , Weekly | |
| Add KBR to Watchlist: View: Get Complete KBR Trend Analysis ➞ | |
 | REYN Reynolds Consumer Products Inc. |
| Sector: Services & Goods | |
| SubSector: Packaging & Containers | |
| MarketCap: 62927 Millions | |
| Recent Price: 28.19 Smart Investing & Trading Score: 54 | |
| Day Percent Change: 0.86% Day Change: 0.24 | |
| Week Change: -0.25% Year-to-date Change: 5.0% | |
| REYN Links: Profile News Message Board | |
| Charts:- Daily , Weekly | |
| Add REYN to Watchlist: View: Get Complete REYN Trend Analysis ➞ | |
 | NDLS Noodles & Company |
| Sector: Services & Goods | |
| SubSector: Restaurants | |
| MarketCap: 188.77 Millions | |
| Recent Price: 1.19 Smart Investing & Trading Score: 10 | |
| Day Percent Change: 0.85% Day Change: 0.01 | |
| Week Change: -21.19% Year-to-date Change: -62.2% | |
| NDLS Links: Profile News Message Board | |
| Charts:- Daily , Weekly | |
| Add NDLS to Watchlist: View: Get Complete NDLS Trend Analysis ➞ | |
 | CHGG Chegg, Inc. |
| Sector: Services & Goods | |
| SubSector: Education & Training Services | |
| MarketCap: 3606.86 Millions | |
| Recent Price: 7.09 Smart Investing & Trading Score: 47 | |
| Day Percent Change: 0.85% Day Change: 0.06 | |
| Week Change: -0.84% Year-to-date Change: -37.6% | |
| CHGG Links: Profile News Message Board | |
| Charts:- Daily , Weekly | |
| Add CHGG to Watchlist: View: Get Complete CHGG Trend Analysis ➞ | |
 | ACTG Acacia Research Corporation |
| Sector: Services & Goods | |
| SubSector: Business Services | |
| MarketCap: 112.782 Millions | |
| Recent Price: 4.88 Smart Investing & Trading Score: 54 | |
| Day Percent Change: 0.83% Day Change: 0.04 | |
| Week Change: -2.79% Year-to-date Change: 24.5% | |
| ACTG Links: Profile News Message Board | |
| Charts:- Daily , Weekly | |
| Add ACTG to Watchlist: View: Get Complete ACTG Trend Analysis ➞ | |
 | LQDT Liquidity Services, Inc. |
| Sector: Services & Goods | |
| SubSector: Catalog & Mail Order Houses | |
| MarketCap: 144.492 Millions | |
| Recent Price: 17.05 Smart Investing & Trading Score: 17 | |
| Day Percent Change: 0.83% Day Change: 0.14 | |
| Week Change: -4.8% Year-to-date Change: -0.9% | |
| LQDT Links: Profile News Message Board | |
| Charts:- Daily , Weekly | |
| Add LQDT to Watchlist: View: Get Complete LQDT Trend Analysis ➞ | |
 | DFIN Donnelley Financial Solutions, Inc. |
| Sector: Services & Goods | |
| SubSector: Business Services | |
| MarketCap: 229.882 Millions | |
| Recent Price: 62.22 Smart Investing & Trading Score: 70 | |
| Day Percent Change: 0.83% Day Change: 0.51 | |
| Week Change: 0.11% Year-to-date Change: -0.2% | |
| DFIN Links: Profile News Message Board | |
| Charts:- Daily , Weekly | |
| Add DFIN to Watchlist: View: Get Complete DFIN Trend Analysis ➞ | |
 | BBSI Barrett Business Services, Inc. |
| Sector: Services & Goods | |
| SubSector: Staffing & Outsourcing Services | |
| MarketCap: 262.028 Millions | |
| Recent Price: 122.35 Smart Investing & Trading Score: 63 | |
| Day Percent Change: 0.82% Day Change: 0.99 | |
| Week Change: 1.78% Year-to-date Change: 5.7% | |
| BBSI Links: Profile News Message Board | |
| Charts:- Daily , Weekly | |
| Add BBSI to Watchlist: View: Get Complete BBSI Trend Analysis ➞ | |
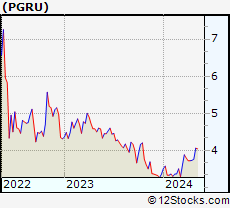 | PGRU PropertyGuru Group Limited |
| Sector: Services & Goods | |
| SubSector: Internet Content & Information | |
| MarketCap: 720 Millions | |
| Recent Price: 3.73 Smart Investing & Trading Score: 43 | |
| Day Percent Change: 0.81% Day Change: 0.03 | |
| Week Change: 0.27% Year-to-date Change: 11.2% | |
| PGRU Links: Profile News Message Board | |
| Charts:- Daily , Weekly | |
| Add PGRU to Watchlist: View: Get Complete PGRU Trend Analysis ➞ | |
 | SCI Service Corporation International |
| Sector: Services & Goods | |
| SubSector: Personal Services | |
| MarketCap: 7216.05 Millions | |
| Recent Price: 68.79 Smart Investing & Trading Score: 44 | |
| Day Percent Change: 0.78% Day Change: 0.53 | |
| Week Change: -1.46% Year-to-date Change: 0.5% | |
| SCI Links: Profile News Message Board | |
| Charts:- Daily , Weekly | |
| Add SCI to Watchlist: View: Get Complete SCI Trend Analysis ➞ | |
 | VSEC VSE Corporation |
| Sector: Services & Goods | |
| SubSector: Technical Services | |
| MarketCap: 183.61 Millions | |
| Recent Price: 75.68 Smart Investing & Trading Score: 41 | |
| Day Percent Change: 0.77% Day Change: 0.58 | |
| Week Change: -3.12% Year-to-date Change: 17.1% | |
| VSEC Links: Profile News Message Board | |
| Charts:- Daily , Weekly | |
| Add VSEC to Watchlist: View: Get Complete VSEC Trend Analysis ➞ | |
 | TJX The TJX Companies, Inc. |
| Sector: Services & Goods | |
| SubSector: Department Stores | |
| MarketCap: 50656.2 Millions | |
| Recent Price: 93.36 Smart Investing & Trading Score: 18 | |
| Day Percent Change: 0.76% Day Change: 0.70 | |
| Week Change: -1.12% Year-to-date Change: -0.5% | |
| TJX Links: Profile News Message Board | |
| Charts:- Daily , Weekly | |
| Add TJX to Watchlist: View: Get Complete TJX Trend Analysis ➞ | |
| For tabular summary view of above stock list: Summary View ➞ 0 - 25 , 25 - 50 , 50 - 75 , 75 - 100 , 100 - 125 , 125 - 150 , 150 - 175 , 175 - 200 , 200 - 225 , 225 - 250 , 250 - 275 , 275 - 300 , 300 - 325 , 325 - 350 , 350 - 375 , 375 - 400 , 400 - 425 , 425 - 450 , 450 - 475 | ||
| Click To Change The Sort Order: By Market Cap or Company Size Performance: Year-to-date, Week and Day | |
| Select Chart Type: | ||
|
Best Stocks Today 12Stocks.com |
© 2024 12Stocks.com Terms & Conditions Privacy Contact Us
All Information Provided Only For Education And Not To Be Used For Investing or Trading. See Terms & Conditions


One More Thing ... Get Best Stocks Delivered Daily!
Never Ever Miss A Move With Our Top Ten Stocks Lists
Find Best Stocks In Any Market - Bull or Bear Market
Take A Peek At Our Top Ten Stocks Lists: Daily, Weekly, Year-to-Date & Top Trends
Find Best Stocks In Any Market - Bull or Bear Market
Take A Peek At Our Top Ten Stocks Lists: Daily, Weekly, Year-to-Date & Top Trends
Consumer Services Stocks With Best Up Trends [0-bearish to 100-bullish]: Gannett Co[100], Gaia [100], Genuine Parts[100], Wendy s[100], ContextLogic [95], Biglari [95], Envestnet [93], MYT Netherlands[93], PaySign [93], Weis Markets[93], FTI Consulting[93]
Best Consumer Services Stocks Year-to-Date:
U Power[2768.3%], Vroom [1713.36%], Yatsen Holding[394.12%], Fluent [294.03%], Codere Online[138.01%], Research[96.15%], Sweetgreen [82.74%], Bright Scholar[60.8%], PaySign [55.71%], RealReal [54.73%], DXP Enterprises[49.76%] Best Consumer Services Stocks This Week:
Yatsen Holding[20.1%], ContextLogic [20%], AMC Entertainment[19.25%], Secoo Holding[17.14%], E.W. Scripps[12.19%], TH [11.82%], Genuine Parts[11.7%], Winmark [11.67%], Advance Auto[11.62%], Altisource Portfolio[11.49%], Envestnet [10.52%] Best Consumer Services Stocks Daily:
Lanvin [11.19%], Allego N.V[8.91%], AMC Entertainment[8.22%], Vision Marine[7.40%], Cumulus Media[7.17%], Altisource Portfolio[7.14%], Urban One[6.92%], Bright Scholar[6.91%], Red Robin[6.67%], Entravision [6.06%], MOGU [5.85%]