
 Login Sign Up


| |||||
 |  | ||||

| 12Stocks.com Market Intelligence |
Best Consumer Services Stocks
| In a hurry? Services & Goods Stocks: Performance Trends Table, Stock Charts
Sort Consumer Services: Daily, Weekly, Year-to-Date, Market Cap & Trends. Filter Services & Goods stocks list by size: All Large Mid-Range Small |
| 12Stocks.com Consumer Services Stocks Performances & Trends Daily | |||||||||
|
|  The overall Smart Investing & Trading Score is 13 (0-bearish to 100-bullish) which puts Consumer Services sector in short term bearish trend. The Smart Investing & Trading Score from previous trading session is 26 and a deterioration of trend continues.
| ||||||||
Here are the Smart Investing & Trading Scores of the most requested Consumer Services stocks at 12Stocks.com (click stock name for detailed review):
|


| Consider signing up for our daily 12Stocks.com "Best Stocks Newsletter". You will never ever miss a big stock move again! |
| 12Stocks.com: Investing in Consumer Services sector with Stocks | |
|
The following table helps investors and traders sort through current performance and trends (as measured by Smart Investing & Trading Score) of various
stocks in the Consumer Services sector. Quick View: Move mouse or cursor over stock symbol (ticker) to view short-term Technical chart and over stock name to view long term chart. Click on  to add stock symbol to your watchlist and to add stock symbol to your watchlist and  to view watchlist. Click on any ticker or stock name for detailed market intelligence report for that stock. to view watchlist. Click on any ticker or stock name for detailed market intelligence report for that stock. |
12Stocks.com Performance of Stocks in Consumer Services Sector
| Ticker | Stock Name | Watchlist | Category | Recent Price | Smart Investing & Trading Score | Change % | YTD Change% |
| LESL | Leslies |   | Home Improvement Retail | 4.43 | 32 | 0.34% | -35.91% |
| LVS | Las Vegas | | Casinos | 45.46 | 0 | -0.92% | -7.62% |
| MCO | Moody s | | Services | 374.67 | 25 | 0.02% | -4.07% |
| PTVE | Pactiv Evergreen | | Packaging | 14.41 | 40 | 1.91% | 5.03% |
| BQ | Boqii Holding | | Specialty Retail | 0.27 | 54 | 3.47% | -40.02% |
| XPEV | XPeng | | Auto Manufacturers | 7.04 | 10 | -1.74% | -51.71% |
| MBLY | Mobileye Global | | Auto Parts | 30.23 | 49 | -2.29% | -30.29% |
| TRI | Thomson Reuters | | Publishing | 150.22 | 26 | -0.38% | 2.74% |
| CPNG | Coupang | | Internet Retail | 22.01 | 68 | -1.30% | 35.86% |
| TAL | TAL Education | | Education | 11.43 | 73 | -1.89% | -9.50% |
| LI | Li Auto | | Auto Manufacturers | 27.21 | 0 | -6.78% | -27.32% |
| QRTEP | Qurate Retail | | Internet Retail | 46.10 | 63 | 3.02% | 27.52% |
| KR | Kroger Co | | Grocery | 56.57 | 68 | 1.80% | 23.76% |
| MAR | Marriott | | Lodging | 236.00 | 0 | -0.13% | 4.65% |
| RBLX | Roblox | | Electronic Gaming & Multimedia | 35.34 | 0 | -3.15% | -23.42% |
| ROST | Ross Stores | | Apparel | 133.34 | 18 | 1.17% | -3.65% |
| MELI | MercadoLibre | | Retail | 1356.43 | 0 | -1.01% | -13.69% |
| SPOT | Spotify Technology | | Broadcasting | 275.83 | 51 | -4.62% | 46.79% |
| FOX | Twenty-First Century | | Entertainment | 28.87 | 74 | 2.05% | 4.41% |
| MCK | McKesson | | Pharmacy | 524.83 | 44 | 1.16% | 13.36% |
| EBAY | eBay | | Retail | 50.39 | 61 | 0.88% | 15.52% |
| ORLY | O Reilly | | Auto Parts | 1090.94 | 44 | -0.92% | 14.83% |
| VRSK | Verisk Analytics | | Services | 222.52 | 18 | -0.36% | -6.84% |
| DLTR | Dollar Tree | | Retail | 122.03 | 10 | -0.16% | -14.09% |
| SIRI | Sirius XM | | Broadcasting | 3.09 | 20 | 0.98% | -43.51% |
| For chart view version of above stock list: Chart View ➞ 0 - 25 , 25 - 50 , 50 - 75 , 75 - 100 , 100 - 125 , 125 - 150 , 150 - 175 , 175 - 200 , 200 - 225 , 225 - 250 , 250 - 275 , 275 - 300 , 300 - 325 , 325 - 350 , 350 - 375 , 375 - 400 , 400 - 425 , 425 - 450 , 450 - 475 | ||
 | Click To Change The Sort Order: By Market Cap or Company Size Performance: Year-to-date, Week and Day |  |
|
Get the most comprehensive stock market coverage daily at 12Stocks.com ➞ Best Stocks Today ➞ Best Stocks Weekly ➞ Best Stocks Year-to-Date ➞ Best Stocks Trends ➞  Best Stocks Today 12Stocks.com Best Nasdaq Stocks ➞ Best S&P 500 Stocks ➞ Best Tech Stocks ➞ Best Biotech Stocks ➞ |
| Detailed Overview of Consumer Services Stocks |
| Consumer Services Technical Overview, Leaders & Laggards, Top Consumer Services ETF Funds & Detailed Consumer Services Stocks List, Charts, Trends & More |
| Consumer Services Sector: Technical Analysis, Trends & YTD Performance | |
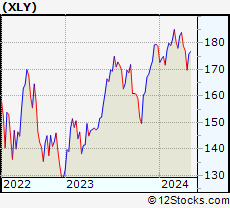
| Consumer Services sector is composed of stocks
from retail, entertainment, media/publishing, consumer goods
and services subsectors. Consumer Services sector, as represented by XLY, an exchange-traded fund [ETF] that holds basket of Consumer Services stocks (e.g, Walmart, Alibaba) is down by -5.06% and is currently underperforming the overall market by -8.44% year-to-date. Below is a quick view of Technical charts and trends: |
|
 XLY Weekly Chart |
|
| Long Term Trend: Not Good | |
| Medium Term Trend: Not Good | |
 XLY Daily Chart |
|
| Short Term Trend: Not Good | |
| Overall Trend Score: 13 | |
| YTD Performance: -5.06% | |
| **Trend Scores & Views Are Only For Educational Purposes And Not For Investing | |
| 12Stocks.com: Top Performing Consumer Services Sector Stocks | ||||||||||||||||||||||||||||||||||||||||||||||||
 The top performing Consumer Services sector stocks year to date are
Now, more recently, over last week, the top performing Consumer Services sector stocks on the move are


|
||||||||||||||||||||||||||||||||||||||||||||||||
| 12Stocks.com: Investing in Consumer Services Sector using Exchange Traded Funds | |
|
The following table shows list of key exchange traded funds (ETF) that
help investors track Consumer Services Index. For detailed view, check out our ETF Funds section of our website. Quick View: Move mouse or cursor over ETF symbol (ticker) to view short-term Technical chart and over ETF name to view long term chart. Click on ticker or stock name for detailed view. Click on to add stock symbol to your watchlist and to view watchlist. |
12Stocks.com List of ETFs that track Consumer Services Index
| Ticker | ETF Name | Watchlist | Recent Price | Smart Investing & Trading Score | Change % | Week % | Year-to-date % |
| XLY | Consumer Discret Sel | | 169.76 | 13 | -0.88 | -4.15 | -5.06% |
| RTH | Retail | | 198.63 | 44 | 0.00 | -1.52 | 5.53% |
| IYC | Consumer Services | | 76.27 | 26 | -1.03 | -3.69 | 0.66% |
| XRT | Retail | | 71.17 | 51 | 0.68 | -0.99 | -1.59% |
| IYK | Consumer Goods | | 65.81 | 75 | 1.29 | 2.57 | 2.98% |
| UCC | Consumer Services | | 31.58 | 20 | -3.26 | -8.28 | -12.06% |
| RETL | Retail Bull 3X | | 8.12 | 49 | 2.14 | -3.45 | -10.96% |
| RXI | Globl Consumer Discretionary | | 157.15 | 44 | -0.19 | -2.26 | -1.2% |
| SCC | Short Consumer Services | | 16.95 | 100 | 2.13 | 8.91 | 10.64% |
| UGE | Consumer Goods | | 16.63 | 73 | 2.26 | 2.71 | 5.63% |
| 12Stocks.com: Charts, Trends, Fundamental Data and Performances of Consumer Services Stocks | |
|
We now take in-depth look at all Consumer Services stocks including charts, multi-period performances and overall trends (as measured by Smart Investing & Trading Score). One can sort Consumer Services stocks (click link to choose) by Daily, Weekly and by Year-to-Date performances. Also, one can sort by size of the company or by market capitalization. |
| Select Your Default Chart Type: | |||||
| |||||
| Click on stock symbol or name for detailed view. Click on to add stock symbol to your watchlist and to view watchlist. Quick View: Move mouse or cursor over "Daily" to quickly view daily Technical stock chart and over "Weekly" to view weekly Technical stock chart. | |||||

 | LESL Leslies, Inc. |
| Sector: Services & Goods | |
| SubSector: Home Improvement Retail | |
| MarketCap: 37927 Millions | |
| Recent Price: 4.43 Smart Investing & Trading Score: 32 | |
| Day Percent Change: 0.34% Day Change: 0.01 | |
| Week Change: -3.38% Year-to-date Change: -35.9% | |
| LESL Links: Profile News Message Board | |
| Charts:- Daily , Weekly | |
| Add LESL to Watchlist: View: Get Complete LESL Trend Analysis ➞ | |
 | LVS Las Vegas Sands Corp. |
| Sector: Services & Goods | |
| SubSector: Resorts & Casinos | |
| MarketCap: 36431.6 Millions | |
| Recent Price: 45.46 Smart Investing & Trading Score: 0 | |
| Day Percent Change: -0.92% Day Change: -0.42 | |
| Week Change: -9.86% Year-to-date Change: -7.6% | |
| LVS Links: Profile News Message Board | |
| Charts:- Daily , Weekly | |
| Add LVS to Watchlist: View: Get Complete LVS Trend Analysis ➞ | |
 | MCO Moody s Corporation |
| Sector: Services & Goods | |
| SubSector: Business Services | |
| MarketCap: 35998.5 Millions | |
| Recent Price: 374.67 Smart Investing & Trading Score: 25 | |
| Day Percent Change: 0.02% Day Change: 0.07 | |
| Week Change: -0.66% Year-to-date Change: -4.1% | |
| MCO Links: Profile News Message Board | |
| Charts:- Daily , Weekly | |
| Add MCO to Watchlist: View: Get Complete MCO Trend Analysis ➞ | |
 | PTVE Pactiv Evergreen Inc. |
| Sector: Services & Goods | |
| SubSector: Packaging & Containers | |
| MarketCap: 33427 Millions | |
| Recent Price: 14.41 Smart Investing & Trading Score: 40 | |
| Day Percent Change: 1.91% Day Change: 0.27 | |
| Week Change: 0.49% Year-to-date Change: 5.0% | |
| PTVE Links: Profile News Message Board | |
| Charts:- Daily , Weekly | |
| Add PTVE to Watchlist: View: Get Complete PTVE Trend Analysis ➞ | |
 | BQ Boqii Holding Limited |
| Sector: Services & Goods | |
| SubSector: Specialty Retail | |
| MarketCap: 33027 Millions | |
| Recent Price: 0.27 Smart Investing & Trading Score: 54 | |
| Day Percent Change: 3.47% Day Change: 0.01 | |
| Week Change: 5.07% Year-to-date Change: -40.0% | |
| BQ Links: Profile News Message Board | |
| Charts:- Daily , Weekly | |
| Add BQ to Watchlist: View: Get Complete BQ Trend Analysis ➞ | |
 | XPEV XPeng Inc. |
| Sector: Services & Goods | |
| SubSector: Auto Manufacturers | |
| MarketCap: 32917 Millions | |
| Recent Price: 7.04 Smart Investing & Trading Score: 10 | |
| Day Percent Change: -1.74% Day Change: -0.13 | |
| Week Change: -5.56% Year-to-date Change: -51.7% | |
| XPEV Links: Profile News Message Board | |
| Charts:- Daily , Weekly | |
| Add XPEV to Watchlist: View: Get Complete XPEV Trend Analysis ➞ | |
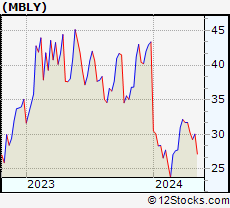 | MBLY Mobileye Global Inc. |
| Sector: Services & Goods | |
| SubSector: Auto Parts | |
| MarketCap: 31280 Millions | |
| Recent Price: 30.23 Smart Investing & Trading Score: 49 | |
| Day Percent Change: -2.29% Day Change: -0.71 | |
| Week Change: -4.7% Year-to-date Change: -30.3% | |
| MBLY Links: Profile News Message Board | |
| Charts:- Daily , Weekly | |
| Add MBLY to Watchlist: View: Get Complete MBLY Trend Analysis ➞ | |
 | TRI Thomson Reuters Corporation |
| Sector: Services & Goods | |
| SubSector: Publishing - Periodicals | |
| MarketCap: 30959.4 Millions | |
| Recent Price: 150.22 Smart Investing & Trading Score: 26 | |
| Day Percent Change: -0.38% Day Change: -0.57 | |
| Week Change: -1.42% Year-to-date Change: 2.7% | |
| TRI Links: Profile News Message Board | |
| Charts:- Daily , Weekly | |
| Add TRI to Watchlist: View: Get Complete TRI Trend Analysis ➞ | |
 | CPNG Coupang, Inc. |
| Sector: Services & Goods | |
| SubSector: Internet Retail | |
| MarketCap: 30840 Millions | |
| Recent Price: 22.01 Smart Investing & Trading Score: 68 | |
| Day Percent Change: -1.30% Day Change: -0.29 | |
| Week Change: 3.58% Year-to-date Change: 35.9% | |
| CPNG Links: Profile News Message Board | |
| Charts:- Daily , Weekly | |
| Add CPNG to Watchlist: View: Get Complete CPNG Trend Analysis ➞ | |
 | TAL TAL Education Group |
| Sector: Services & Goods | |
| SubSector: Education & Training Services | |
| MarketCap: 30103.1 Millions | |
| Recent Price: 11.43 Smart Investing & Trading Score: 73 | |
| Day Percent Change: -1.89% Day Change: -0.22 | |
| Week Change: -2.31% Year-to-date Change: -9.5% | |
| TAL Links: Profile News Message Board | |
| Charts:- Daily , Weekly | |
| Add TAL to Watchlist: View: Get Complete TAL Trend Analysis ➞ | |
 | LI Li Auto Inc. |
| Sector: Services & Goods | |
| SubSector: Auto Manufacturers | |
| MarketCap: 29167 Millions | |
| Recent Price: 27.21 Smart Investing & Trading Score: 0 | |
| Day Percent Change: -6.78% Day Change: -1.98 | |
| Week Change: -7.42% Year-to-date Change: -27.3% | |
| LI Links: Profile News Message Board | |
| Charts:- Daily , Weekly | |
| Add LI to Watchlist: View: Get Complete LI Trend Analysis ➞ | |
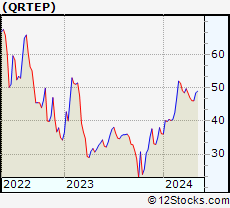 | QRTEP Qurate Retail, Inc. |
| Sector: Services & Goods | |
| SubSector: Internet Retail | |
| MarketCap: 29027 Millions | |
| Recent Price: 46.10 Smart Investing & Trading Score: 63 | |
| Day Percent Change: 3.02% Day Change: 1.35 | |
| Week Change: -1.79% Year-to-date Change: 27.5% | |
| QRTEP Links: Profile News Message Board | |
| Charts:- Daily , Weekly | |
| Add QRTEP to Watchlist: View: Get Complete QRTEP Trend Analysis ➞ | |
 | KR The Kroger Co. |
| Sector: Services & Goods | |
| SubSector: Grocery Stores | |
| MarketCap: 26718.5 Millions | |
| Recent Price: 56.57 Smart Investing & Trading Score: 68 | |
| Day Percent Change: 1.80% Day Change: 1.00 | |
| Week Change: 2.48% Year-to-date Change: 23.8% | |
| KR Links: Profile News Message Board | |
| Charts:- Daily , Weekly | |
| Add KR to Watchlist: View: Get Complete KR Trend Analysis ➞ | |
 | MAR Marriott International, Inc. |
| Sector: Services & Goods | |
| SubSector: Lodging | |
| MarketCap: 25831.6 Millions | |
| Recent Price: 236.00 Smart Investing & Trading Score: 0 | |
| Day Percent Change: -0.13% Day Change: -0.30 | |
| Week Change: -6% Year-to-date Change: 4.7% | |
| MAR Links: Profile News Message Board | |
| Charts:- Daily , Weekly | |
| Add MAR to Watchlist: View: Get Complete MAR Trend Analysis ➞ | |
 | RBLX Roblox Corporation |
| Sector: Services & Goods | |
| SubSector: Electronic Gaming & Multimedia | |
| MarketCap: 25420 Millions | |
| Recent Price: 35.34 Smart Investing & Trading Score: 0 | |
| Day Percent Change: -3.15% Day Change: -1.15 | |
| Week Change: -7.9% Year-to-date Change: -23.4% | |
| RBLX Links: Profile News Message Board | |
| Charts:- Daily , Weekly | |
| Add RBLX to Watchlist: View: Get Complete RBLX Trend Analysis ➞ | |
 | ROST Ross Stores, Inc. |
| Sector: Services & Goods | |
| SubSector: Apparel Stores | |
| MarketCap: 24938.8 Millions | |
| Recent Price: 133.34 Smart Investing & Trading Score: 18 | |
| Day Percent Change: 1.17% Day Change: 1.54 | |
| Week Change: -1.95% Year-to-date Change: -3.7% | |
| ROST Links: Profile News Message Board | |
| Charts:- Daily , Weekly | |
| Add ROST to Watchlist: View: Get Complete ROST Trend Analysis ➞ | |
 | MELI MercadoLibre, Inc. |
| Sector: Services & Goods | |
| SubSector: Catalog & Mail Order Houses | |
| MarketCap: 24695.5 Millions | |
| Recent Price: 1356.43 Smart Investing & Trading Score: 0 | |
| Day Percent Change: -1.01% Day Change: -13.82 | |
| Week Change: -6.07% Year-to-date Change: -13.7% | |
| MELI Links: Profile News Message Board | |
| Charts:- Daily , Weekly | |
| Add MELI to Watchlist: View: Get Complete MELI Trend Analysis ➞ | |
 | SPOT Spotify Technology S.A. |
| Sector: Services & Goods | |
| SubSector: Broadcasting - Radio | |
| MarketCap: 24379.5 Millions | |
| Recent Price: 275.83 Smart Investing & Trading Score: 51 | |
| Day Percent Change: -4.62% Day Change: -13.37 | |
| Week Change: -8.19% Year-to-date Change: 46.8% | |
| SPOT Links: Profile News Message Board | |
| Charts:- Daily , Weekly | |
| Add SPOT to Watchlist: View: Get Complete SPOT Trend Analysis ➞ | |
 | FOX Twenty-First Century Fox, Inc. |
| Sector: Services & Goods | |
| SubSector: Entertainment - Diversified | |
| MarketCap: 24211.2 Millions | |
| Recent Price: 28.87 Smart Investing & Trading Score: 74 | |
| Day Percent Change: 2.05% Day Change: 0.58 | |
| Week Change: 2.23% Year-to-date Change: 4.4% | |
| FOX Links: Profile News Message Board | |
| Charts:- Daily , Weekly | |
| Add FOX to Watchlist: View: Get Complete FOX Trend Analysis ➞ | |
 | MCK McKesson Corporation |
| Sector: Services & Goods | |
| SubSector: Drugs Wholesale | |
| MarketCap: 24096.7 Millions | |
| Recent Price: 524.83 Smart Investing & Trading Score: 44 | |
| Day Percent Change: 1.16% Day Change: 6.02 | |
| Week Change: 0.35% Year-to-date Change: 13.4% | |
| MCK Links: Profile News Message Board | |
| Charts:- Daily , Weekly | |
| Add MCK to Watchlist: View: Get Complete MCK Trend Analysis ➞ | |
 | EBAY eBay Inc. |
| Sector: Services & Goods | |
| SubSector: Specialty Retail, Other | |
| MarketCap: 23152.3 Millions | |
| Recent Price: 50.39 Smart Investing & Trading Score: 61 | |
| Day Percent Change: 0.88% Day Change: 0.44 | |
| Week Change: -1.79% Year-to-date Change: 15.5% | |
| EBAY Links: Profile News Message Board | |
| Charts:- Daily , Weekly | |
| Add EBAY to Watchlist: View: Get Complete EBAY Trend Analysis ➞ | |
 | ORLY O Reilly Automotive, Inc. |
| Sector: Services & Goods | |
| SubSector: Auto Parts Stores | |
| MarketCap: 22391.5 Millions | |
| Recent Price: 1090.94 Smart Investing & Trading Score: 44 | |
| Day Percent Change: -0.92% Day Change: -10.12 | |
| Week Change: 1.34% Year-to-date Change: 14.8% | |
| ORLY Links: Profile News Message Board | |
| Charts:- Daily , Weekly | |
| Add ORLY to Watchlist: View: Get Complete ORLY Trend Analysis ➞ | |
 | VRSK Verisk Analytics, Inc. |
| Sector: Services & Goods | |
| SubSector: Business Services | |
| MarketCap: 22033.2 Millions | |
| Recent Price: 222.52 Smart Investing & Trading Score: 18 | |
| Day Percent Change: -0.36% Day Change: -0.81 | |
| Week Change: 0% Year-to-date Change: -6.8% | |
| VRSK Links: Profile News Message Board | |
| Charts:- Daily , Weekly | |
| Add VRSK to Watchlist: View: Get Complete VRSK Trend Analysis ➞ | |
 | DLTR Dollar Tree, Inc. |
| Sector: Services & Goods | |
| SubSector: Discount, Variety Stores | |
| MarketCap: 21383.2 Millions | |
| Recent Price: 122.03 Smart Investing & Trading Score: 10 | |
| Day Percent Change: -0.16% Day Change: -0.20 | |
| Week Change: -2.52% Year-to-date Change: -14.1% | |
| DLTR Links: Profile News Message Board | |
| Charts:- Daily , Weekly | |
| Add DLTR to Watchlist: View: Get Complete DLTR Trend Analysis ➞ | |
 | SIRI Sirius XM Holdings Inc. |
| Sector: Services & Goods | |
| SubSector: Broadcasting - Radio | |
| MarketCap: 21325.5 Millions | |
| Recent Price: 3.09 Smart Investing & Trading Score: 20 | |
| Day Percent Change: 0.98% Day Change: 0.03 | |
| Week Change: -3.74% Year-to-date Change: -43.5% | |
| SIRI Links: Profile News Message Board | |
| Charts:- Daily , Weekly | |
| Add SIRI to Watchlist: View: Get Complete SIRI Trend Analysis ➞ | |
| For tabular summary view of above stock list: Summary View ➞ 0 - 25 , 25 - 50 , 50 - 75 , 75 - 100 , 100 - 125 , 125 - 150 , 150 - 175 , 175 - 200 , 200 - 225 , 225 - 250 , 250 - 275 , 275 - 300 , 300 - 325 , 325 - 350 , 350 - 375 , 375 - 400 , 400 - 425 , 425 - 450 , 450 - 475 | ||
| Click To Change The Sort Order: By Market Cap or Company Size Performance: Year-to-date, Week and Day | |
| Select Chart Type: | ||
|
Best Stocks Today 12Stocks.com |
© 2024 12Stocks.com Terms & Conditions Privacy Contact Us
All Information Provided Only For Education And Not To Be Used For Investing or Trading. See Terms & Conditions


One More Thing ... Get Best Stocks Delivered Daily!
Never Ever Miss A Move With Our Top Ten Stocks Lists
Find Best Stocks In Any Market - Bull or Bear Market
Take A Peek At Our Top Ten Stocks Lists: Daily, Weekly, Year-to-Date & Top Trends
Find Best Stocks In Any Market - Bull or Bear Market
Take A Peek At Our Top Ten Stocks Lists: Daily, Weekly, Year-to-Date & Top Trends
Consumer Services Stocks With Best Up Trends [0-bearish to 100-bullish]: Gannett Co[100], Gaia [100], Genuine Parts[100], Wendy s[100], Biglari [95], Envestnet [93], MYT Netherlands[93], PaySign [93], Weis Markets[93], FTI Consulting[93], Winmark [90]
Best Consumer Services Stocks Year-to-Date:
U Power[2768.3%], Vroom [1713.36%], Yatsen Holding[394.12%], Fluent [294.03%], Codere Online[136.64%], Research[96.15%], Sweetgreen [82.74%], Bright Scholar[60.8%], PaySign [55.71%], RealReal [54.73%], DXP Enterprises[49.76%] Best Consumer Services Stocks This Week:
Yatsen Holding[20.1%], AMC Entertainment[19.25%], Secoo Holding[17.14%], ContextLogic [16.8%], E.W. Scripps[12.19%], TH [11.82%], Genuine Parts[11.7%], Winmark [11.67%], Advance Auto[11.62%], Altisource Portfolio[11.49%], Envestnet [10.52%] Best Consumer Services Stocks Daily:
Lanvin [11.19%], Allego N.V[8.91%], AMC Entertainment[8.22%], Vision Marine[7.40%], Cumulus Media[7.17%], Altisource Portfolio[7.14%], Urban One[6.92%], Bright Scholar[6.91%], Red Robin[6.67%], Entravision [6.06%], MOGU [5.85%]