
 Login Sign Up


| |||||
 |  | ||||

| 12Stocks.com Market Intelligence |
Best Consumer Services Stocks
| In a hurry? Services & Goods Stocks: Performance Trends Table, Stock Charts
Sort Consumer Services: Daily, Weekly, Year-to-Date, Market Cap & Trends. Filter Services & Goods stocks list by size: All Large Mid-Range Small |
| 12Stocks.com Consumer Services Stocks Performances & Trends Daily | |||||||||
|
|  The overall Smart Investing & Trading Score is 13 (0-bearish to 100-bullish) which puts Consumer Services sector in short term bearish trend. The Smart Investing & Trading Score from previous trading session is 26 and a deterioration of trend continues.
| ||||||||
Here are the Smart Investing & Trading Scores of the most requested Consumer Services stocks at 12Stocks.com (click stock name for detailed review):
|


| Consider signing up for our daily 12Stocks.com "Best Stocks Newsletter". You will never ever miss a big stock move again! |
| 12Stocks.com: Investing in Consumer Services sector with Stocks | |
|
The following table helps investors and traders sort through current performance and trends (as measured by Smart Investing & Trading Score) of various
stocks in the Consumer Services sector. Quick View: Move mouse or cursor over stock symbol (ticker) to view short-term Technical chart and over stock name to view long term chart. Click on  to add stock symbol to your watchlist and to add stock symbol to your watchlist and  to view watchlist. Click on any ticker or stock name for detailed market intelligence report for that stock. to view watchlist. Click on any ticker or stock name for detailed market intelligence report for that stock. |
12Stocks.com Performance of Stocks in Consumer Services Sector
| Ticker | Stock Name | Watchlist | Category | Recent Price | Smart Investing & Trading Score | Change % | YTD Change% |
| FLNT | Fluent |   | Marketing | 2.64 | 76 | -2.94 | 294.03% |
| JMIA | Jumia Technologies | | Retail | 3.94 | 36 | -2.96 | 11.61% |
| LOPE | Grand Canyon | | Education | 127.15 | 0 | -3.00 | -3.70% |
| TISI | Team | | Services | 6.75 | 0 | -3.02 | 2.27% |
| SHCO | Soho House | | Lodging | 5.30 | 10 | -3.11 | -27.10% |
| RBLX | Roblox | | Electronic Gaming & Multimedia | 35.34 | 0 | -3.15 | -23.42% |
| BROS | Dutch Bros | | Restaurants | 29.97 | 36 | -3.23 | -5.61% |
| UCAR | U Power | | Auto & Truck Dealerships | 5.14 | 76 | -3.56 | NA |
| RIVN | Rivian Automotive | | Auto Manufacturers | 8.63 | 28 | -3.79 | -63.17% |
| ICLK | iClick Interactive | | Marketing | 3.26 | 0 | -3.83 | -14.88% |
| LSXMB | Liberty SiriusXM | | Broadcasting | 24.78 | 0 | -3.88 | -13.90% |
| ACVA | ACV Auctions | | Auto & Truck Dealerships | 17.31 | 44 | -3.89 | 14.94% |
| DFH | Dream Finders | | Residential Construction | 33.79 | 36 | -3.98 | -6.14% |
| ARHS | Arhaus | | Home Improvement Retail | 13.83 | 36 | -4.02 | 15.93% |
| IAS | Integral Ad | | Advertising | 9.11 | 10 | -4.11 | -37.30% |
| ECX | ECARX | | Auto Parts | 1.56 | 10 | -4.29 | -48.60% |
| DRVN | Driven Brands | | Auto & Truck Dealerships | 14.11 | 36 | -4.31 | -1.71% |
| GGR | Gogoro | | Auto Parts | 1.41 | 10 | -4.41 | -45.77% |
| GLBE | Global-e Online | | Internet Retail | 33.00 | 0 | -4.43 | -16.62% |
| SPOT | Spotify Technology | | Broadcasting | 275.83 | 51 | -4.62 | 46.79% |
| CASS | Cass Information | | Services | 41.65 | 0 | -4.65 | -7.55% |
| CAVA | CAVA | | Restaurants | 59.67 | 36 | -4.76 | 37.24% |
| MTN | Vail Resorts | | Casinos | 202.94 | 0 | -5.00 | -4.93% |
| ONON | On Holding | | Footwear & Accessories | 31.58 | 26 | -5.14 | 15.76% |
| EVGO | EVgo | | Specialty Retail | 1.73 | 10 | -5.21 | -51.74% |
| For chart view version of above stock list: Chart View ➞ 0 - 25 , 25 - 50 , 50 - 75 , 75 - 100 , 100 - 125 , 125 - 150 , 150 - 175 , 175 - 200 , 200 - 225 , 225 - 250 , 250 - 275 , 275 - 300 , 300 - 325 , 325 - 350 , 350 - 375 , 375 - 400 , 400 - 425 , 425 - 450 , 450 - 475 | ||
 | Click To Change The Sort Order: By Market Cap or Company Size Performance: Year-to-date, Week and Day |  |
|
Get the most comprehensive stock market coverage daily at 12Stocks.com ➞ Best Stocks Today ➞ Best Stocks Weekly ➞ Best Stocks Year-to-Date ➞ Best Stocks Trends ➞  Best Stocks Today 12Stocks.com Best Nasdaq Stocks ➞ Best S&P 500 Stocks ➞ Best Tech Stocks ➞ Best Biotech Stocks ➞ |
| Detailed Overview of Consumer Services Stocks |
| Consumer Services Technical Overview, Leaders & Laggards, Top Consumer Services ETF Funds & Detailed Consumer Services Stocks List, Charts, Trends & More |
| Consumer Services Sector: Technical Analysis, Trends & YTD Performance | |
| Consumer Services sector is composed of stocks
from retail, entertainment, media/publishing, consumer goods
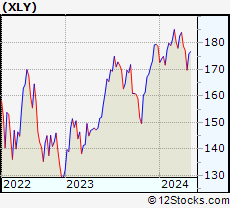
and services subsectors. Consumer Services sector, as represented by XLY, an exchange-traded fund [ETF] that holds basket of Consumer Services stocks (e.g, Walmart, Alibaba) is down by -5.06% and is currently underperforming the overall market by -8.44% year-to-date. Below is a quick view of Technical charts and trends: |
|
 XLY Weekly Chart |
|
| Long Term Trend: Not Good | |
| Medium Term Trend: Not Good | |
 XLY Daily Chart |
|
| Short Term Trend: Not Good | |
| Overall Trend Score: 13 | |
| YTD Performance: -5.06% | |
| **Trend Scores & Views Are Only For Educational Purposes And Not For Investing | |
| 12Stocks.com: Top Performing Consumer Services Sector Stocks | ||||||||||||||||||||||||||||||||||||||||||||||||
 The top performing Consumer Services sector stocks year to date are
Now, more recently, over last week, the top performing Consumer Services sector stocks on the move are


|
||||||||||||||||||||||||||||||||||||||||||||||||
| 12Stocks.com: Investing in Consumer Services Sector using Exchange Traded Funds | |
|
The following table shows list of key exchange traded funds (ETF) that
help investors track Consumer Services Index. For detailed view, check out our ETF Funds section of our website. Quick View: Move mouse or cursor over ETF symbol (ticker) to view short-term Technical chart and over ETF name to view long term chart. Click on ticker or stock name for detailed view. Click on to add stock symbol to your watchlist and to view watchlist. |
12Stocks.com List of ETFs that track Consumer Services Index
| Ticker | ETF Name | Watchlist | Recent Price | Smart Investing & Trading Score | Change % | Week % | Year-to-date % |
| XLY | Consumer Discret Sel | | 169.76 | 13 | -0.88 | -4.15 | -5.06% |
| RTH | Retail | | 198.63 | 44 | 0.00 | -1.52 | 5.53% |
| IYC | Consumer Services | | 76.27 | 26 | -1.03 | -3.69 | 0.66% |
| XRT | Retail | | 71.17 | 51 | 0.68 | -0.99 | -1.59% |
| IYK | Consumer Goods | | 65.81 | 75 | 1.29 | 2.57 | 2.98% |
| UCC | Consumer Services | | 31.58 | 20 | -3.26 | -8.28 | -12.06% |
| RETL | Retail Bull 3X | | 8.12 | 49 | 2.14 | -3.45 | -10.96% |
| RXI | Globl Consumer Discretionary | | 157.15 | 44 | -0.19 | -2.26 | -1.2% |
| SCC | Short Consumer Services | | 16.95 | 100 | 2.13 | 8.91 | 10.64% |
| UGE | Consumer Goods | | 16.63 | 73 | 2.26 | 2.71 | 5.63% |
| 12Stocks.com: Charts, Trends, Fundamental Data and Performances of Consumer Services Stocks | |
|
We now take in-depth look at all Consumer Services stocks including charts, multi-period performances and overall trends (as measured by Smart Investing & Trading Score). One can sort Consumer Services stocks (click link to choose) by Daily, Weekly and by Year-to-Date performances. Also, one can sort by size of the company or by market capitalization. |
| Select Your Default Chart Type: | |||||
| |||||
| Click on stock symbol or name for detailed view. Click on to add stock symbol to your watchlist and to view watchlist. Quick View: Move mouse or cursor over "Daily" to quickly view daily Technical stock chart and over "Weekly" to view weekly Technical stock chart. | |||||

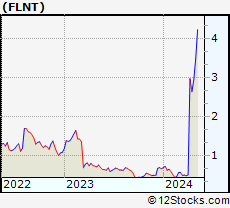 | FLNT Fluent, Inc. |
| Sector: Services & Goods | |
| SubSector: Marketing Services | |
| MarketCap: 110.015 Millions | |
| Recent Price: 2.64 Smart Investing & Trading Score: 76 | |
| Day Percent Change: -2.94% Day Change: -0.08 | |
| Week Change: -11.27% Year-to-date Change: 294.0% | |
| FLNT Links: Profile News Message Board | |
| Charts:- Daily , Weekly | |
| Add FLNT to Watchlist: View: Get Complete FLNT Trend Analysis ➞ | |
 | JMIA Jumia Technologies AG |
| Sector: Services & Goods | |
| SubSector: Specialty Retail, Other | |
| MarketCap: 203.644 Millions | |
| Recent Price: 3.94 Smart Investing & Trading Score: 36 | |
| Day Percent Change: -2.96% Day Change: -0.12 | |
| Week Change: -11.46% Year-to-date Change: 11.6% | |
| JMIA Links: Profile News Message Board | |
| Charts:- Daily , Weekly | |
| Add JMIA to Watchlist: View: Get Complete JMIA Trend Analysis ➞ | |
 | LOPE Grand Canyon Education, Inc. |
| Sector: Services & Goods | |
| SubSector: Education & Training Services | |
| MarketCap: 3073.56 Millions | |
| Recent Price: 127.15 Smart Investing & Trading Score: 0 | |
| Day Percent Change: -3.00% Day Change: -3.93 | |
| Week Change: -2.72% Year-to-date Change: -3.7% | |
| LOPE Links: Profile News Message Board | |
| Charts:- Daily , Weekly | |
| Add LOPE to Watchlist: View: Get Complete LOPE Trend Analysis ➞ | |
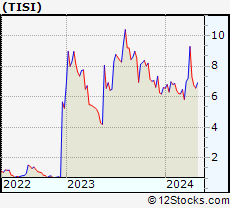 | TISI Team, Inc. |
| Sector: Services & Goods | |
| SubSector: Business Services | |
| MarketCap: 284.982 Millions | |
| Recent Price: 6.75 Smart Investing & Trading Score: 0 | |
| Day Percent Change: -3.02% Day Change: -0.21 | |
| Week Change: -7.53% Year-to-date Change: 2.3% | |
| TISI Links: Profile News Message Board | |
| Charts:- Daily , Weekly | |
| Add TISI to Watchlist: View: Get Complete TISI Trend Analysis ➞ | |
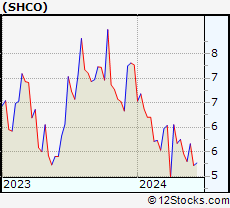 | SHCO Soho House & Co Inc. |
| Sector: Services & Goods | |
| SubSector: Lodging | |
| MarketCap: 1140 Millions | |
| Recent Price: 5.30 Smart Investing & Trading Score: 10 | |
| Day Percent Change: -3.11% Day Change: -0.17 | |
| Week Change: -2.75% Year-to-date Change: -27.1% | |
| SHCO Links: Profile News Message Board | |
| Charts:- Daily , Weekly | |
| Add SHCO to Watchlist: View: Get Complete SHCO Trend Analysis ➞ | |
 | RBLX Roblox Corporation |
| Sector: Services & Goods | |
| SubSector: Electronic Gaming & Multimedia | |
| MarketCap: 25420 Millions | |
| Recent Price: 35.34 Smart Investing & Trading Score: 0 | |
| Day Percent Change: -3.15% Day Change: -1.15 | |
| Week Change: -7.9% Year-to-date Change: -23.4% | |
| RBLX Links: Profile News Message Board | |
| Charts:- Daily , Weekly | |
| Add RBLX to Watchlist: View: Get Complete RBLX Trend Analysis ➞ | |
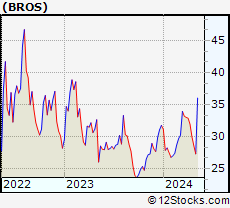 | BROS Dutch Bros Inc. |
| Sector: Services & Goods | |
| SubSector: Restaurants | |
| MarketCap: 4670 Millions | |
| Recent Price: 29.97 Smart Investing & Trading Score: 36 | |
| Day Percent Change: -3.23% Day Change: -1.00 | |
| Week Change: -6.2% Year-to-date Change: -5.6% | |
| BROS Links: Profile News Message Board | |
| Charts:- Daily , Weekly | |
| Add BROS to Watchlist: View: Get Complete BROS Trend Analysis ➞ | |
 | UCAR U Power Limited |
| Sector: Services & Goods | |
| SubSector: Auto & Truck Dealerships | |
| MarketCap: 372 Millions | |
| Recent Price: 5.14 Smart Investing & Trading Score: 76 | |
| Day Percent Change: -3.56% Day Change: -0.19 | |
| Week Change: 0.78% Year-to-date Change: 2,768.3% | |
| UCAR Links: Profile News Message Board | |
| Charts:- Daily , Weekly | |
| Add UCAR to Watchlist: View: Get Complete UCAR Trend Analysis ➞ | |
 | RIVN Rivian Automotive, Inc. |
| Sector: Services & Goods | |
| SubSector: Auto Manufacturers | |
| MarketCap: 14310 Millions | |
| Recent Price: 8.63 Smart Investing & Trading Score: 28 | |
| Day Percent Change: -3.79% Day Change: -0.34 | |
| Week Change: -5.48% Year-to-date Change: -63.2% | |
| RIVN Links: Profile News Message Board | |
| Charts:- Daily , Weekly | |
| Add RIVN to Watchlist: View: Get Complete RIVN Trend Analysis ➞ | |
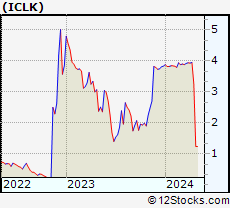 | ICLK iClick Interactive Asia Group Limited |
| Sector: Services & Goods | |
| SubSector: Marketing Services | |
| MarketCap: 258.915 Millions | |
| Recent Price: 3.26 Smart Investing & Trading Score: 0 | |
| Day Percent Change: -3.83% Day Change: -0.13 | |
| Week Change: -17.47% Year-to-date Change: -14.9% | |
| ICLK Links: Profile News Message Board | |
| Charts:- Daily , Weekly | |
| Add ICLK to Watchlist: View: Get Complete ICLK Trend Analysis ➞ | |
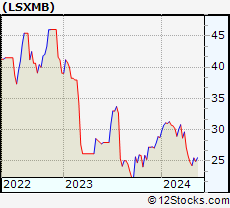 | LSXMB The Liberty SiriusXM Group |
| Sector: Services & Goods | |
| SubSector: Broadcasting - Radio | |
| MarketCap: 252.295 Millions | |
| Recent Price: 24.78 Smart Investing & Trading Score: 0 | |
| Day Percent Change: -3.88% Day Change: -1.00 | |
| Week Change: -3.8% Year-to-date Change: -13.9% | |
| LSXMB Links: Profile News Message Board | |
| Charts:- Daily , Weekly | |
| Add LSXMB to Watchlist: View: Get Complete LSXMB Trend Analysis ➞ | |
 | ACVA ACV Auctions Inc. |
| Sector: Services & Goods | |
| SubSector: Auto & Truck Dealerships | |
| MarketCap: 2680 Millions | |
| Recent Price: 17.31 Smart Investing & Trading Score: 44 | |
| Day Percent Change: -3.89% Day Change: -0.70 | |
| Week Change: -2.2% Year-to-date Change: 14.9% | |
| ACVA Links: Profile News Message Board | |
| Charts:- Daily , Weekly | |
| Add ACVA to Watchlist: View: Get Complete ACVA Trend Analysis ➞ | |
 | DFH Dream Finders Homes, Inc. |
| Sector: Services & Goods | |
| SubSector: Residential Construction | |
| MarketCap: 2270 Millions | |
| Recent Price: 33.79 Smart Investing & Trading Score: 36 | |
| Day Percent Change: -3.98% Day Change: -1.40 | |
| Week Change: -12.42% Year-to-date Change: -6.1% | |
| DFH Links: Profile News Message Board | |
| Charts:- Daily , Weekly | |
| Add DFH to Watchlist: View: Get Complete DFH Trend Analysis ➞ | |
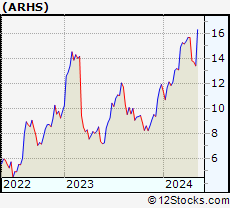 | ARHS Arhaus, Inc. |
| Sector: Services & Goods | |
| SubSector: Home Improvement Retail | |
| MarketCap: 1450 Millions | |
| Recent Price: 13.83 Smart Investing & Trading Score: 36 | |
| Day Percent Change: -4.02% Day Change: -0.58 | |
| Week Change: -11.85% Year-to-date Change: 15.9% | |
| ARHS Links: Profile News Message Board | |
| Charts:- Daily , Weekly | |
| Add ARHS to Watchlist: View: Get Complete ARHS Trend Analysis ➞ | |
 | IAS Integral Ad Science Holding Corp. |
| Sector: Services & Goods | |
| SubSector: Advertising Agencies | |
| MarketCap: 2760 Millions | |
| Recent Price: 9.11 Smart Investing & Trading Score: 10 | |
| Day Percent Change: -4.11% Day Change: -0.39 | |
| Week Change: -7.7% Year-to-date Change: -37.3% | |
| IAS Links: Profile News Message Board | |
| Charts:- Daily , Weekly | |
| Add IAS to Watchlist: View: Get Complete IAS Trend Analysis ➞ | |
 | ECX ECARX Holdings Inc. |
| Sector: Services & Goods | |
| SubSector: Auto Parts | |
| MarketCap: 2270 Millions | |
| Recent Price: 1.56 Smart Investing & Trading Score: 10 | |
| Day Percent Change: -4.29% Day Change: -0.07 | |
| Week Change: -5.45% Year-to-date Change: -48.6% | |
| ECX Links: Profile News Message Board | |
| Charts:- Daily , Weekly | |
| Add ECX to Watchlist: View: Get Complete ECX Trend Analysis ➞ | |
 | DRVN Driven Brands Holdings Inc. |
| Sector: Services & Goods | |
| SubSector: Auto & Truck Dealerships | |
| MarketCap: 4490 Millions | |
| Recent Price: 14.11 Smart Investing & Trading Score: 36 | |
| Day Percent Change: -4.31% Day Change: -0.63 | |
| Week Change: -2.56% Year-to-date Change: -1.7% | |
| DRVN Links: Profile News Message Board | |
| Charts:- Daily , Weekly | |
| Add DRVN to Watchlist: View: Get Complete DRVN Trend Analysis ➞ | |
 | GGR Gogoro Inc. |
| Sector: Services & Goods | |
| SubSector: Auto Parts | |
| MarketCap: 856 Millions | |
| Recent Price: 1.41 Smart Investing & Trading Score: 10 | |
| Day Percent Change: -4.41% Day Change: -0.07 | |
| Week Change: -12.96% Year-to-date Change: -45.8% | |
| GGR Links: Profile News Message Board | |
| Charts:- Daily , Weekly | |
| Add GGR to Watchlist: View: Get Complete GGR Trend Analysis ➞ | |
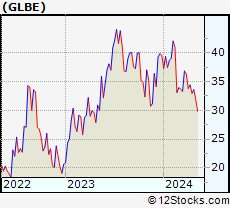 | GLBE Global-e Online Ltd. |
| Sector: Services & Goods | |
| SubSector: Internet Retail | |
| MarketCap: 6610 Millions | |
| Recent Price: 33.00 Smart Investing & Trading Score: 0 | |
| Day Percent Change: -4.43% Day Change: -1.53 | |
| Week Change: -4.15% Year-to-date Change: -16.6% | |
| GLBE Links: Profile News Message Board | |
| Charts:- Daily , Weekly | |
| Add GLBE to Watchlist: View: Get Complete GLBE Trend Analysis ➞ | |
 | SPOT Spotify Technology S.A. |
| Sector: Services & Goods | |
| SubSector: Broadcasting - Radio | |
| MarketCap: 24379.5 Millions | |
| Recent Price: 275.83 Smart Investing & Trading Score: 51 | |
| Day Percent Change: -4.62% Day Change: -13.37 | |
| Week Change: -8.19% Year-to-date Change: 46.8% | |
| SPOT Links: Profile News Message Board | |
| Charts:- Daily , Weekly | |
| Add SPOT to Watchlist: View: Get Complete SPOT Trend Analysis ➞ | |
 | CASS Cass Information Systems, Inc. |
| Sector: Services & Goods | |
| SubSector: Business Services | |
| MarketCap: 477.382 Millions | |
| Recent Price: 41.65 Smart Investing & Trading Score: 0 | |
| Day Percent Change: -4.65% Day Change: -2.03 | |
| Week Change: -8.34% Year-to-date Change: -7.6% | |
| CASS Links: Profile News Message Board | |
| Charts:- Daily , Weekly | |
| Add CASS to Watchlist: View: Get Complete CASS Trend Analysis ➞ | |
 | CAVA CAVA Group, Inc. |
| Sector: Services & Goods | |
| SubSector: Restaurants | |
| MarketCap: 4510 Millions | |
| Recent Price: 59.67 Smart Investing & Trading Score: 36 | |
| Day Percent Change: -4.76% Day Change: -2.98 | |
| Week Change: -6.4% Year-to-date Change: 37.2% | |
| CAVA Links: Profile News Message Board | |
| Charts:- Daily , Weekly | |
| Add CAVA to Watchlist: View: Get Complete CAVA Trend Analysis ➞ | |
 | MTN Vail Resorts, Inc. |
| Sector: Services & Goods | |
| SubSector: Resorts & Casinos | |
| MarketCap: 6259.64 Millions | |
| Recent Price: 202.94 Smart Investing & Trading Score: 0 | |
| Day Percent Change: -5.00% Day Change: -10.68 | |
| Week Change: -10.59% Year-to-date Change: -4.9% | |
| MTN Links: Profile News Message Board | |
| Charts:- Daily , Weekly | |
| Add MTN to Watchlist: View: Get Complete MTN Trend Analysis ➞ | |
 | ONON On Holding AG |
| Sector: Services & Goods | |
| SubSector: Footwear & Accessories | |
| MarketCap: 10600 Millions | |
| Recent Price: 31.58 Smart Investing & Trading Score: 26 | |
| Day Percent Change: -5.14% Day Change: -1.71 | |
| Week Change: -3.92% Year-to-date Change: 15.8% | |
| ONON Links: Profile News Message Board | |
| Charts:- Daily , Weekly | |
| Add ONON to Watchlist: View: Get Complete ONON Trend Analysis ➞ | |
 | EVGO EVgo, Inc. |
| Sector: Services & Goods | |
| SubSector: Specialty Retail | |
| MarketCap: 1140 Millions | |
| Recent Price: 1.73 Smart Investing & Trading Score: 10 | |
| Day Percent Change: -5.21% Day Change: -0.09 | |
| Week Change: -16.02% Year-to-date Change: -51.7% | |
| EVGO Links: Profile News Message Board | |
| Charts:- Daily , Weekly | |
| Add EVGO to Watchlist: View: Get Complete EVGO Trend Analysis ➞ | |
| For tabular summary view of above stock list: Summary View ➞ 0 - 25 , 25 - 50 , 50 - 75 , 75 - 100 , 100 - 125 , 125 - 150 , 150 - 175 , 175 - 200 , 200 - 225 , 225 - 250 , 250 - 275 , 275 - 300 , 300 - 325 , 325 - 350 , 350 - 375 , 375 - 400 , 400 - 425 , 425 - 450 , 450 - 475 | ||
| Click To Change The Sort Order: By Market Cap or Company Size Performance: Year-to-date, Week and Day | |
| Select Chart Type: | ||
|
Best Stocks Today 12Stocks.com |
© 2024 12Stocks.com Terms & Conditions Privacy Contact Us
All Information Provided Only For Education And Not To Be Used For Investing or Trading. See Terms & Conditions


One More Thing ... Get Best Stocks Delivered Daily!
Never Ever Miss A Move With Our Top Ten Stocks Lists
Find Best Stocks In Any Market - Bull or Bear Market
Take A Peek At Our Top Ten Stocks Lists: Daily, Weekly, Year-to-Date & Top Trends
Find Best Stocks In Any Market - Bull or Bear Market
Take A Peek At Our Top Ten Stocks Lists: Daily, Weekly, Year-to-Date & Top Trends
Consumer Services Stocks With Best Up Trends [0-bearish to 100-bullish]: Gannett Co[100], Gaia [100], Genuine Parts[100], Wendy s[100], Biglari [95], Envestnet [93], MYT Netherlands[93], PaySign [93], Weis Markets[93], FTI Consulting[93], Winmark [90]
Best Consumer Services Stocks Year-to-Date:
U Power[2768.3%], Vroom [1713.36%], Yatsen Holding[394.12%], Fluent [294.03%], Codere Online[136.64%], Research[96.15%], Sweetgreen [82.74%], Bright Scholar[60.8%], PaySign [55.71%], RealReal [54.73%], DXP Enterprises[49.76%] Best Consumer Services Stocks This Week:
Yatsen Holding[20.1%], AMC Entertainment[19.25%], Secoo Holding[17.14%], ContextLogic [16.8%], E.W. Scripps[12.19%], TH [11.82%], Genuine Parts[11.7%], Winmark [11.67%], Advance Auto[11.62%], Altisource Portfolio[11.49%], Envestnet [10.52%] Best Consumer Services Stocks Daily:
Lanvin [11.19%], Allego N.V[8.91%], AMC Entertainment[8.22%], Vision Marine[7.40%], Cumulus Media[7.17%], Altisource Portfolio[7.14%], Urban One[6.92%], Bright Scholar[6.91%], Red Robin[6.67%], Entravision [6.06%], MOGU [5.85%]