
 Login Sign Up


| |||||
 |  | ||||

| 12Stocks.com Market Intelligence |
Best China Stocks
|
On this page, you will find the most comprehensive analysis of Chinese stocks and ETFs - from latest trends to performances to charts ➞. First, here are the year-to-date (YTD) performances of the most requested China stocks at 12Stocks.com (click stock for review):
| New Oriental 22% | ||
| Sohu.com 13% | ||
| NetEase -0% | ||
| JD.com -5% | ||
| Alibaba -6% | ||
| Vipshop -11% | ||
| JOYY -17% | ||
| Baidu -18% | ||
| Weibo -26% | ||
| In a hurry? China Stocks Lists: Performance Trends Table, Stock Charts
Sort China stocks: Daily, Weekly, Year-to-Date, Market Cap & Trends. Filter China stocks list by sector: Show all, Tech, Finance, Energy, Staples, Retail, Industrial, Materials, Utilities and HealthCare Filter China stocks list by size: All China Large Medium Small and MicroCap |
| April 24, 2024 - 12Stocks.com China Stocks Performances & Trends Daily | |||||||||
|
|  The overall Smart Investing & Trading Score is 100 (0-bearish to 100-bullish) which puts China index in short term bullish trend. The Smart Investing & Trading Score from previous trading session is 74 and an improvement of trend continues.
| ||||||||
| Here are the Smart Investing & Trading Scores of the most requested China stocks at 12Stocks.com (click stock name for detailed review): |


| 12Stocks.com: Top Performing China Index Stocks | ||||||||||||||||||||||||||||||||||||||||||||||||
 The top performing China Index stocks year to date are
Now, more recently, over last week, the top performing China Index stocks on the move are


|
||||||||||||||||||||||||||||||||||||||||||||||||
| 12Stocks.com: Investing in China Index with Stocks | |
|
The following table helps investors and traders sort through current performance and trends (as measured by Smart Investing & Trading Score) of various
stocks in the China Index. Quick View: Move mouse or cursor over stock symbol (ticker) to view short-term technical chart and over stock name to view long term chart. Click on  to add stock symbol to your watchlist and to add stock symbol to your watchlist and  to view watchlist. Click on any ticker or stock name for detailed market intelligence report for that stock. to view watchlist. Click on any ticker or stock name for detailed market intelligence report for that stock. |
12Stocks.com Performance of Stocks in China Index
| Ticker | Stock Name | Watchlist | Category | Recent Price | Smart Investing & Trading Score | Change % | Weekly Change% |
| FINV | FinVolution |   | Financials | 4.83 | 45 | 1.47% | 1.90% |
| ATHM | Autohome | | Technology | 24.74 | 32 | 0.20% | 1.89% |
| HUIZ | Huize Holding | | Financials | 0.63 | 35 | -0.35% | 1.70% |
| ZTO | ZTO Express | | Transports | 20.24 | 75 | 0.70% | 1.50% |
| EDTK | Skillful Craftsman | | Consumer Staples | 0.93 | 25 | -1.27% | 1.43% |
| DAO | Youdao | | Technology | 3.60 | 56 | 0.84% | 1.41% |
| HKD | AMTD Digital | | Technology | 3.12 | 52 | 1.30% | 1.30% |
| YJ | Yunji | | Services & Goods | 0.76 | 41 | 1.63% | 1.29% |
| UCAR | U Power | | Services & Goods | 5.20 | 63 | 7.00% | 1.17% |
| FANH | Fanhua | | Financials | 3.54 | 42 | 1.14% | 1.14% |
| VIOT | Viomi | | Technology | 0.55 | 25 | 3.77% | 0.82% |
| MLCO | Melco Resorts | | Services & Goods | 6.20 | 25 | 0.49% | 0.73% |
| LANV | Lanvin | | Services & Goods | 1.60 | 67 | 0.00% | 0.63% |
| SFWL | Shengfeng Development | | Industrials | 1.64 | 51 | 2.50% | 0.61% |
| BEST | BEST | | Consumer Staples | 2.09 | 20 | -1.88% | 0.48% |
| HUYA | HUYA | | Services & Goods | 4.43 | 48 | 0.45% | 0.45% |
| LU | Lufax Holding | | Financials | 4.36 | 83 | -0.68% | 0.23% |
| SMI | Semiconductor | | Technology | 45.73 | 43 | 0.01% | 0.01% |
| AIXI | Xiao-I | | Technology | 1.42 | 27 | 6.77% | 0.00% |
| RERE | ATRenew | | Services & Goods | 1.58 | 46 | 1.94% | 0.00% |
| FENG | Phoenix New | | Technology | 1.82 | 43 | -2.15% | 0.00% |
| SVA | Sinovac Biotech | | Health Care | 6.47 | 27 | 0.00% | 0.00% |
| CNF | CNFinance | | Financials | 1.84 | 17 | -0.81% | -0.27% |
| QSG | QuantaSing | | Consumer Staples | 3.34 | 20 | 1.68% | -0.45% |
| NTES | NetEase | | Technology | 93.07 | 25 | -1.91% | -0.47% |
| For chart view version of above stock list: Chart View ➞ 0 - 25 , 25 - 50 , 50 - 75 , 75 - 100 , 100 - 125 , 125 - 150 | ||
 | Click To Change The Sort Order: By Market Cap or Company Size Performance: Year-to-date, Week and Day |  |
|
Get the most comprehensive stock market coverage daily at 12Stocks.com ➞ Best Stocks Today ➞ Best Stocks Weekly ➞ Best Stocks Year-to-Date ➞ Best Stocks Trends ➞  Best Stocks Today 12Stocks.com Best Nasdaq Stocks ➞ Best S&P 500 Stocks ➞ Best Tech Stocks ➞ Best Biotech Stocks ➞ |
| Detailed Overview of China Stocks |
| China Technical Overview, Leaders & Laggards, Top China ETF Funds & Detailed China Stocks List, Charts, Trends & More |
| China: Technical Analysis, Trends & YTD Performance | |
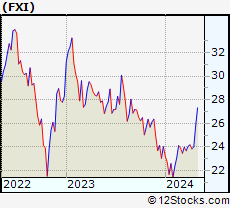
 FXI Weekly Chart |
|
| Long Term Trend: Very Good | |
| Medium Term Trend: Very Good | |
 FXI Daily Chart |
|
| Short Term Trend: Very Good | |
| Overall Trend Score: 100 | |
| YTD Performance: 3.2% | |
| **Trend Scores & Views Are Only For Educational Purposes And Not For Investing | |
| 12Stocks.com: Investing in China Index using Exchange Traded Funds | |
|
The following table shows list of key exchange traded funds (ETF) that
help investors play China stock market. For detailed view, check out our ETF Funds section of our website. Quick View: Move mouse or cursor over ETF symbol (ticker) to view short-term technical chart and over ETF name to view long term chart. Click on ticker or stock name for detailed view. Click on to add stock symbol to your watchlist and to view watchlist. |
12Stocks.com List of ETFs that track China Index
| Ticker | ETF Name | Watchlist | Recent Price | Smart Investing & Trading Score | Change % | Week % | Year-to-date % |
| FXI | China Large-Cap | | 24.80 | 100 | 1.56 | 3.29 | 3.2% |
| EWH | Hong Kong | | 15.25 | 59 | 1.73 | 3.74 | -12.2% |
| YINN | China Bull 3X | | 20.50 | 100 | 4.75 | 9.22 | -2.1% |
| YANG | China Bear 3X | | 10.60 | 0 | -4.76 | -9.17 | -17.19% |
| XPP | China 50 | | 13.80 | 100 | 3.22 | 6.42 | 0.4% |
| MCHI | China | | 40.71 | 100 | 2.16 | 3.3 | -0.07% |
| GXC | China | | 66.95 | 100 | 0.93 | 2.48 | -1.72% |
| CBON | ChinaAMC China Bond | | 21.92 | 55 | -0.14 | -0.03 | -0.81% |
| 12Stocks.com: Charts, Trends, Fundamental Data and Performances of China Stocks | |
|
We now take in-depth look at all China stocks including charts, multi-period performances and overall trends (as measured by Smart Investing & Trading Score). One can sort China stocks (click link to choose) by Daily, Weekly and by Year-to-Date performances. Also, one can sort by size of the company or by market capitalization. |
| Select Your Default Chart Type: | |||||
| |||||
| Click on stock symbol or name for detailed view. Click on to add stock symbol to your watchlist and to view watchlist. Quick View: Move mouse or cursor over "Daily" to quickly view daily technical stock chart and over "Weekly" to view weekly technical stock chart. | |||||

 | FINV FinVolution Group |
| Sector: Financials | |
| SubSector: Credit Services | |
| MarketCap: 476.208 Millions | |
| Recent Price: 4.83 Smart Investing & Trading Score: 45 | |
| Day Percent Change: 1.47% Day Change: 0.07 | |
| Week Change: 1.9% Year-to-date Change: -1.4% | |
| FINV Links: Profile News Message Board | |
| Charts:- Daily , Weekly | |
| Add FINV to Watchlist: View: Get Complete FINV Trend Analysis ➞ | |
 | ATHM Autohome Inc. |
| Sector: Technology | |
| SubSector: Internet Information Providers | |
| MarketCap: 7984.2 Millions | |
| Recent Price: 24.74 Smart Investing & Trading Score: 32 | |
| Day Percent Change: 0.20% Day Change: 0.05 | |
| Week Change: 1.89% Year-to-date Change: -11.8% | |
| ATHM Links: Profile News Message Board | |
| Charts:- Daily , Weekly | |
| Add ATHM to Watchlist: View: Get Complete ATHM Trend Analysis ➞ | |
 | HUIZ Huize Holding Limited |
| Sector: Financials | |
| SubSector: Insurance Brokers | |
| MarketCap: 37157 Millions | |
| Recent Price: 0.63 Smart Investing & Trading Score: 35 | |
| Day Percent Change: -0.35% Day Change: 0.00 | |
| Week Change: 1.7% Year-to-date Change: -30.3% | |
| HUIZ Links: Profile News Message Board | |
| Charts:- Daily , Weekly | |
| Add HUIZ to Watchlist: View: Get Complete HUIZ Trend Analysis ➞ | |
 | ZTO ZTO Express (Cayman) Inc. |
| Sector: Transports | |
| SubSector: Air Delivery & Freight Services | |
| MarketCap: 20507 Millions | |
| Recent Price: 20.24 Smart Investing & Trading Score: 75 | |
| Day Percent Change: 0.70% Day Change: 0.14 | |
| Week Change: 1.5% Year-to-date Change: -4.9% | |
| ZTO Links: Profile News Message Board | |
| Charts:- Daily , Weekly | |
| Add ZTO to Watchlist: View: Get Complete ZTO Trend Analysis ➞ | |
 | EDTK Skillful Craftsman Education Technology Limited |
| Sector: Consumer Staples | |
| SubSector: Education & Training Services | |
| MarketCap: 32347 Millions | |
| Recent Price: 0.93 Smart Investing & Trading Score: 25 | |
| Day Percent Change: -1.27% Day Change: -0.01 | |
| Week Change: 1.43% Year-to-date Change: -26.3% | |
| EDTK Links: Profile News Message Board | |
| Charts:- Daily , Weekly | |
| Add EDTK to Watchlist: View: Get Complete EDTK Trend Analysis ➞ | |
 | DAO Youdao, Inc. |
| Sector: Technology | |
| SubSector: Internet Information Providers | |
| MarketCap: 2073.2 Millions | |
| Recent Price: 3.60 Smart Investing & Trading Score: 56 | |
| Day Percent Change: 0.84% Day Change: 0.03 | |
| Week Change: 1.41% Year-to-date Change: -8.6% | |
| DAO Links: Profile News Message Board | |
| Charts:- Daily , Weekly | |
| Add DAO to Watchlist: View: Get Complete DAO Trend Analysis ➞ | |
 | HKD AMTD Digital Inc. |
| Sector: Technology | |
| SubSector: Software - Application | |
| MarketCap: 1200 Millions | |
| Recent Price: 3.12 Smart Investing & Trading Score: 52 | |
| Day Percent Change: 1.30% Day Change: 0.04 | |
| Week Change: 1.3% Year-to-date Change: -24.5% | |
| HKD Links: Profile News Message Board | |
| Charts:- Daily , Weekly | |
| Add HKD to Watchlist: View: Get Complete HKD Trend Analysis ➞ | |
 | YJ Yunji Inc. |
| Sector: Services & Goods | |
| SubSector: Specialty Retail, Other | |
| MarketCap: 770.644 Millions | |
| Recent Price: 0.76 Smart Investing & Trading Score: 41 | |
| Day Percent Change: 1.63% Day Change: 0.01 | |
| Week Change: 1.29% Year-to-date Change: 6.2% | |
| YJ Links: Profile News Message Board | |
| Charts:- Daily , Weekly | |
| Add YJ to Watchlist: View: Get Complete YJ Trend Analysis ➞ | |
 | UCAR U Power Limited |
| Sector: Services & Goods | |
| SubSector: Auto & Truck Dealerships | |
| MarketCap: 372 Millions | |
| Recent Price: 5.20 Smart Investing & Trading Score: 63 | |
| Day Percent Change: 7.00% Day Change: 0.34 | |
| Week Change: 1.17% Year-to-date Change: 2,801.8% | |
| UCAR Links: Profile News Message Board | |
| Charts:- Daily , Weekly | |
| Add UCAR to Watchlist: View: Get Complete UCAR Trend Analysis ➞ | |
 | FANH Fanhua Inc. |
| Sector: Financials | |
| SubSector: Insurance Brokers | |
| MarketCap: 1436.67 Millions | |
| Recent Price: 3.54 Smart Investing & Trading Score: 42 | |
| Day Percent Change: 1.14% Day Change: 0.04 | |
| Week Change: 1.14% Year-to-date Change: -46.8% | |
| FANH Links: Profile News Message Board | |
| Charts:- Daily , Weekly | |
| Add FANH to Watchlist: View: Get Complete FANH Trend Analysis ➞ | |
 | VIOT Viomi Technology Co., Ltd |
| Sector: Technology | |
| SubSector: Electronic Equipment | |
| MarketCap: 357.2 Millions | |
| Recent Price: 0.55 Smart Investing & Trading Score: 25 | |
| Day Percent Change: 3.77% Day Change: 0.02 | |
| Week Change: 0.82% Year-to-date Change: -45.0% | |
| VIOT Links: Profile News Message Board | |
| Charts:- Daily , Weekly | |
| Add VIOT to Watchlist: View: Get Complete VIOT Trend Analysis ➞ | |
 | MLCO Melco Resorts & Entertainment Limited |
| Sector: Services & Goods | |
| SubSector: Resorts & Casinos | |
| MarketCap: 7031.14 Millions | |
| Recent Price: 6.20 Smart Investing & Trading Score: 25 | |
| Day Percent Change: 0.49% Day Change: 0.03 | |
| Week Change: 0.73% Year-to-date Change: -30.1% | |
| MLCO Links: Profile News Message Board | |
| Charts:- Daily , Weekly | |
| Add MLCO to Watchlist: View: Get Complete MLCO Trend Analysis ➞ | |
 | LANV Lanvin Group Holdings Limited |
| Sector: Services & Goods | |
| SubSector: Luxury Goods | |
| MarketCap: 712 Millions | |
| Recent Price: 1.60 Smart Investing & Trading Score: 67 | |
| Day Percent Change: 0.00% Day Change: 0.00 | |
| Week Change: 0.63% Year-to-date Change: -47.7% | |
| LANV Links: Profile News Message Board | |
| Charts:- Daily , Weekly | |
| Add LANV to Watchlist: View: Get Complete LANV Trend Analysis ➞ | |
 | SFWL Shengfeng Development Limited |
| Sector: Industrials | |
| SubSector: Integrated Freight & Logistics | |
| MarketCap: 747 Millions | |
| Recent Price: 1.64 Smart Investing & Trading Score: 51 | |
| Day Percent Change: 2.50% Day Change: 0.04 | |
| Week Change: 0.61% Year-to-date Change: -40.4% | |
| SFWL Links: Profile News Message Board | |
| Charts:- Daily , Weekly | |
| Add SFWL to Watchlist: View: Get Complete SFWL Trend Analysis ➞ | |
 | BEST BEST Inc. |
| Sector: Consumer Staples | |
| SubSector: Packaging & Containers | |
| MarketCap: 1981.73 Millions | |
| Recent Price: 2.09 Smart Investing & Trading Score: 20 | |
| Day Percent Change: -1.88% Day Change: -0.04 | |
| Week Change: 0.48% Year-to-date Change: -18.1% | |
| BEST Links: Profile News Message Board | |
| Charts:- Daily , Weekly | |
| Add BEST to Watchlist: View: Get Complete BEST Trend Analysis ➞ | |
 | HUYA HUYA Inc. |
| Sector: Services & Goods | |
| SubSector: Entertainment - Diversified | |
| MarketCap: 3358.17 Millions | |
| Recent Price: 4.43 Smart Investing & Trading Score: 48 | |
| Day Percent Change: 0.45% Day Change: 0.02 | |
| Week Change: 0.45% Year-to-date Change: 21.0% | |
| HUYA Links: Profile News Message Board | |
| Charts:- Daily , Weekly | |
| Add HUYA to Watchlist: View: Get Complete HUYA Trend Analysis ➞ | |
 | LU Lufax Holding Ltd |
| Sector: Financials | |
| SubSector: Credit Services | |
| MarketCap: 33457 Millions | |
| Recent Price: 4.36 Smart Investing & Trading Score: 83 | |
| Day Percent Change: -0.68% Day Change: -0.03 | |
| Week Change: 0.23% Year-to-date Change: 42.0% | |
| LU Links: Profile News Message Board | |
| Charts:- Daily , Weekly | |
| Add LU to Watchlist: View: Get Complete LU Trend Analysis ➞ | |
 | SMI Semiconductor Manufacturing International Corporation |
| Sector: Technology | |
| SubSector: Semiconductor - Integrated Circuits | |
| MarketCap: 6287.56 Millions | |
| Recent Price: 45.73 Smart Investing & Trading Score: 43 | |
| Day Percent Change: 0.01% Day Change: 0.00 | |
| Week Change: 0.01% Year-to-date Change: -1.6% | |
| SMI Links: Profile News Message Board | |
| Charts:- Daily , Weekly | |
| Add SMI to Watchlist: View: Get Complete SMI Trend Analysis ➞ | |
 | AIXI Xiao-I Corporation |
| Sector: Technology | |
| SubSector: Software - Application | |
| MarketCap: 431 Millions | |
| Recent Price: 1.42 Smart Investing & Trading Score: 27 | |
| Day Percent Change: 6.77% Day Change: 0.09 | |
| Week Change: 0% Year-to-date Change: -36.9% | |
| AIXI Links: Profile News Message Board | |
| Charts:- Daily , Weekly | |
| Add AIXI to Watchlist: View: Get Complete AIXI Trend Analysis ➞ | |
 | RERE ATRenew Inc. |
| Sector: Services & Goods | |
| SubSector: Internet Retail | |
| MarketCap: 672 Millions | |
| Recent Price: 1.58 Smart Investing & Trading Score: 46 | |
| Day Percent Change: 1.94% Day Change: 0.03 | |
| Week Change: 0% Year-to-date Change: -16.4% | |
| RERE Links: Profile News Message Board | |
| Charts:- Daily , Weekly | |
| Add RERE to Watchlist: View: Get Complete RERE Trend Analysis ➞ | |
 | FENG Phoenix New Media Limited |
| Sector: Technology | |
| SubSector: Internet Information Providers | |
| MarketCap: 107.08 Millions | |
| Recent Price: 1.82 Smart Investing & Trading Score: 43 | |
| Day Percent Change: -2.15% Day Change: -0.04 | |
| Week Change: 0% Year-to-date Change: 33.8% | |
| FENG Links: Profile News Message Board | |
| Charts:- Daily , Weekly | |
| Add FENG to Watchlist: View: Get Complete FENG Trend Analysis ➞ | |
 | SVA Sinovac Biotech Ltd. |
| Sector: Health Care | |
| SubSector: Biotechnology | |
| MarketCap: 336.88 Millions | |
| Recent Price: 6.47 Smart Investing & Trading Score: 27 | |
| Day Percent Change: 0.00% Day Change: 0.00 | |
| Week Change: 0% Year-to-date Change: 0.0% | |
| SVA Links: Profile News Message Board | |
| Charts:- Daily , Weekly | |
| Add SVA to Watchlist: View: Get Complete SVA Trend Analysis ➞ | |
 | CNF CNFinance Holdings Limited |
| Sector: Financials | |
| SubSector: Credit Services | |
| MarketCap: 277.408 Millions | |
| Recent Price: 1.84 Smart Investing & Trading Score: 17 | |
| Day Percent Change: -0.81% Day Change: -0.02 | |
| Week Change: -0.27% Year-to-date Change: -17.3% | |
| CNF Links: Profile News Message Board | |
| Charts:- Daily , Weekly | |
| Add CNF to Watchlist: View: Get Complete CNF Trend Analysis ➞ | |
 | QSG QuantaSing Group Limited |
| Sector: Consumer Staples | |
| SubSector: Education & Training Services | |
| MarketCap: 433 Millions | |
| Recent Price: 3.34 Smart Investing & Trading Score: 20 | |
| Day Percent Change: 1.68% Day Change: 0.06 | |
| Week Change: -0.45% Year-to-date Change: 105.9% | |
| QSG Links: Profile News Message Board | |
| Charts:- Daily , Weekly | |
| Add QSG to Watchlist: View: Get Complete QSG Trend Analysis ➞ | |
 | NTES NetEase, Inc. |
| Sector: Technology | |
| SubSector: Internet Software & Services | |
| MarketCap: 40105.1 Millions | |
| Recent Price: 93.07 Smart Investing & Trading Score: 25 | |
| Day Percent Change: -1.91% Day Change: -1.81 | |
| Week Change: -0.47% Year-to-date Change: -0.1% | |
| NTES Links: Profile News Message Board | |
| Charts:- Daily , Weekly | |
| Add NTES to Watchlist: View: Get Complete NTES Trend Analysis ➞ | |
| For tabular summary view of above stock list: Summary View ➞ 0 - 25 , 25 - 50 , 50 - 75 , 75 - 100 , 100 - 125 , 125 - 150 | ||
| Click To Change The Sort Order: By Market Cap or Company Size Performance: Year-to-date, Week and Day | |
| Select Chart Type: | ||
|
Best Stocks Today 12Stocks.com |
© 2024 12Stocks.com Terms & Conditions Privacy Contact Us
All Information Provided Only For Education And Not To Be Used For Investing or Trading. See Terms & Conditions


One More Thing ... Get Best Stocks Delivered Daily!
Never Ever Miss A Move With Our Top Ten Stocks Lists
Find Best Stocks In Any Market - Bull or Bear Market
Take A Peek At Our Top Ten Stocks Lists: Daily, Weekly, Year-to-Date & Top Trends
Find Best Stocks In Any Market - Bull or Bear Market
Take A Peek At Our Top Ten Stocks Lists: Daily, Weekly, Year-to-Date & Top Trends
China Stocks With Best Up Trends [0-bearish to 100-bullish]: Hutchison China[100], iQIYI [100], Xunlei [100], Tencent Music[100], MINISO [100], Full Truck[100], JD.com [100], Baozun [95], Yatsen Holding[95], Trip.com [93], MOGU [93]
Best China Stocks Year-to-Date:
U Power[2801.79%], DouYu [783.16%], MicroCloud Hologram[642.45%], China Liberal[498.43%], Yatsen Holding[437.18%], Zhongchao [369.73%], Uxin [136.8%], QuantaSing [105.86%], GigaCloud [102.02%], Cheetah Mobile[78.07%], Bright Scholar[64.8%] Best China Stocks This Week:
Cheetah Mobile[14.69%], Pinduoduo [12.8%], iQIYI [12.12%], China Online[11.9%], Hutchison China[10.67%], Tuya [10.19%], Baozun [9.91%], Hywin [8.88%], Yatsen Holding[8.71%], Tencent Music[8.45%], Qudian [8.33%] Best China Stocks Daily:
Golden Heaven[11.75%], 17 Education[10.07%], China Online[9.37%], Uxin [9.21%], Ebang [9.17%], Cheetah Mobile[8.85%], Aesthetic Medical[8.02%], Zhongchao [7.86%], Hutchison China[7.73%], U Power[7.00%], Xiao-I [6.77%]