
 Login Sign Up


| |||||
 |  | ||||

| 12Stocks.com Market Intelligence |
Best China Stocks
|
On this page, you will find the most comprehensive analysis of Chinese stocks and ETFs - from latest trends to performances to charts ➞. First, here are the year-to-date (YTD) performances of the most requested China stocks at 12Stocks.com (click stock for review):
| New Oriental 19% | ||
| Sohu.com 10% | ||
| NetEase -1% | ||
| Alibaba -11% | ||
| JD.com -12% | ||
| Vipshop -15% | ||
| JOYY -18% | ||
| Baidu -20% | ||
| Weibo -26% | ||
| In a hurry? China Stocks Lists: Performance Trends Table, Stock Charts
Sort China stocks: Daily, Weekly, Year-to-Date, Market Cap & Trends. Filter China stocks list by sector: Show all, Tech, Finance, Energy, Staples, Retail, Industrial, Materials, Utilities and HealthCare Filter China stocks list by size: All China Large Medium Small and MicroCap |
| April 19, 2024 - 12Stocks.com China Stocks Performances & Trends Daily | |||||||||
|
|  The overall Smart Investing & Trading Score is 73 (0-bearish to 100-bullish) which puts China index in short term neutral to bullish trend. The Smart Investing & Trading Score from previous trading session is 36 and hence an improvement of trend.
| ||||||||
| Here are the Smart Investing & Trading Scores of the most requested China stocks at 12Stocks.com (click stock name for detailed review): |


| 12Stocks.com: Top Performing China Index Stocks | ||||||||||||||||||||||||||||||||||||||||||||||||
 The top performing China Index stocks year to date are
Now, more recently, over last week, the top performing China Index stocks on the move are


|
||||||||||||||||||||||||||||||||||||||||||||||||
| 12Stocks.com: Investing in China Index with Stocks | |
|
The following table helps investors and traders sort through current performance and trends (as measured by Smart Investing & Trading Score) of various
stocks in the China Index. Quick View: Move mouse or cursor over stock symbol (ticker) to view short-term technical chart and over stock name to view long term chart. Click on  to add stock symbol to your watchlist and to add stock symbol to your watchlist and  to view watchlist. Click on any ticker or stock name for detailed market intelligence report for that stock. to view watchlist. Click on any ticker or stock name for detailed market intelligence report for that stock. |
12Stocks.com Performance of Stocks in China Index
| Ticker | Stock Name | Watchlist | Category | Recent Price | Smart Investing & Trading Score | Change % | Weekly Change% |
| IMAB | I Mab |   | Health Care | 1.80 | 48 | -0.55% | -0.55% |
| ZLAB | Zai Lab | | Health Care | 14.22 | 28 | 3.64% | -0.63% |
| LI | Li Auto | | Services & Goods | 29.19 | 58 | 1.60% | -0.68% |
| YY | JOYY | | Technology | 32.66 | 88 | 1.40% | -0.73% |
| DUO | Fangdd Network | | Financials | 0.40 | 32 | 2.83% | -0.74% |
| VIOT | Viomi | | Technology | 0.55 | 25 | 1.02% | -0.82% |
| BEST | BEST | | Consumer Staples | 2.08 | 10 | -0.05% | -0.95% |
| EBON | Ebang | | Technology | 8.24 | 32 | 4.97% | -1.08% |
| YMM | Full Truck | | Technology | 7.62 | 63 | 0.79% | -1.17% |
| HUYA | HUYA | | Services & Goods | 4.51 | 56 | 1.58% | -1.31% |
| XNET | Xunlei | | Technology | 1.48 | 42 | 0.68% | -1.34% |
| MNSO | MINISO | | Services & Goods | 20.88 | 76 | 1.56% | -1.37% |
| KC | Kingsoft Cloud | | Technology | 2.66 | 51 | 1.92% | -1.48% |
| PDD | Pinduoduo | | Services & Goods | 113.70 | 35 | 0.24% | -1.56% |
| JFIN | Jiayin | | Technology | 6.36 | 36 | -0.24% | -1.63% |
| ICG | Intchains | | Technology | 8.10 | 17 | 0.00% | -1.82% |
| BIDU | Baidu | | Technology | 95.58 | 25 | 1.24% | -2.01% |
| PT | Pintec | | Technology | 1.06 | 0 | 0.00% | -2.29% |
| WDH | Waterdrop | | Financials | 1.22 | 53 | -0.81% | -2.40% |
| UTSI | UTStarcom | | Technology | 2.63 | 25 | -1.13% | -2.59% |
| XIN | Xinyuan Real | | Financials | 2.60 | 7 | -3.17% | -2.62% |
| NIO | NIO | | Consumer Staples | 4.00 | 42 | 2.30% | -2.68% |
| DQ | Daqo New | | Technology | 22.71 | 46 | 1.43% | -2.70% |
| TWN | Taiwan Fund | | Financials | 38.20 | 43 | 0.61% | -2.72% |
| WIMI | WiMi Hologram | | Technology | 0.71 | 58 | 5.84% | -2.74% |
| For chart view version of above stock list: Chart View ➞ 0 - 25 , 25 - 50 , 50 - 75 , 75 - 100 , 100 - 125 , 125 - 150 | ||
 | Click To Change The Sort Order: By Market Cap or Company Size Performance: Year-to-date, Week and Day |  |
|
Get the most comprehensive stock market coverage daily at 12Stocks.com ➞ Best Stocks Today ➞ Best Stocks Weekly ➞ Best Stocks Year-to-Date ➞ Best Stocks Trends ➞  Best Stocks Today 12Stocks.com Best Nasdaq Stocks ➞ Best S&P 500 Stocks ➞ Best Tech Stocks ➞ Best Biotech Stocks ➞ |
| Detailed Overview of China Stocks |
| China Technical Overview, Leaders & Laggards, Top China ETF Funds & Detailed China Stocks List, Charts, Trends & More |
| China: Technical Analysis, Trends & YTD Performance | |
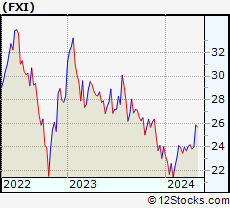
 FXI Weekly Chart |
|
| Long Term Trend: Very Good | |
| Medium Term Trend: Good | |
 FXI Daily Chart |
|
| Short Term Trend: Very Good | |
| Overall Trend Score: 73 | |
| YTD Performance: 0.21% | |
| **Trend Scores & Views Are Only For Educational Purposes And Not For Investing | |
| 12Stocks.com: Investing in China Index using Exchange Traded Funds | |
|
The following table shows list of key exchange traded funds (ETF) that
help investors play China stock market. For detailed view, check out our ETF Funds section of our website. Quick View: Move mouse or cursor over ETF symbol (ticker) to view short-term technical chart and over ETF name to view long term chart. Click on ticker or stock name for detailed view. Click on to add stock symbol to your watchlist and to view watchlist. |
12Stocks.com List of ETFs that track China Index
| Ticker | ETF Name | Watchlist | Recent Price | Smart Investing & Trading Score | Change % | Week % | Year-to-date % |
| FXI | China Large-Cap | | 24.08 | 73 | 1.82 | 1.01 | 0.21% |
| EWH | Hong Kong | | 14.74 | 17 | 0.61 | -2.77 | -15.14% |
| YINN | China Bull 3X | | 18.81 | 73 | 5.08 | 2.28 | -10.17% |
| YANG | China Bear 3X | | 11.58 | 25 | -5.47 | -2.61 | -9.53% |
| XPP | China 50 | | 12.99 | 66 | 3.16 | 1.64 | -5.49% |
| MCHI | China | | 39.54 | 73 | 1.28 | 0.66 | -2.95% |
| GXC | China | | 65.52 | 73 | 1.02 | 0.69 | -3.82% |
| CBON | ChinaAMC China Bond | | 21.92 | 55 | -0.15 | 0.26 | -0.83% |
| 12Stocks.com: Charts, Trends, Fundamental Data and Performances of China Stocks | |
|
We now take in-depth look at all China stocks including charts, multi-period performances and overall trends (as measured by Smart Investing & Trading Score). One can sort China stocks (click link to choose) by Daily, Weekly and by Year-to-Date performances. Also, one can sort by size of the company or by market capitalization. |
| Select Your Default Chart Type: | |||||
| |||||
| Click on stock symbol or name for detailed view. Click on to add stock symbol to your watchlist and to view watchlist. Quick View: Move mouse or cursor over "Daily" to quickly view daily technical stock chart and over "Weekly" to view weekly technical stock chart. | |||||

 | IMAB I Mab |
| Sector: Health Care | |
| SubSector: Biotechnology | |
| MarketCap: 26187 Millions | |
| Recent Price: 1.80 Smart Investing & Trading Score: 48 | |
| Day Percent Change: -0.55% Day Change: -0.01 | |
| Week Change: -0.55% Year-to-date Change: -5.3% | |
| IMAB Links: Profile News Message Board | |
| Charts:- Daily , Weekly | |
| Add IMAB to Watchlist: View: Get Complete IMAB Trend Analysis ➞ | |
 | ZLAB Zai Lab Limited |
| Sector: Health Care | |
| SubSector: Biotechnology | |
| MarketCap: 3970.35 Millions | |
| Recent Price: 14.22 Smart Investing & Trading Score: 28 | |
| Day Percent Change: 3.64% Day Change: 0.50 | |
| Week Change: -0.63% Year-to-date Change: -48.0% | |
| ZLAB Links: Profile News Message Board | |
| Charts:- Daily , Weekly | |
| Add ZLAB to Watchlist: View: Get Complete ZLAB Trend Analysis ➞ | |
 | LI Li Auto Inc. |
| Sector: Services & Goods | |
| SubSector: Auto Manufacturers | |
| MarketCap: 29167 Millions | |
| Recent Price: 29.19 Smart Investing & Trading Score: 58 | |
| Day Percent Change: 1.60% Day Change: 0.46 | |
| Week Change: -0.68% Year-to-date Change: -22.0% | |
| LI Links: Profile News Message Board | |
| Charts:- Daily , Weekly | |
| Add LI to Watchlist: View: Get Complete LI Trend Analysis ➞ | |
 | YY JOYY Inc. |
| Sector: Technology | |
| SubSector: Internet Information Providers | |
| MarketCap: 3527.6 Millions | |
| Recent Price: 32.66 Smart Investing & Trading Score: 88 | |
| Day Percent Change: 1.40% Day Change: 0.45 | |
| Week Change: -0.73% Year-to-date Change: -17.7% | |
| YY Links: Profile News Message Board | |
| Charts:- Daily , Weekly | |
| Add YY to Watchlist: View: Get Complete YY Trend Analysis ➞ | |
 | DUO Fangdd Network Group Ltd. |
| Sector: Financials | |
| SubSector: Property Management | |
| MarketCap: 783.142 Millions | |
| Recent Price: 0.40 Smart Investing & Trading Score: 32 | |
| Day Percent Change: 2.83% Day Change: 0.01 | |
| Week Change: -0.74% Year-to-date Change: -40.6% | |
| DUO Links: Profile News Message Board | |
| Charts:- Daily , Weekly | |
| Add DUO to Watchlist: View: Get Complete DUO Trend Analysis ➞ | |
 | VIOT Viomi Technology Co., Ltd |
| Sector: Technology | |
| SubSector: Electronic Equipment | |
| MarketCap: 357.2 Millions | |
| Recent Price: 0.55 Smart Investing & Trading Score: 25 | |
| Day Percent Change: 1.02% Day Change: 0.01 | |
| Week Change: -0.82% Year-to-date Change: -45.5% | |
| VIOT Links: Profile News Message Board | |
| Charts:- Daily , Weekly | |
| Add VIOT to Watchlist: View: Get Complete VIOT Trend Analysis ➞ | |
 | BEST BEST Inc. |
| Sector: Consumer Staples | |
| SubSector: Packaging & Containers | |
| MarketCap: 1981.73 Millions | |
| Recent Price: 2.08 Smart Investing & Trading Score: 10 | |
| Day Percent Change: -0.05% Day Change: 0.00 | |
| Week Change: -0.95% Year-to-date Change: -18.5% | |
| BEST Links: Profile News Message Board | |
| Charts:- Daily , Weekly | |
| Add BEST to Watchlist: View: Get Complete BEST Trend Analysis ➞ | |
 | EBON Ebang International Holdings Inc. |
| Sector: Technology | |
| SubSector: Computer Hardware | |
| MarketCap: 33787 Millions | |
| Recent Price: 8.24 Smart Investing & Trading Score: 32 | |
| Day Percent Change: 4.97% Day Change: 0.39 | |
| Week Change: -1.08% Year-to-date Change: -46.1% | |
| EBON Links: Profile News Message Board | |
| Charts:- Daily , Weekly | |
| Add EBON to Watchlist: View: Get Complete EBON Trend Analysis ➞ | |
 | YMM Full Truck Alliance Co. Ltd. |
| Sector: Technology | |
| SubSector: Software - Application | |
| MarketCap: 6960 Millions | |
| Recent Price: 7.62 Smart Investing & Trading Score: 63 | |
| Day Percent Change: 0.79% Day Change: 0.06 | |
| Week Change: -1.17% Year-to-date Change: 8.9% | |
| YMM Links: Profile News Message Board | |
| Charts:- Daily , Weekly | |
| Add YMM to Watchlist: View: Get Complete YMM Trend Analysis ➞ | |
 | HUYA HUYA Inc. |
| Sector: Services & Goods | |
| SubSector: Entertainment - Diversified | |
| MarketCap: 3358.17 Millions | |
| Recent Price: 4.51 Smart Investing & Trading Score: 56 | |
| Day Percent Change: 1.58% Day Change: 0.07 | |
| Week Change: -1.31% Year-to-date Change: 23.2% | |
| HUYA Links: Profile News Message Board | |
| Charts:- Daily , Weekly | |
| Add HUYA to Watchlist: View: Get Complete HUYA Trend Analysis ➞ | |
 | XNET Xunlei Limited |
| Sector: Technology | |
| SubSector: Application Software | |
| MarketCap: 203.662 Millions | |
| Recent Price: 1.48 Smart Investing & Trading Score: 42 | |
| Day Percent Change: 0.68% Day Change: 0.01 | |
| Week Change: -1.34% Year-to-date Change: -9.0% | |
| XNET Links: Profile News Message Board | |
| Charts:- Daily , Weekly | |
| Add XNET to Watchlist: View: Get Complete XNET Trend Analysis ➞ | |
 | MNSO MINISO Group Holding Limited |
| Sector: Services & Goods | |
| SubSector: Specialty Retail | |
| MarketCap: 69427 Millions | |
| Recent Price: 20.88 Smart Investing & Trading Score: 76 | |
| Day Percent Change: 1.56% Day Change: 0.32 | |
| Week Change: -1.37% Year-to-date Change: 2.4% | |
| MNSO Links: Profile News Message Board | |
| Charts:- Daily , Weekly | |
| Add MNSO to Watchlist: View: Get Complete MNSO Trend Analysis ➞ | |
 | KC Kingsoft Cloud Holdings Limited |
| Sector: Technology | |
| SubSector: Software Application | |
| MarketCap: 98487 Millions | |
| Recent Price: 2.66 Smart Investing & Trading Score: 51 | |
| Day Percent Change: 1.92% Day Change: 0.05 | |
| Week Change: -1.48% Year-to-date Change: -29.7% | |
| KC Links: Profile News Message Board | |
| Charts:- Daily , Weekly | |
| Add KC to Watchlist: View: Get Complete KC Trend Analysis ➞ | |
 | PDD Pinduoduo Inc. |
| Sector: Services & Goods | |
| SubSector: Specialty Retail, Other | |
| MarketCap: 41696.2 Millions | |
| Recent Price: 113.70 Smart Investing & Trading Score: 35 | |
| Day Percent Change: 0.24% Day Change: 0.27 | |
| Week Change: -1.56% Year-to-date Change: -22.3% | |
| PDD Links: Profile News Message Board | |
| Charts:- Daily , Weekly | |
| Add PDD to Watchlist: View: Get Complete PDD Trend Analysis ➞ | |
 | JFIN Jiayin Group Inc. |
| Sector: Technology | |
| SubSector: Internet Information Providers | |
| MarketCap: 131.48 Millions | |
| Recent Price: 6.36 Smart Investing & Trading Score: 36 | |
| Day Percent Change: -0.24% Day Change: -0.01 | |
| Week Change: -1.63% Year-to-date Change: 22.7% | |
| JFIN Links: Profile News Message Board | |
| Charts:- Daily , Weekly | |
| Add JFIN to Watchlist: View: Get Complete JFIN Trend Analysis ➞ | |
 | ICG Intchains Group Limited |
| Sector: Technology | |
| SubSector: Semiconductors | |
| MarketCap: 450 Millions | |
| Recent Price: 8.10 Smart Investing & Trading Score: 17 | |
| Day Percent Change: 0.00% Day Change: 0.00 | |
| Week Change: -1.82% Year-to-date Change: -34.2% | |
| ICG Links: Profile News Message Board | |
| Charts:- Daily , Weekly | |
| Add ICG to Watchlist: View: Get Complete ICG Trend Analysis ➞ | |
 | BIDU Baidu, Inc. |
| Sector: Technology | |
| SubSector: Internet Information Providers | |
| MarketCap: 33525.9 Millions | |
| Recent Price: 95.58 Smart Investing & Trading Score: 25 | |
| Day Percent Change: 1.24% Day Change: 1.17 | |
| Week Change: -2.01% Year-to-date Change: -19.7% | |
| BIDU Links: Profile News Message Board | |
| Charts:- Daily , Weekly | |
| Add BIDU to Watchlist: View: Get Complete BIDU Trend Analysis ➞ | |
 | PT Pintec Technology Holdings Limited |
| Sector: Technology | |
| SubSector: Wireless Communications | |
| MarketCap: 87.7827 Millions | |
| Recent Price: 1.06 Smart Investing & Trading Score: 0 | |
| Day Percent Change: 0.00% Day Change: 0.00 | |
| Week Change: -2.29% Year-to-date Change: -4.1% | |
| PT Links: Profile News Message Board | |
| Charts:- Daily , Weekly | |
| Add PT to Watchlist: View: Get Complete PT Trend Analysis ➞ | |
 | WDH Waterdrop Inc. |
| Sector: Financials | |
| SubSector: Insurance - Diversified | |
| MarketCap: 874 Millions | |
| Recent Price: 1.22 Smart Investing & Trading Score: 53 | |
| Day Percent Change: -0.81% Day Change: -0.01 | |
| Week Change: -2.4% Year-to-date Change: 16.5% | |
| WDH Links: Profile News Message Board | |
| Charts:- Daily , Weekly | |
| Add WDH to Watchlist: View: Get Complete WDH Trend Analysis ➞ | |
 | UTSI UTStarcom Holdings Corp. |
| Sector: Technology | |
| SubSector: Communication Equipment | |
| MarketCap: 76.6539 Millions | |
| Recent Price: 2.63 Smart Investing & Trading Score: 25 | |
| Day Percent Change: -1.13% Day Change: -0.03 | |
| Week Change: -2.59% Year-to-date Change: -23.6% | |
| UTSI Links: Profile News Message Board | |
| Charts:- Daily , Weekly | |
| Add UTSI to Watchlist: View: Get Complete UTSI Trend Analysis ➞ | |
 | XIN Xinyuan Real Estate Co., Ltd. |
| Sector: Financials | |
| SubSector: Real Estate Development | |
| MarketCap: 136.119 Millions | |
| Recent Price: 2.60 Smart Investing & Trading Score: 7 | |
| Day Percent Change: -3.17% Day Change: -0.08 | |
| Week Change: -2.62% Year-to-date Change: -4.4% | |
| XIN Links: Profile News Message Board | |
| Charts:- Daily , Weekly | |
| Add XIN to Watchlist: View: Get Complete XIN Trend Analysis ➞ | |
 | NIO NIO Limited |
| Sector: Consumer Staples | |
| SubSector: Auto Manufacturers - Major | |
| MarketCap: 2679.71 Millions | |
| Recent Price: 4.00 Smart Investing & Trading Score: 42 | |
| Day Percent Change: 2.30% Day Change: 0.09 | |
| Week Change: -2.68% Year-to-date Change: -55.9% | |
| NIO Links: Profile News Message Board | |
| Charts:- Daily , Weekly | |
| Add NIO to Watchlist: View: Get Complete NIO Trend Analysis ➞ | |
 | DQ Daqo New Energy Corp. |
| Sector: Technology | |
| SubSector: Semiconductor Equipment & Materials | |
| MarketCap: 660.918 Millions | |
| Recent Price: 22.71 Smart Investing & Trading Score: 46 | |
| Day Percent Change: 1.43% Day Change: 0.32 | |
| Week Change: -2.7% Year-to-date Change: -14.6% | |
| DQ Links: Profile News Message Board | |
| Charts:- Daily , Weekly | |
| Add DQ to Watchlist: View: Get Complete DQ Trend Analysis ➞ | |
 | TWN The Taiwan Fund, Inc. |
| Sector: Financials | |
| SubSector: Closed-End Fund - Foreign | |
| MarketCap: 110.547 Millions | |
| Recent Price: 38.20 Smart Investing & Trading Score: 43 | |
| Day Percent Change: 0.61% Day Change: 0.23 | |
| Week Change: -2.72% Year-to-date Change: 10.4% | |
| TWN Links: Profile News Message Board | |
| Charts:- Daily , Weekly | |
| Add TWN to Watchlist: View: Get Complete TWN Trend Analysis ➞ | |
 | WIMI WiMi Hologram Cloud Inc. |
| Sector: Technology | |
| SubSector: Advertising Agencies | |
| MarketCap: 41837 Millions | |
| Recent Price: 0.71 Smart Investing & Trading Score: 58 | |
| Day Percent Change: 5.84% Day Change: 0.04 | |
| Week Change: -2.74% Year-to-date Change: -11.9% | |
| WIMI Links: Profile News Message Board | |
| Charts:- Daily , Weekly | |
| Add WIMI to Watchlist: View: Get Complete WIMI Trend Analysis ➞ | |
| For tabular summary view of above stock list: Summary View ➞ 0 - 25 , 25 - 50 , 50 - 75 , 75 - 100 , 100 - 125 , 125 - 150 | ||
| Click To Change The Sort Order: By Market Cap or Company Size Performance: Year-to-date, Week and Day | |
| Select Chart Type: | ||
|
Best Stocks Today 12Stocks.com |
© 2024 12Stocks.com Terms & Conditions Privacy Contact Us
All Information Provided Only For Education And Not To Be Used For Investing or Trading. See Terms & Conditions


One More Thing ... Get Best Stocks Delivered Daily!
Never Ever Miss A Move With Our Top Ten Stocks Lists
Find Best Stocks In Any Market - Bull or Bear Market
Take A Peek At Our Top Ten Stocks Lists: Daily, Weekly, Year-to-Date & Top Trends
Find Best Stocks In Any Market - Bull or Bear Market
Take A Peek At Our Top Ten Stocks Lists: Daily, Weekly, Year-to-Date & Top Trends
China Stocks With Best Up Trends [0-bearish to 100-bullish]: Zhongchao [100], GigaCloud [100], Smart Share[93], DouYu [90], So-Young [88], GDS [88], JOYY [88], U Power[83], Tencent Music[83], Lufax Holding[83], Yatsen Holding[83]
Best China Stocks Year-to-Date:
U Power[2874.33%], Zhongchao [825.77%], DouYu [745.26%], MicroCloud Hologram[734.53%], China Liberal[459.28%], Yatsen Holding[389.34%], Uxin [136.8%], QuantaSing [112.65%], GigaCloud [100.82%], Yiren Digital[55.45%], Bright Scholar[50.4%] Best China Stocks This Week:
Zhongchao [106.1%], Regencell Bioscience[37.01%], Yatsen Holding[18.94%], TH [18.18%], Secoo Holding[11.83%], Smart Share[9.93%], GigaCloud [8.8%], EHang [8.29%], Momo [7.17%], SunCar [7%], Quhuo [6.85%] Best China Stocks Daily:
Zhongchao [146.72%], MicroCloud Hologram[30.04%], TH [25.00%], Golden Heaven[21.20%], Regencell Bioscience[10.20%], MingZhu Logistics[9.54%], Secoo Holding[9.32%], Cheetah Mobile[9.06%], Quhuo [8.36%], U Power[8.11%], 17 Education[7.05%]