
 Login Sign Up


| |||||
 |  | ||||

| 12Stocks.com Market Intelligence |
Best China Stocks
|
On this page, you will find the most comprehensive analysis of Chinese stocks and ETFs - from latest trends to performances to charts ➞. First, here are the year-to-date (YTD) performances of the most requested China stocks at 12Stocks.com (click stock for review):
| Sohu.com 13% | ||
| New Oriental 9% | ||
| NetEase 1% | ||
| JD.com -1% | ||
| Alibaba -3% | ||
| Vipshop -11% | ||
| Baidu -16% | ||
| JOYY -16% | ||
| Weibo -23% | ||
| In a hurry? China Stocks Lists: Performance Trends Table, Stock Charts
Sort China stocks: Daily, Weekly, Year-to-Date, Market Cap & Trends. Filter China stocks list by sector: Show all, Tech, Finance, Energy, Staples, Retail, Industrial, Materials, Utilities and HealthCare Filter China stocks list by size: All China Large Medium Small and MicroCap |
| April 25, 2024 - 12Stocks.com China Stocks Performances & Trends Daily | |||||||||
|
|  The overall Smart Investing & Trading Score is 100 (0-bearish to 100-bullish) which puts China index in short term bullish trend. The Smart Investing & Trading Score from previous trading session is 74 and an improvement of trend continues.
| ||||||||
| Here are the Smart Investing & Trading Scores of the most requested China stocks at 12Stocks.com (click stock name for detailed review): |


| 12Stocks.com: Top Performing China Index Stocks | ||||||||||||||||||||||||||||||||||||||||||||||||
 The top performing China Index stocks year to date are
Now, more recently, over last week, the top performing China Index stocks on the move are


|
||||||||||||||||||||||||||||||||||||||||||||||||
| 12Stocks.com: Investing in China Index with Stocks | |
|
The following table helps investors and traders sort through current performance and trends (as measured by Smart Investing & Trading Score) of various
stocks in the China Index. Quick View: Move mouse or cursor over stock symbol (ticker) to view short-term technical chart and over stock name to view long term chart. Click on  to add stock symbol to your watchlist and to add stock symbol to your watchlist and  to view watchlist. Click on any ticker or stock name for detailed market intelligence report for that stock. to view watchlist. Click on any ticker or stock name for detailed market intelligence report for that stock. |
12Stocks.com Performance of Stocks in China Index
| Ticker | Stock Name | Watchlist | Category | Recent Price | Smart Investing & Trading Score | Change % | YTD Change% |
| YY | JOYY |   | Technology | 33.19 | 73 | -0.57% | -16.40% |
| HUYA | HUYA | | Services & Goods | 4.40 | 41 | -4.56% | 20.22% |
| RLX | RLX | | Consumer Staples | 1.86 | 32 | -0.80% | -6.06% |
| SDA | SunCar | | Services & Goods | 7.46 | 67 | 1.43% | -3.99% |
| NIO | NIO | | Consumer Staples | 4.12 | 20 | -0.72% | -54.58% |
| DOYU | DouYu | | Technology | 8.41 | 88 | -1.81% | 785.79% |
| HCM | Hutchison China | | Health Care | 19.02 | 85 | 3.29% | 5.00% |
| ATAT | Atour Lifestyle | | Services & Goods | 18.29 | 83 | 0.19% | 4.39% |
| DAO | Youdao | | Technology | 3.59 | 41 | -0.14% | -9.01% |
| BEST | BEST | | Consumer Staples | 2.11 | 10 | -0.47% | -17.30% |
| VNET | 21Vianet | | Technology | 1.64 | 42 | 3.80% | -42.86% |
| LX | LexinFintech | | Financials | 1.69 | 10 | -0.59% | -8.15% |
| BZUN | Baozun | | Services & Goods | 2.64 | 95 | -0.75% | -3.65% |
| NOAH | Noah | | Financials | 11.99 | 71 | -1.64% | -13.18% |
| FANH | Fanhua | | Financials | 3.55 | 42 | 0.00% | -46.62% |
| MSC | Studio City | | Services & Goods | 7.31 | 46 | 1.11% | 12.81% |
| HSAI | Hesai | | Services & Goods | 4.18 | 45 | -3.57% | -53.91% |
| HKD | AMTD Digital | | Technology | 3.20 | 74 | -5.33% | -22.52% |
| GHG | GreenTree Hospitality | | Services & Goods | 2.76 | 10 | -7.69% | -26.60% |
| TUYA | Tuya | | Technology | 1.65 | 35 | 0.00% | -28.10% |
| SY | So-Young | | Technology | 1.22 | 68 | 0.00% | -5.43% |
| QFIN | 360 Finance | | Financials | 18.53 | 46 | -1.07% | 17.13% |
| CANG | Cango | | Technology | 1.39 | 49 | 0.72% | 36.27% |
| WDH | Waterdrop | | Financials | 1.19 | 53 | -0.42% | 13.18% |
| BEDU | Bright Scholar | | Services & Goods | 1.99 | 46 | 4.74% | 59.20% |
| For chart view version of above stock list: Chart View ➞ 0 - 25 , 25 - 50 , 50 - 75 , 75 - 100 , 100 - 125 , 125 - 150 | ||
 | Click To Change The Sort Order: By Market Cap or Company Size Performance: Year-to-date, Week and Day |  |
|
Get the most comprehensive stock market coverage daily at 12Stocks.com ➞ Best Stocks Today ➞ Best Stocks Weekly ➞ Best Stocks Year-to-Date ➞ Best Stocks Trends ➞  Best Stocks Today 12Stocks.com Best Nasdaq Stocks ➞ Best S&P 500 Stocks ➞ Best Tech Stocks ➞ Best Biotech Stocks ➞ |
| Detailed Overview of China Stocks |
| China Technical Overview, Leaders & Laggards, Top China ETF Funds & Detailed China Stocks List, Charts, Trends & More |
| China: Technical Analysis, Trends & YTD Performance | |
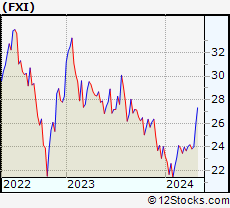
 FXI Weekly Chart |
|
| Long Term Trend: Very Good | |
| Medium Term Trend: Very Good | |
 FXI Daily Chart |
|
| Short Term Trend: Very Good | |
| Overall Trend Score: 100 | |
| YTD Performance: 5.64% | |
| **Trend Scores & Views Are Only For Educational Purposes And Not For Investing | |
| 12Stocks.com: Investing in China Index using Exchange Traded Funds | |
|
The following table shows list of key exchange traded funds (ETF) that
help investors play China stock market. For detailed view, check out our ETF Funds section of our website. Quick View: Move mouse or cursor over ETF symbol (ticker) to view short-term technical chart and over ETF name to view long term chart. Click on ticker or stock name for detailed view. Click on to add stock symbol to your watchlist and to view watchlist. |
12Stocks.com List of ETFs that track China Index
| Ticker | ETF Name | Watchlist | Recent Price | Smart Investing & Trading Score | Change % | Week % | Year-to-date % |
| FXI | China Large-Cap | | 25.39 | 100 | 0.46 | 5.73 | 5.64% |
| EWH | Hong Kong | | 15.71 | 80 | 1.32 | 6.84 | -9.59% |
| YINN | China Bull 3X | | 21.95 | 100 | 1.62 | 16.94 | 4.82% |
| YANG | China Bear 3X | | 9.89 | 0 | -1.49 | -15.25 | -22.73% |
| XPP | China 50 | | 14.45 | 100 | 0.59 | 11.39 | 5.09% |
| MCHI | China | | 41.48 | 100 | 0.33 | 5.24 | 1.8% |
| GXC | China | | 68.10 | 100 | 0.50 | 4.24 | -0.03% |
| CBON | ChinaAMC China Bond | | 21.88 | 48 | 0.32 | -0.21 | -0.99% |
| 12Stocks.com: Charts, Trends, Fundamental Data and Performances of China Stocks | |
|
We now take in-depth look at all China stocks including charts, multi-period performances and overall trends (as measured by Smart Investing & Trading Score). One can sort China stocks (click link to choose) by Daily, Weekly and by Year-to-Date performances. Also, one can sort by size of the company or by market capitalization. |
| Select Your Default Chart Type: | |||||
| |||||
| Click on stock symbol or name for detailed view. Click on to add stock symbol to your watchlist and to view watchlist. Quick View: Move mouse or cursor over "Daily" to quickly view daily technical stock chart and over "Weekly" to view weekly technical stock chart. | |||||

 | YY JOYY Inc. |
| Sector: Technology | |
| SubSector: Internet Information Providers | |
| MarketCap: 3527.6 Millions | |
| Recent Price: 33.19 Smart Investing & Trading Score: 73 | |
| Day Percent Change: -0.57% Day Change: -0.19 | |
| Week Change: 2.98% Year-to-date Change: -16.4% | |
| YY Links: Profile News Message Board | |
| Charts:- Daily , Weekly | |
| Add YY to Watchlist: View: Get Complete YY Trend Analysis ➞ | |
 | HUYA HUYA Inc. |
| Sector: Services & Goods | |
| SubSector: Entertainment - Diversified | |
| MarketCap: 3358.17 Millions | |
| Recent Price: 4.40 Smart Investing & Trading Score: 41 | |
| Day Percent Change: -4.56% Day Change: -0.21 | |
| Week Change: -0.23% Year-to-date Change: 20.2% | |
| HUYA Links: Profile News Message Board | |
| Charts:- Daily , Weekly | |
| Add HUYA to Watchlist: View: Get Complete HUYA Trend Analysis ➞ | |
 | RLX RLX Technology Inc. |
| Sector: Consumer Staples | |
| SubSector: Tobacco | |
| MarketCap: 2800 Millions | |
| Recent Price: 1.86 Smart Investing & Trading Score: 32 | |
| Day Percent Change: -0.80% Day Change: -0.01 | |
| Week Change: 4.49% Year-to-date Change: -6.1% | |
| RLX Links: Profile News Message Board | |
| Charts:- Daily , Weekly | |
| Add RLX to Watchlist: View: Get Complete RLX Trend Analysis ➞ | |
 | SDA SunCar Technology Group Inc. |
| Sector: Services & Goods | |
| SubSector: Auto & Truck Dealerships | |
| MarketCap: 2680 Millions | |
| Recent Price: 7.46 Smart Investing & Trading Score: 67 | |
| Day Percent Change: 1.43% Day Change: 0.10 | |
| Week Change: 5.22% Year-to-date Change: -4.0% | |
| SDA Links: Profile News Message Board | |
| Charts:- Daily , Weekly | |
| Add SDA to Watchlist: View: Get Complete SDA Trend Analysis ➞ | |
 | NIO NIO Limited |
| Sector: Consumer Staples | |
| SubSector: Auto Manufacturers - Major | |
| MarketCap: 2679.71 Millions | |
| Recent Price: 4.12 Smart Investing & Trading Score: 20 | |
| Day Percent Change: -0.72% Day Change: -0.03 | |
| Week Change: 8.42% Year-to-date Change: -54.6% | |
| NIO Links: Profile News Message Board | |
| Charts:- Daily , Weekly | |
| Add NIO to Watchlist: View: Get Complete NIO Trend Analysis ➞ | |
 | DOYU DouYu International Holdings Limited |
| Sector: Technology | |
| SubSector: Internet Information Providers | |
| MarketCap: 2483 Millions | |
| Recent Price: 8.41 Smart Investing & Trading Score: 88 | |
| Day Percent Change: -1.81% Day Change: -0.16 | |
| Week Change: 4.53% Year-to-date Change: 785.8% | |
| DOYU Links: Profile News Message Board | |
| Charts:- Daily , Weekly | |
| Add DOYU to Watchlist: View: Get Complete DOYU Trend Analysis ➞ | |
 | HCM Hutchison China MediTech Limited |
| Sector: Health Care | |
| SubSector: Drug Manufacturers - Major | |
| MarketCap: 2324.43 Millions | |
| Recent Price: 19.02 Smart Investing & Trading Score: 85 | |
| Day Percent Change: 3.29% Day Change: 0.61 | |
| Week Change: 15.31% Year-to-date Change: 5.0% | |
| HCM Links: Profile News Message Board | |
| Charts:- Daily , Weekly | |
| Add HCM to Watchlist: View: Get Complete HCM Trend Analysis ➞ | |
 | ATAT Atour Lifestyle Holdings Limited |
| Sector: Services & Goods | |
| SubSector: Lodging | |
| MarketCap: 2120 Millions | |
| Recent Price: 18.29 Smart Investing & Trading Score: 83 | |
| Day Percent Change: 0.19% Day Change: 0.04 | |
| Week Change: 6.09% Year-to-date Change: 4.4% | |
| ATAT Links: Profile News Message Board | |
| Charts:- Daily , Weekly | |
| Add ATAT to Watchlist: View: Get Complete ATAT Trend Analysis ➞ | |
 | DAO Youdao, Inc. |
| Sector: Technology | |
| SubSector: Internet Information Providers | |
| MarketCap: 2073.2 Millions | |
| Recent Price: 3.59 Smart Investing & Trading Score: 41 | |
| Day Percent Change: -0.14% Day Change: 0.00 | |
| Week Change: 0.99% Year-to-date Change: -9.0% | |
| DAO Links: Profile News Message Board | |
| Charts:- Daily , Weekly | |
| Add DAO to Watchlist: View: Get Complete DAO Trend Analysis ➞ | |
 | BEST BEST Inc. |
| Sector: Consumer Staples | |
| SubSector: Packaging & Containers | |
| MarketCap: 1981.73 Millions | |
| Recent Price: 2.11 Smart Investing & Trading Score: 10 | |
| Day Percent Change: -0.47% Day Change: -0.01 | |
| Week Change: 1.44% Year-to-date Change: -17.3% | |
| BEST Links: Profile News Message Board | |
| Charts:- Daily , Weekly | |
| Add BEST to Watchlist: View: Get Complete BEST Trend Analysis ➞ | |
 | VNET 21Vianet Group, Inc. |
| Sector: Technology | |
| SubSector: Information Technology Services | |
| MarketCap: 1846.98 Millions | |
| Recent Price: 1.64 Smart Investing & Trading Score: 42 | |
| Day Percent Change: 3.80% Day Change: 0.06 | |
| Week Change: 10.07% Year-to-date Change: -42.9% | |
| VNET Links: Profile News Message Board | |
| Charts:- Daily , Weekly | |
| Add VNET to Watchlist: View: Get Complete VNET Trend Analysis ➞ | |
 | LX LexinFintech Holdings Ltd. |
| Sector: Financials | |
| SubSector: Credit Services | |
| MarketCap: 1674.18 Millions | |
| Recent Price: 1.69 Smart Investing & Trading Score: 10 | |
| Day Percent Change: -0.59% Day Change: -0.01 | |
| Week Change: 3.68% Year-to-date Change: -8.2% | |
| LX Links: Profile News Message Board | |
| Charts:- Daily , Weekly | |
| Add LX to Watchlist: View: Get Complete LX Trend Analysis ➞ | |
 | BZUN Baozun Inc. |
| Sector: Services & Goods | |
| SubSector: Catalog & Mail Order Houses | |
| MarketCap: 1668.92 Millions | |
| Recent Price: 2.64 Smart Investing & Trading Score: 95 | |
| Day Percent Change: -0.75% Day Change: -0.02 | |
| Week Change: 13.79% Year-to-date Change: -3.7% | |
| BZUN Links: Profile News Message Board | |
| Charts:- Daily , Weekly | |
| Add BZUN to Watchlist: View: Get Complete BZUN Trend Analysis ➞ | |
 | NOAH Noah Holdings Limited |
| Sector: Financials | |
| SubSector: Asset Management | |
| MarketCap: 1495.33 Millions | |
| Recent Price: 11.99 Smart Investing & Trading Score: 71 | |
| Day Percent Change: -1.64% Day Change: -0.20 | |
| Week Change: 3.18% Year-to-date Change: -13.2% | |
| NOAH Links: Profile News Message Board | |
| Charts:- Daily , Weekly | |
| Add NOAH to Watchlist: View: Get Complete NOAH Trend Analysis ➞ | |
 | FANH Fanhua Inc. |
| Sector: Financials | |
| SubSector: Insurance Brokers | |
| MarketCap: 1436.67 Millions | |
| Recent Price: 3.55 Smart Investing & Trading Score: 42 | |
| Day Percent Change: 0.00% Day Change: 0.00 | |
| Week Change: 1.43% Year-to-date Change: -46.6% | |
| FANH Links: Profile News Message Board | |
| Charts:- Daily , Weekly | |
| Add FANH to Watchlist: View: Get Complete FANH Trend Analysis ➞ | |
 | MSC Studio City International Holdings Limited |
| Sector: Services & Goods | |
| SubSector: Resorts & Casinos | |
| MarketCap: 1420.54 Millions | |
| Recent Price: 7.31 Smart Investing & Trading Score: 46 | |
| Day Percent Change: 1.11% Day Change: 0.08 | |
| Week Change: -2.4% Year-to-date Change: 12.8% | |
| MSC Links: Profile News Message Board | |
| Charts:- Daily , Weekly | |
| Add MSC to Watchlist: View: Get Complete MSC Trend Analysis ➞ | |
 | HSAI Hesai Group |
| Sector: Services & Goods | |
| SubSector: Auto Parts | |
| MarketCap: 1330 Millions | |
| Recent Price: 4.18 Smart Investing & Trading Score: 45 | |
| Day Percent Change: -3.57% Day Change: -0.16 | |
| Week Change: 5.42% Year-to-date Change: -53.9% | |
| HSAI Links: Profile News Message Board | |
| Charts:- Daily , Weekly | |
| Add HSAI to Watchlist: View: Get Complete HSAI Trend Analysis ➞ | |
 | HKD AMTD Digital Inc. |
| Sector: Technology | |
| SubSector: Software - Application | |
| MarketCap: 1200 Millions | |
| Recent Price: 3.20 Smart Investing & Trading Score: 74 | |
| Day Percent Change: -5.33% Day Change: -0.18 | |
| Week Change: 3.9% Year-to-date Change: -22.5% | |
| HKD Links: Profile News Message Board | |
| Charts:- Daily , Weekly | |
| Add HKD to Watchlist: View: Get Complete HKD Trend Analysis ➞ | |
 | GHG GreenTree Hospitality Group Ltd. |
| Sector: Services & Goods | |
| SubSector: Lodging | |
| MarketCap: 1195.36 Millions | |
| Recent Price: 2.76 Smart Investing & Trading Score: 10 | |
| Day Percent Change: -7.69% Day Change: -0.23 | |
| Week Change: -2.61% Year-to-date Change: -26.6% | |
| GHG Links: Profile News Message Board | |
| Charts:- Daily , Weekly | |
| Add GHG to Watchlist: View: Get Complete GHG Trend Analysis ➞ | |
 | TUYA Tuya Inc. |
| Sector: Technology | |
| SubSector: Software - Infrastructure | |
| MarketCap: 1050 Millions | |
| Recent Price: 1.65 Smart Investing & Trading Score: 35 | |
| Day Percent Change: 0.00% Day Change: 0.00 | |
| Week Change: 5.1% Year-to-date Change: -28.1% | |
| TUYA Links: Profile News Message Board | |
| Charts:- Daily , Weekly | |
| Add TUYA to Watchlist: View: Get Complete TUYA Trend Analysis ➞ | |
 | SY So-Young International Inc. |
| Sector: Technology | |
| SubSector: Healthcare Information Services | |
| MarketCap: 1000.55 Millions | |
| Recent Price: 1.22 Smart Investing & Trading Score: 68 | |
| Day Percent Change: 0.00% Day Change: 0.00 | |
| Week Change: 4.72% Year-to-date Change: -5.4% | |
| SY Links: Profile News Message Board | |
| Charts:- Daily , Weekly | |
| Add SY to Watchlist: View: Get Complete SY Trend Analysis ➞ | |
 | QFIN 360 Finance, Inc. |
| Sector: Financials | |
| SubSector: Credit Services | |
| MarketCap: 956.208 Millions | |
| Recent Price: 18.53 Smart Investing & Trading Score: 46 | |
| Day Percent Change: -1.07% Day Change: -0.20 | |
| Week Change: 2.94% Year-to-date Change: 17.1% | |
| QFIN Links: Profile News Message Board | |
| Charts:- Daily , Weekly | |
| Add QFIN to Watchlist: View: Get Complete QFIN Trend Analysis ➞ | |
 | CANG Cango Inc. |
| Sector: Technology | |
| SubSector: Internet Information Providers | |
| MarketCap: 947.48 Millions | |
| Recent Price: 1.39 Smart Investing & Trading Score: 49 | |
| Day Percent Change: 0.72% Day Change: 0.01 | |
| Week Change: -0.71% Year-to-date Change: 36.3% | |
| CANG Links: Profile News Message Board | |
| Charts:- Daily , Weekly | |
| Add CANG to Watchlist: View: Get Complete CANG Trend Analysis ➞ | |
 | WDH Waterdrop Inc. |
| Sector: Financials | |
| SubSector: Insurance - Diversified | |
| MarketCap: 874 Millions | |
| Recent Price: 1.19 Smart Investing & Trading Score: 53 | |
| Day Percent Change: -0.42% Day Change: 0.00 | |
| Week Change: -2.87% Year-to-date Change: 13.2% | |
| WDH Links: Profile News Message Board | |
| Charts:- Daily , Weekly | |
| Add WDH to Watchlist: View: Get Complete WDH Trend Analysis ➞ | |
 | BEDU Bright Scholar Education Holdings Limited |
| Sector: Services & Goods | |
| SubSector: Education & Training Services | |
| MarketCap: 792.406 Millions | |
| Recent Price: 1.99 Smart Investing & Trading Score: 46 | |
| Day Percent Change: 4.74% Day Change: 0.09 | |
| Week Change: -1% Year-to-date Change: 59.2% | |
| BEDU Links: Profile News Message Board | |
| Charts:- Daily , Weekly | |
| Add BEDU to Watchlist: View: Get Complete BEDU Trend Analysis ➞ | |
| For tabular summary view of above stock list: Summary View ➞ 0 - 25 , 25 - 50 , 50 - 75 , 75 - 100 , 100 - 125 , 125 - 150 | ||
| Click To Change The Sort Order: By Market Cap or Company Size Performance: Year-to-date, Week and Day | |
| Select Chart Type: | ||
|
Best Stocks Today 12Stocks.com |
© 2024 12Stocks.com Terms & Conditions Privacy Contact Us
All Information Provided Only For Education And Not To Be Used For Investing or Trading. See Terms & Conditions


One More Thing ... Get Best Stocks Delivered Daily!
Never Ever Miss A Move With Our Top Ten Stocks Lists
Find Best Stocks In Any Market - Bull or Bear Market
Take A Peek At Our Top Ten Stocks Lists: Daily, Weekly, Year-to-Date & Top Trends
Find Best Stocks In Any Market - Bull or Bear Market
Take A Peek At Our Top Ten Stocks Lists: Daily, Weekly, Year-to-Date & Top Trends
China Stocks With Best Up Trends [0-bearish to 100-bullish]: Yatsen Holding[100], Kanzhun [100], JD.com [100], Dada Nexus[100], ZTO Express[100], Alibaba [100], Baozun [95], MOGU [93], Full Truck[93], MINISO [93], U Power[93]
Best China Stocks Year-to-Date:
U Power[2896.65%], DouYu [785.79%], MicroCloud Hologram[668.35%], China Liberal[520.81%], Yatsen Holding[502.79%], Zhongchao [312.22%], Uxin [173.89%], QuantaSing [106.79%], GigaCloud [97.54%], Cheetah Mobile[89.3%], Yiren Digital[60.42%] Best China Stocks This Week:
WiMi Hologram[33.51%], Yatsen Holding[21.99%], Cheetah Mobile[21.92%], iQIYI [16.89%], Golden Heaven[15.91%], TAL Education[15.57%], BeiGene [15.37%], Hutchison China[15.31%], Bilibili [14.62%], Baozun [13.79%], Uxin [13.61%] Best China Stocks Daily:
Boqii Holding[15.69%], MicroCloud Hologram[13.86%], Cheetah Mobile[8.99%], MOGU [8.43%], TAL Education[7.75%], Xiao-I [6.35%], Shengfeng Development[4.90%], 17 Education[4.76%], Bright Scholar[4.74%], Viomi [4.46%], Yatsen Holding[4.01%]